Australian vs Immigrants from Haiti Female Disability
COMPARE
Australian
Immigrants from Haiti
Female Disability
Female Disability Comparison
Australians
Immigrants from Haiti
11.7%
FEMALE DISABILITY
98.3/ 100
METRIC RATING
105th/ 347
METRIC RANK
12.2%
FEMALE DISABILITY
58.8/ 100
METRIC RATING
168th/ 347
METRIC RANK
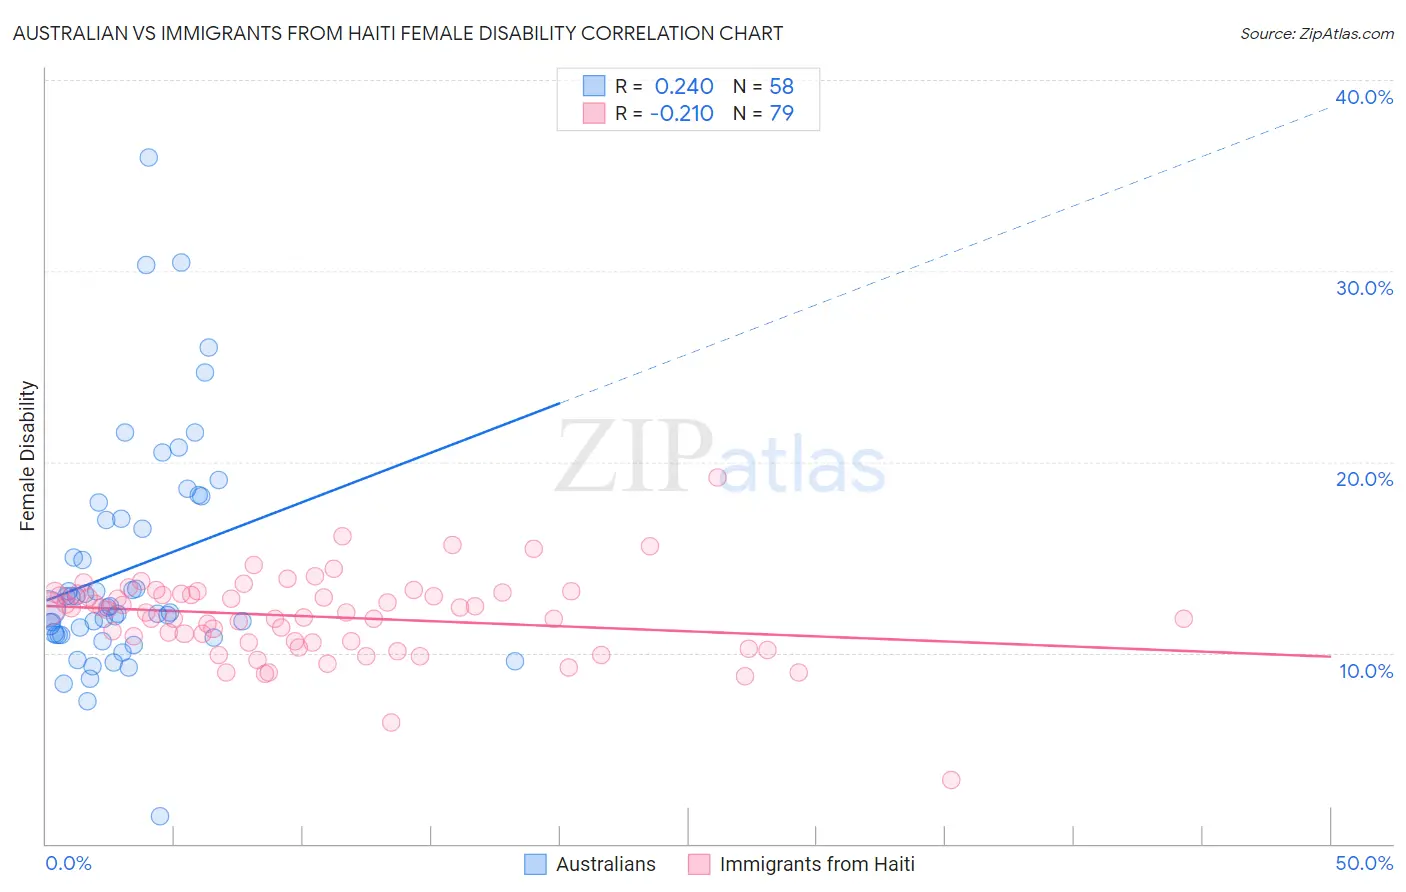
Australian vs Immigrants from Haiti Female Disability Correlation Chart
The statistical analysis conducted on geographies consisting of 224,135,349 people shows a weak positive correlation between the proportion of Australians and percentage of females with a disability in the United States with a correlation coefficient (R) of 0.240 and weighted average of 11.7%. Similarly, the statistical analysis conducted on geographies consisting of 225,238,794 people shows a weak negative correlation between the proportion of Immigrants from Haiti and percentage of females with a disability in the United States with a correlation coefficient (R) of -0.210 and weighted average of 12.2%, a difference of 3.6%.
Female Disability Correlation Summary
| Measurement | Australian | Immigrants from Haiti |
| Minimum | 1.4% | 3.3% |
| Maximum | 36.0% | 19.2% |
| Range | 34.5% | 15.9% |
| Mean | 14.4% | 11.9% |
| Median | 12.3% | 12.1% |
| Interquartile 25% (IQ1) | 11.0% | 10.5% |
| Interquartile 75% (IQ3) | 17.0% | 13.1% |
| Interquartile Range (IQR) | 6.1% | 2.6% |
| Standard Deviation (Sample) | 6.1% | 2.2% |
| Standard Deviation (Population) | 6.0% | 2.2% |
Similar Demographics by Female Disability
Demographics Similar to Australians by Female Disability
In terms of female disability, the demographic groups most similar to Australians are Immigrants from Eastern Africa (11.7%, a difference of 0.020%), Immigrants from Western Asia (11.7%, a difference of 0.020%), Immigrants from Greece (11.7%, a difference of 0.030%), Latvian (11.7%, a difference of 0.050%), and New Zealander (11.7%, a difference of 0.080%).
| Demographics | Rating | Rank | Female Disability |
| Uruguayans | 98.8 /100 | #98 | Exceptional 11.7% |
| Immigrants | Philippines | 98.6 /100 | #99 | Exceptional 11.7% |
| Immigrants | Uruguay | 98.5 /100 | #100 | Exceptional 11.7% |
| Immigrants | Costa Rica | 98.4 /100 | #101 | Exceptional 11.7% |
| Immigrants | South Eastern Asia | 98.4 /100 | #102 | Exceptional 11.7% |
| Immigrants | Eastern Africa | 98.3 /100 | #103 | Exceptional 11.7% |
| Immigrants | Western Asia | 98.3 /100 | #104 | Exceptional 11.7% |
| Australians | 98.3 /100 | #105 | Exceptional 11.7% |
| Immigrants | Greece | 98.2 /100 | #106 | Exceptional 11.7% |
| Latvians | 98.2 /100 | #107 | Exceptional 11.7% |
| New Zealanders | 98.1 /100 | #108 | Exceptional 11.7% |
| Immigrants | Immigrants | 98.1 /100 | #109 | Exceptional 11.7% |
| Soviet Union | 98.1 /100 | #110 | Exceptional 11.7% |
| Costa Ricans | 98.1 /100 | #111 | Exceptional 11.7% |
| Immigrants | Bangladesh | 97.8 /100 | #112 | Exceptional 11.8% |
Demographics Similar to Immigrants from Haiti by Female Disability
In terms of female disability, the demographic groups most similar to Immigrants from Haiti are Immigrants from Latin America (12.2%, a difference of 0.010%), Lithuanian (12.2%, a difference of 0.030%), Lebanese (12.2%, a difference of 0.030%), Maltese (12.2%, a difference of 0.070%), and Immigrants from Southern Europe (12.2%, a difference of 0.10%).
| Demographics | Rating | Rank | Female Disability |
| Guyanese | 64.7 /100 | #161 | Good 12.1% |
| Immigrants | Ukraine | 64.3 /100 | #162 | Good 12.1% |
| Guatemalans | 63.8 /100 | #163 | Good 12.1% |
| Czechs | 63.6 /100 | #164 | Good 12.1% |
| Immigrants | Oceania | 61.8 /100 | #165 | Good 12.1% |
| Lithuanians | 59.5 /100 | #166 | Average 12.2% |
| Immigrants | Latin America | 59.0 /100 | #167 | Average 12.2% |
| Immigrants | Haiti | 58.8 /100 | #168 | Average 12.2% |
| Lebanese | 58.1 /100 | #169 | Average 12.2% |
| Maltese | 57.0 /100 | #170 | Average 12.2% |
| Immigrants | Southern Europe | 56.3 /100 | #171 | Average 12.2% |
| Haitians | 51.9 /100 | #172 | Average 12.2% |
| Immigrants | Mexico | 50.8 /100 | #173 | Average 12.2% |
| Immigrants | England | 50.0 /100 | #174 | Average 12.2% |
| Immigrants | St. Vincent and the Grenadines | 49.7 /100 | #175 | Average 12.2% |