Australian vs British West Indian Female Disability
COMPARE
Australian
British West Indian
Female Disability
Female Disability Comparison
Australians
British West Indians
11.7%
FEMALE DISABILITY
98.3/ 100
METRIC RATING
105th/ 347
METRIC RANK
12.7%
FEMALE DISABILITY
1.2/ 100
METRIC RATING
256th/ 347
METRIC RANK
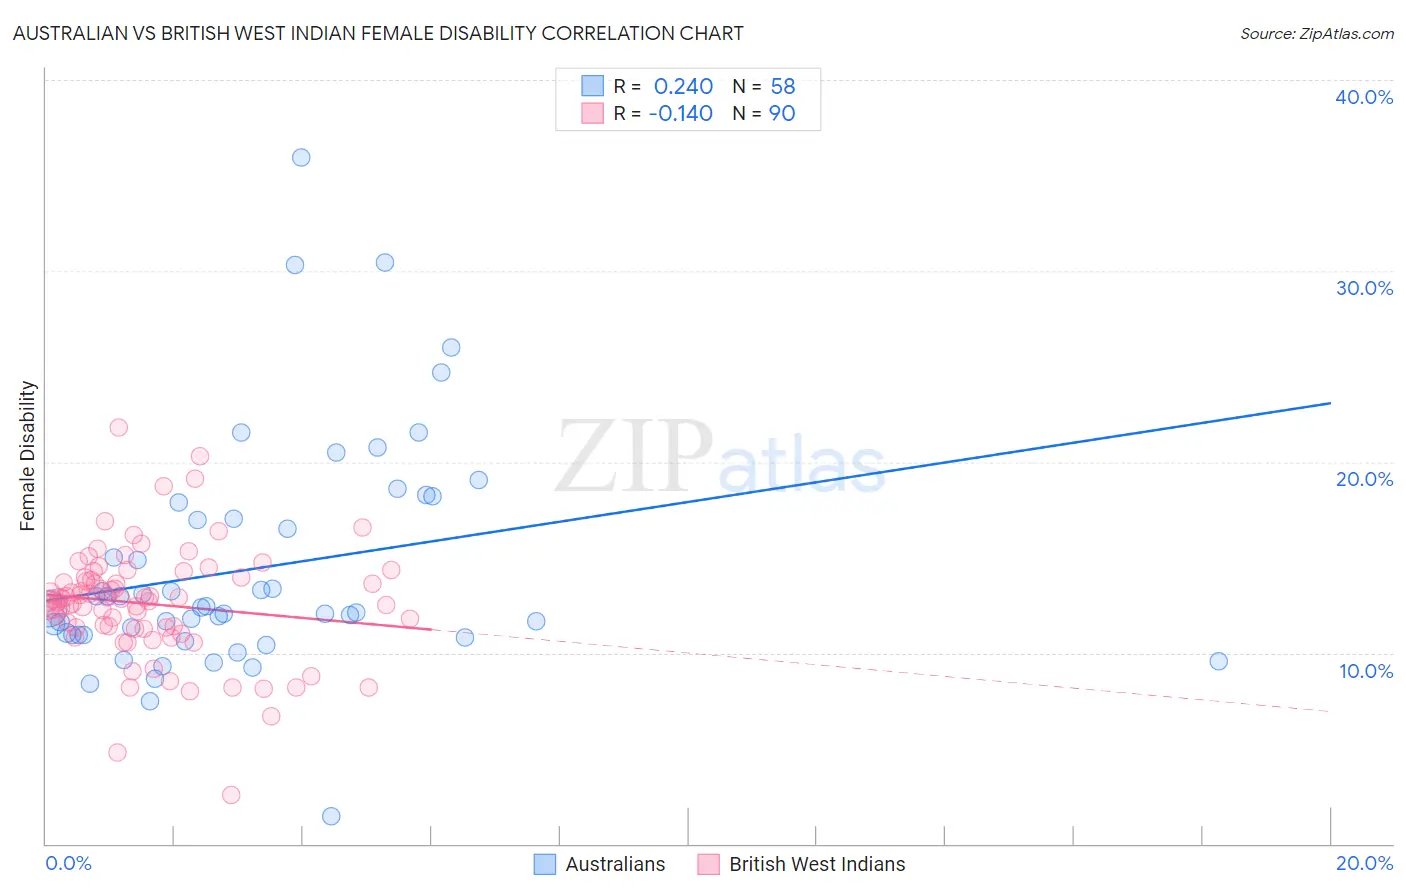
Australian vs British West Indian Female Disability Correlation Chart
The statistical analysis conducted on geographies consisting of 224,135,349 people shows a weak positive correlation between the proportion of Australians and percentage of females with a disability in the United States with a correlation coefficient (R) of 0.240 and weighted average of 11.7%. Similarly, the statistical analysis conducted on geographies consisting of 152,669,776 people shows a poor negative correlation between the proportion of British West Indians and percentage of females with a disability in the United States with a correlation coefficient (R) of -0.140 and weighted average of 12.7%, a difference of 8.3%.
Female Disability Correlation Summary
| Measurement | Australian | British West Indian |
| Minimum | 1.4% | 2.5% |
| Maximum | 36.0% | 21.8% |
| Range | 34.5% | 19.2% |
| Mean | 14.4% | 12.6% |
| Median | 12.3% | 12.8% |
| Interquartile 25% (IQ1) | 11.0% | 11.3% |
| Interquartile 75% (IQ3) | 17.0% | 14.0% |
| Interquartile Range (IQR) | 6.1% | 2.7% |
| Standard Deviation (Sample) | 6.1% | 3.0% |
| Standard Deviation (Population) | 6.0% | 2.9% |
Similar Demographics by Female Disability
Demographics Similar to Australians by Female Disability
In terms of female disability, the demographic groups most similar to Australians are Immigrants from Eastern Africa (11.7%, a difference of 0.020%), Immigrants from Western Asia (11.7%, a difference of 0.020%), Immigrants from Greece (11.7%, a difference of 0.030%), Latvian (11.7%, a difference of 0.050%), and New Zealander (11.7%, a difference of 0.080%).
| Demographics | Rating | Rank | Female Disability |
| Uruguayans | 98.8 /100 | #98 | Exceptional 11.7% |
| Immigrants | Philippines | 98.6 /100 | #99 | Exceptional 11.7% |
| Immigrants | Uruguay | 98.5 /100 | #100 | Exceptional 11.7% |
| Immigrants | Costa Rica | 98.4 /100 | #101 | Exceptional 11.7% |
| Immigrants | South Eastern Asia | 98.4 /100 | #102 | Exceptional 11.7% |
| Immigrants | Eastern Africa | 98.3 /100 | #103 | Exceptional 11.7% |
| Immigrants | Western Asia | 98.3 /100 | #104 | Exceptional 11.7% |
| Australians | 98.3 /100 | #105 | Exceptional 11.7% |
| Immigrants | Greece | 98.2 /100 | #106 | Exceptional 11.7% |
| Latvians | 98.2 /100 | #107 | Exceptional 11.7% |
| New Zealanders | 98.1 /100 | #108 | Exceptional 11.7% |
| Immigrants | Immigrants | 98.1 /100 | #109 | Exceptional 11.7% |
| Soviet Union | 98.1 /100 | #110 | Exceptional 11.7% |
| Costa Ricans | 98.1 /100 | #111 | Exceptional 11.7% |
| Immigrants | Bangladesh | 97.8 /100 | #112 | Exceptional 11.8% |
Demographics Similar to British West Indians by Female Disability
In terms of female disability, the demographic groups most similar to British West Indians are Liberian (12.7%, a difference of 0.030%), Aleut (12.7%, a difference of 0.030%), Immigrants from Germany (12.7%, a difference of 0.070%), Immigrants from Armenia (12.7%, a difference of 0.11%), and Subsaharan African (12.7%, a difference of 0.13%).
| Demographics | Rating | Rank | Female Disability |
| Immigrants | Congo | 1.8 /100 | #249 | Tragic 12.7% |
| Slovenes | 1.7 /100 | #250 | Tragic 12.7% |
| Crow | 1.6 /100 | #251 | Tragic 12.7% |
| Immigrants | Caribbean | 1.4 /100 | #252 | Tragic 12.7% |
| Jamaicans | 1.4 /100 | #253 | Tragic 12.7% |
| Hawaiians | 1.4 /100 | #254 | Tragic 12.7% |
| Immigrants | Germany | 1.3 /100 | #255 | Tragic 12.7% |
| British West Indians | 1.2 /100 | #256 | Tragic 12.7% |
| Liberians | 1.1 /100 | #257 | Tragic 12.7% |
| Aleuts | 1.1 /100 | #258 | Tragic 12.7% |
| Immigrants | Armenia | 1.0 /100 | #259 | Tragic 12.7% |
| Sub-Saharan Africans | 1.0 /100 | #260 | Tragic 12.7% |
| Bermudans | 1.0 /100 | #261 | Tragic 12.7% |
| Czechoslovakians | 0.9 /100 | #262 | Tragic 12.7% |
| Spaniards | 0.7 /100 | #263 | Tragic 12.8% |