Assyrian/Chaldean/Syriac vs Nigerian 12th Grade, No Diploma
COMPARE
Assyrian/Chaldean/Syriac
Nigerian
12th Grade, No Diploma
12th Grade, No Diploma Comparison
Assyrians/Chaldeans/Syriacs
Nigerians
91.8%
12TH GRADE, NO DIPLOMA
89.6/ 100
METRIC RATING
130th/ 347
METRIC RANK
90.3%
12TH GRADE, NO DIPLOMA
4.5/ 100
METRIC RATING
227th/ 347
METRIC RANK
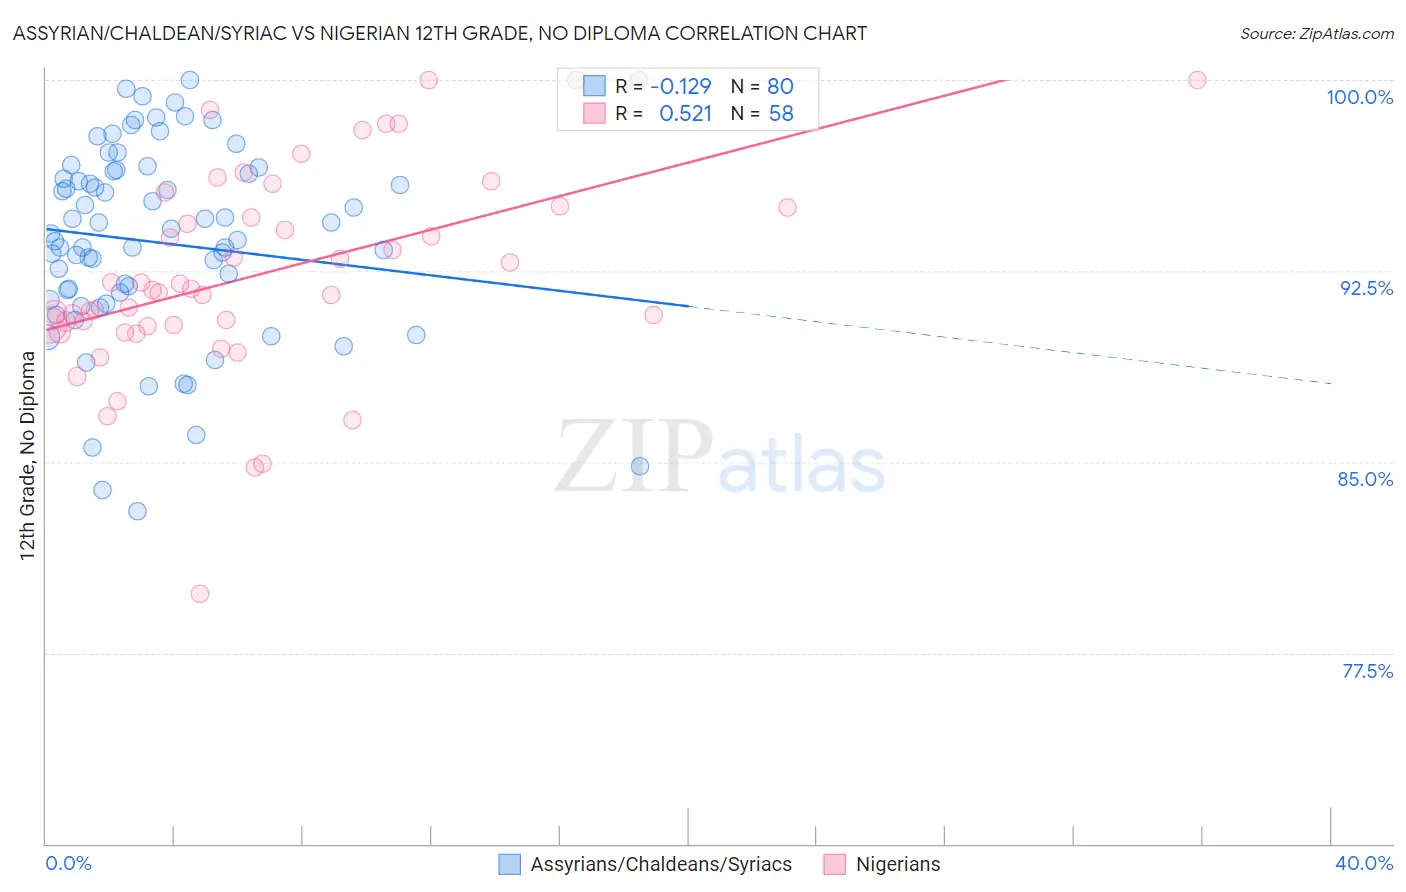
Assyrian/Chaldean/Syriac vs Nigerian 12th Grade, No Diploma Correlation Chart
The statistical analysis conducted on geographies consisting of 110,318,125 people shows a poor negative correlation between the proportion of Assyrians/Chaldeans/Syriacs and percentage of population with at least 12th grade (no diploma) education in the United States with a correlation coefficient (R) of -0.129 and weighted average of 91.8%. Similarly, the statistical analysis conducted on geographies consisting of 332,724,627 people shows a substantial positive correlation between the proportion of Nigerians and percentage of population with at least 12th grade (no diploma) education in the United States with a correlation coefficient (R) of 0.521 and weighted average of 90.3%, a difference of 1.6%.
12th Grade, No Diploma Correlation Summary
| Measurement | Assyrian/Chaldean/Syriac | Nigerian |
| Minimum | 83.1% | 79.8% |
| Maximum | 100.0% | 100.0% |
| Range | 16.9% | 20.2% |
| Mean | 93.6% | 92.5% |
| Median | 93.8% | 91.8% |
| Interquartile 25% (IQ1) | 91.5% | 90.4% |
| Interquartile 75% (IQ3) | 96.4% | 95.0% |
| Interquartile Range (IQR) | 4.9% | 4.7% |
| Standard Deviation (Sample) | 3.8% | 4.1% |
| Standard Deviation (Population) | 3.7% | 4.1% |
Similar Demographics by 12th Grade, No Diploma
Demographics Similar to Assyrians/Chaldeans/Syriacs by 12th Grade, No Diploma
In terms of 12th grade, no diploma, the demographic groups most similar to Assyrians/Chaldeans/Syriacs are German Russian (91.8%, a difference of 0.0%), Mongolian (91.8%, a difference of 0.010%), Albanian (91.8%, a difference of 0.010%), Immigrants from Eastern Asia (91.8%, a difference of 0.010%), and Immigrants from Italy (91.7%, a difference of 0.040%).
| Demographics | Rating | Rank | 12th Grade, No Diploma |
| Egyptians | 92.5 /100 | #123 | Exceptional 91.9% |
| Immigrants | Ukraine | 91.6 /100 | #124 | Exceptional 91.8% |
| Whites/Caucasians | 91.6 /100 | #125 | Exceptional 91.8% |
| Basques | 91.3 /100 | #126 | Exceptional 91.8% |
| Immigrants | Jordan | 91.0 /100 | #127 | Exceptional 91.8% |
| Mongolians | 89.9 /100 | #128 | Excellent 91.8% |
| German Russians | 89.8 /100 | #129 | Excellent 91.8% |
| Assyrians/Chaldeans/Syriacs | 89.6 /100 | #130 | Excellent 91.8% |
| Albanians | 89.3 /100 | #131 | Excellent 91.8% |
| Immigrants | Eastern Asia | 89.3 /100 | #132 | Excellent 91.8% |
| Immigrants | Italy | 88.3 /100 | #133 | Excellent 91.7% |
| Venezuelans | 88.2 /100 | #134 | Excellent 91.7% |
| Immigrants | Bosnia and Herzegovina | 87.3 /100 | #135 | Excellent 91.7% |
| Chileans | 85.8 /100 | #136 | Excellent 91.7% |
| Alaska Natives | 84.9 /100 | #137 | Excellent 91.6% |
Demographics Similar to Nigerians by 12th Grade, No Diploma
In terms of 12th grade, no diploma, the demographic groups most similar to Nigerians are Immigrants from Zaire (90.3%, a difference of 0.010%), Immigrants from Panama (90.3%, a difference of 0.020%), Chickasaw (90.3%, a difference of 0.020%), South American (90.3%, a difference of 0.030%), and Immigrants from Somalia (90.4%, a difference of 0.050%).
| Demographics | Rating | Rank | 12th Grade, No Diploma |
| Colombians | 6.6 /100 | #220 | Tragic 90.4% |
| Immigrants | Liberia | 5.7 /100 | #221 | Tragic 90.4% |
| Immigrants | Somalia | 5.3 /100 | #222 | Tragic 90.4% |
| South Americans | 5.0 /100 | #223 | Tragic 90.3% |
| Immigrants | Panama | 4.8 /100 | #224 | Tragic 90.3% |
| Chickasaw | 4.8 /100 | #225 | Tragic 90.3% |
| Immigrants | Zaire | 4.6 /100 | #226 | Tragic 90.3% |
| Nigerians | 4.5 /100 | #227 | Tragic 90.3% |
| Creek | 3.9 /100 | #228 | Tragic 90.3% |
| Immigrants | Bahamas | 3.6 /100 | #229 | Tragic 90.2% |
| Immigrants | Philippines | 2.8 /100 | #230 | Tragic 90.2% |
| Peruvians | 2.7 /100 | #231 | Tragic 90.2% |
| Blackfeet | 2.4 /100 | #232 | Tragic 90.1% |
| Immigrants | Thailand | 2.3 /100 | #233 | Tragic 90.1% |
| Immigrants | South America | 2.3 /100 | #234 | Tragic 90.1% |