Assyrian/Chaldean/Syriac vs Cheyenne Unemployment Among Seniors over 75 years
COMPARE
Assyrian/Chaldean/Syriac
Cheyenne
Unemployment Among Seniors over 75 years
Unemployment Among Seniors over 75 years Comparison
Assyrians/Chaldeans/Syriacs
Cheyenne
11.1%
UNEMPLOYMENT AMONG SENIORS OVER 75 YEARS
0.0/ 100
METRIC RATING
334th/ 347
METRIC RANK
5.9%
UNEMPLOYMENT AMONG SENIORS OVER 75 YEARS
100.0/ 100
METRIC RATING
3rd/ 347
METRIC RANK
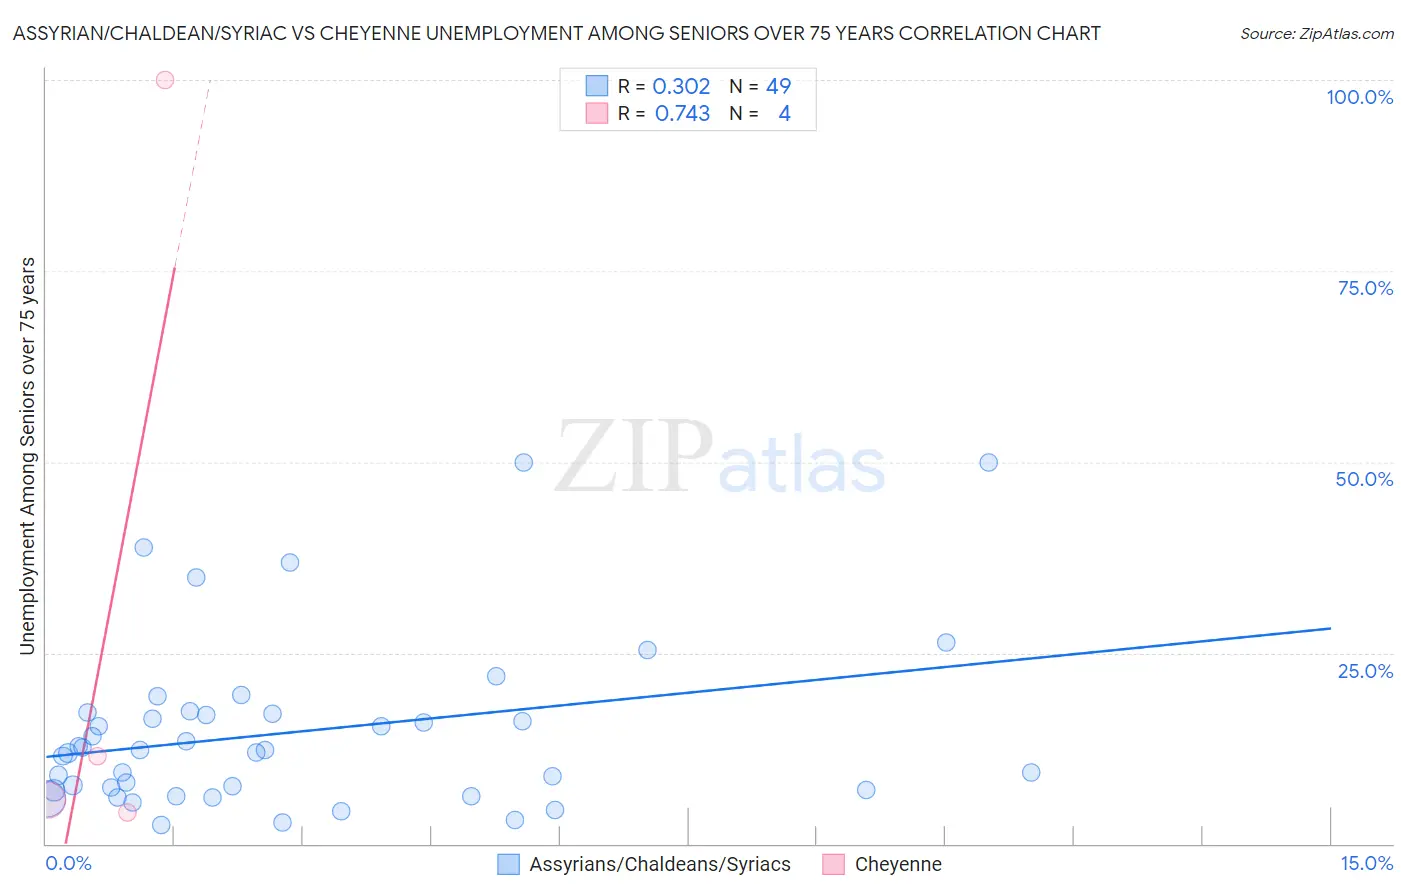
Assyrian/Chaldean/Syriac vs Cheyenne Unemployment Among Seniors over 75 years Correlation Chart
The statistical analysis conducted on geographies consisting of 82,071,113 people shows a mild positive correlation between the proportion of Assyrians/Chaldeans/Syriacs and unemployment rate among seniors over the age of 75 in the United States with a correlation coefficient (R) of 0.302 and weighted average of 11.1%. Similarly, the statistical analysis conducted on geographies consisting of 63,002,461 people shows a strong positive correlation between the proportion of Cheyenne and unemployment rate among seniors over the age of 75 in the United States with a correlation coefficient (R) of 0.743 and weighted average of 5.9%, a difference of 86.0%.
Unemployment Among Seniors over 75 years Correlation Summary
| Measurement | Assyrian/Chaldean/Syriac | Cheyenne |
| Minimum | 2.4% | 4.1% |
| Maximum | 50.0% | 100.0% |
| Range | 47.6% | 95.9% |
| Mean | 14.6% | 30.4% |
| Median | 12.2% | 8.6% |
| Interquartile 25% (IQ1) | 7.0% | 5.0% |
| Interquartile 75% (IQ3) | 17.2% | 55.8% |
| Interquartile Range (IQR) | 10.2% | 50.8% |
| Standard Deviation (Sample) | 11.1% | 46.5% |
| Standard Deviation (Population) | 11.0% | 40.3% |
Similar Demographics by Unemployment Among Seniors over 75 years
Demographics Similar to Assyrians/Chaldeans/Syriacs by Unemployment Among Seniors over 75 years
In terms of unemployment among seniors over 75 years, the demographic groups most similar to Assyrians/Chaldeans/Syriacs are Alaskan Athabascan (11.0%, a difference of 0.35%), French Canadian (11.2%, a difference of 1.1%), Immigrants from Liberia (10.9%, a difference of 1.5%), Tohono O'odham (10.8%, a difference of 2.2%), and Immigrants from North Macedonia (11.3%, a difference of 2.3%).
| Demographics | Rating | Rank | Unemployment Among Seniors over 75 years |
| Dutch | 0.0 /100 | #327 | Tragic 10.4% |
| Immigrants | Portugal | 0.0 /100 | #328 | Tragic 10.5% |
| Tsimshian | 0.0 /100 | #329 | Tragic 10.5% |
| Immigrants | Azores | 0.0 /100 | #330 | Tragic 10.7% |
| Tohono O'odham | 0.0 /100 | #331 | Tragic 10.8% |
| Immigrants | Liberia | 0.0 /100 | #332 | Tragic 10.9% |
| Alaskan Athabascans | 0.0 /100 | #333 | Tragic 11.0% |
| Assyrians/Chaldeans/Syriacs | 0.0 /100 | #334 | Tragic 11.1% |
| French Canadians | 0.0 /100 | #335 | Tragic 11.2% |
| Immigrants | North Macedonia | 0.0 /100 | #336 | Tragic 11.3% |
| Cape Verdeans | 0.0 /100 | #337 | Tragic 11.4% |
| Immigrants | Cabo Verde | 0.0 /100 | #338 | Tragic 12.3% |
| Cajuns | 0.0 /100 | #339 | Tragic 12.5% |
| Yup'ik | 0.0 /100 | #340 | Tragic 12.8% |
| Lumbee | 0.0 /100 | #341 | Tragic 13.5% |
Demographics Similar to Cheyenne by Unemployment Among Seniors over 75 years
In terms of unemployment among seniors over 75 years, the demographic groups most similar to Cheyenne are Chinese (5.9%, a difference of 0.55%), Crow (5.9%, a difference of 0.56%), Alsatian (6.1%, a difference of 2.9%), Hopi (6.3%, a difference of 5.6%), and Immigrants from Armenia (6.5%, a difference of 9.6%).
| Demographics | Rating | Rank | Unemployment Among Seniors over 75 years |
| Crow | 100.0 /100 | #1 | Exceptional 5.9% |
| Chinese | 100.0 /100 | #2 | Exceptional 5.9% |
| Cheyenne | 100.0 /100 | #3 | Exceptional 5.9% |
| Alsatians | 100.0 /100 | #4 | Exceptional 6.1% |
| Hopi | 100.0 /100 | #5 | Exceptional 6.3% |
| Immigrants | Armenia | 100.0 /100 | #6 | Exceptional 6.5% |
| Spanish American Indians | 100.0 /100 | #7 | Exceptional 6.5% |
| Taiwanese | 100.0 /100 | #8 | Exceptional 6.6% |
| Soviet Union | 100.0 /100 | #9 | Exceptional 6.6% |
| Yuman | 100.0 /100 | #10 | Exceptional 6.7% |
| Immigrants | Grenada | 100.0 /100 | #11 | Exceptional 6.7% |
| Comanche | 100.0 /100 | #12 | Exceptional 6.7% |
| Immigrants | Congo | 100.0 /100 | #13 | Exceptional 6.7% |
| Ute | 100.0 /100 | #14 | Exceptional 6.8% |
| Icelanders | 100.0 /100 | #15 | Exceptional 7.0% |