Asian vs European Vision Disability
COMPARE
Asian
European
Vision Disability
Vision Disability Comparison
Asians
Europeans
1.9%
VISION DISABILITY
100.0/ 100
METRIC RATING
20th/ 347
METRIC RANK
2.2%
VISION DISABILITY
25.7/ 100
METRIC RATING
192nd/ 347
METRIC RANK
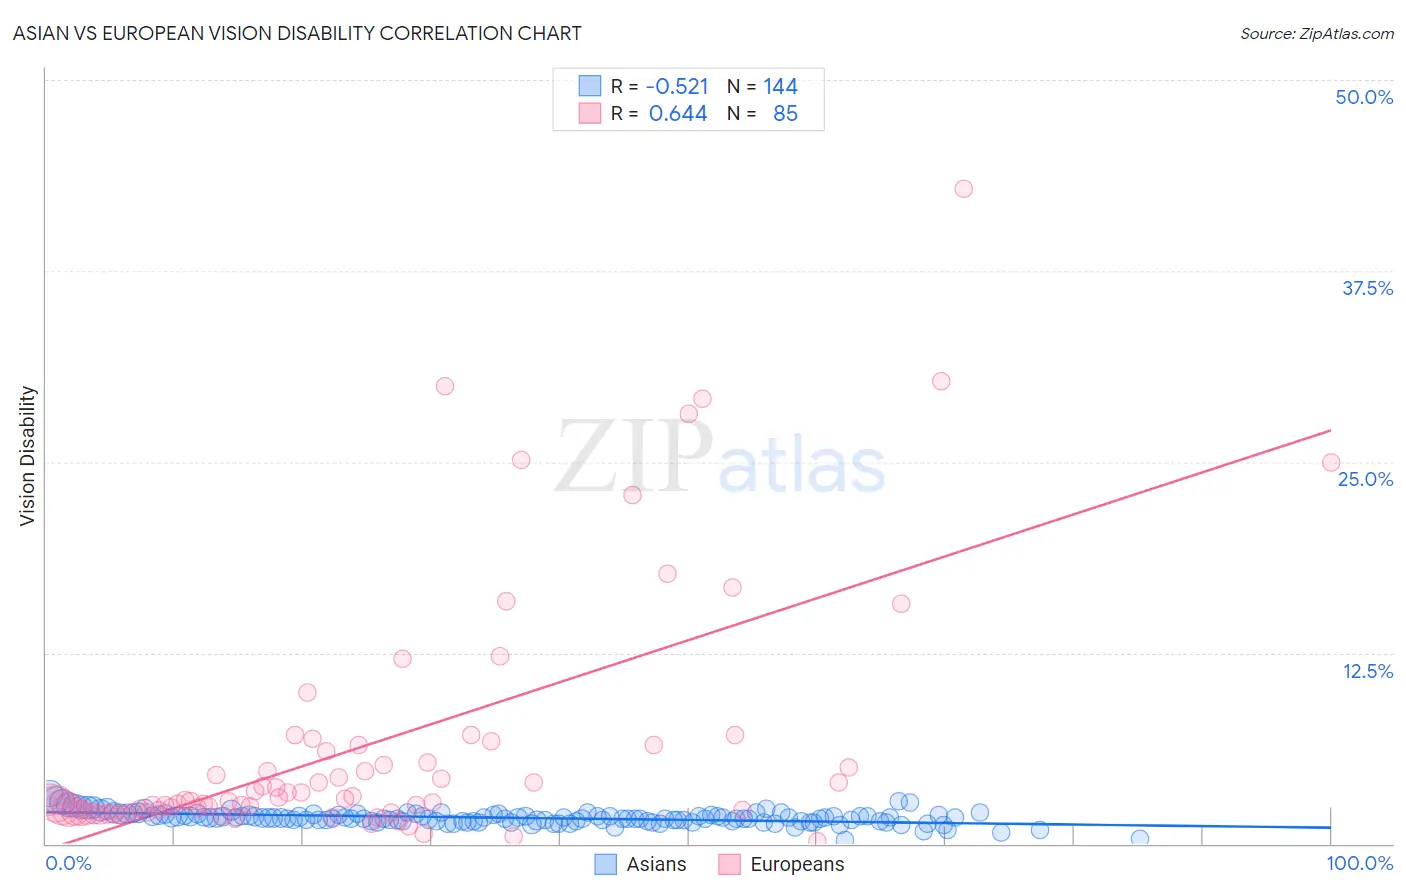
Asian vs European Vision Disability Correlation Chart
The statistical analysis conducted on geographies consisting of 549,556,904 people shows a substantial negative correlation between the proportion of Asians and percentage of population with vision disability in the United States with a correlation coefficient (R) of -0.521 and weighted average of 1.9%. Similarly, the statistical analysis conducted on geographies consisting of 560,182,273 people shows a significant positive correlation between the proportion of Europeans and percentage of population with vision disability in the United States with a correlation coefficient (R) of 0.644 and weighted average of 2.2%, a difference of 15.9%.
Vision Disability Correlation Summary
| Measurement | Asian | European |
| Minimum | 0.21% | 0.14% |
| Maximum | 3.3% | 42.9% |
| Range | 3.1% | 42.7% |
| Mean | 1.7% | 6.5% |
| Median | 1.7% | 2.9% |
| Interquartile 25% (IQ1) | 1.5% | 2.1% |
| Interquartile 75% (IQ3) | 1.9% | 6.5% |
| Interquartile Range (IQR) | 0.42% | 4.4% |
| Standard Deviation (Sample) | 0.41% | 8.3% |
| Standard Deviation (Population) | 0.41% | 8.3% |
Similar Demographics by Vision Disability
Demographics Similar to Asians by Vision Disability
In terms of vision disability, the demographic groups most similar to Asians are Turkish (1.9%, a difference of 0.31%), Immigrants from Pakistan (1.9%, a difference of 0.35%), Immigrants from Asia (1.9%, a difference of 0.89%), Immigrants from Lithuania (1.9%, a difference of 1.0%), and Bulgarian (1.9%, a difference of 1.1%).
| Demographics | Rating | Rank | Vision Disability |
| Immigrants | Eastern Asia | 100.0 /100 | #13 | Exceptional 1.8% |
| Immigrants | China | 100.0 /100 | #14 | Exceptional 1.8% |
| Immigrants | Bolivia | 100.0 /100 | #15 | Exceptional 1.8% |
| Indians (Asian) | 100.0 /100 | #16 | Exceptional 1.8% |
| Burmese | 100.0 /100 | #17 | Exceptional 1.8% |
| Bolivians | 100.0 /100 | #18 | Exceptional 1.9% |
| Immigrants | Sri Lanka | 100.0 /100 | #19 | Exceptional 1.9% |
| Asians | 100.0 /100 | #20 | Exceptional 1.9% |
| Turks | 100.0 /100 | #21 | Exceptional 1.9% |
| Immigrants | Pakistan | 100.0 /100 | #22 | Exceptional 1.9% |
| Immigrants | Asia | 99.9 /100 | #23 | Exceptional 1.9% |
| Immigrants | Lithuania | 99.9 /100 | #24 | Exceptional 1.9% |
| Bulgarians | 99.9 /100 | #25 | Exceptional 1.9% |
| Immigrants | Japan | 99.9 /100 | #26 | Exceptional 1.9% |
| Taiwanese | 99.9 /100 | #27 | Exceptional 1.9% |
Demographics Similar to Europeans by Vision Disability
In terms of vision disability, the demographic groups most similar to Europeans are Canadian (2.2%, a difference of 0.010%), Immigrants from Costa Rica (2.2%, a difference of 0.030%), British (2.2%, a difference of 0.050%), Salvadoran (2.2%, a difference of 0.13%), and Immigrants from Barbados (2.2%, a difference of 0.15%).
| Demographics | Rating | Rank | Vision Disability |
| Immigrants | Middle Africa | 33.5 /100 | #185 | Fair 2.2% |
| Native Hawaiians | 33.3 /100 | #186 | Fair 2.2% |
| Immigrants | St. Vincent and the Grenadines | 30.3 /100 | #187 | Fair 2.2% |
| Guyanese | 28.9 /100 | #188 | Fair 2.2% |
| Salvadorans | 27.4 /100 | #189 | Fair 2.2% |
| Immigrants | Costa Rica | 26.1 /100 | #190 | Fair 2.2% |
| Canadians | 25.8 /100 | #191 | Fair 2.2% |
| Europeans | 25.7 /100 | #192 | Fair 2.2% |
| British | 25.1 /100 | #193 | Fair 2.2% |
| Immigrants | Barbados | 24.0 /100 | #194 | Fair 2.2% |
| Immigrants | Immigrants | 23.7 /100 | #195 | Fair 2.2% |
| Immigrants | Grenada | 23.1 /100 | #196 | Fair 2.2% |
| Ghanaians | 21.8 /100 | #197 | Fair 2.2% |
| Czechoslovakians | 21.6 /100 | #198 | Fair 2.2% |
| Immigrants | El Salvador | 21.0 /100 | #199 | Fair 2.2% |