Korean vs Soviet Union Vision Disability
COMPARE
Korean
Soviet Union
Vision Disability
Vision Disability Comparison
Koreans
Soviet Union
2.1%
VISION DISABILITY
94.1/ 100
METRIC RATING
108th/ 347
METRIC RANK
2.0%
VISION DISABILITY
97.6/ 100
METRIC RATING
81st/ 347
METRIC RANK
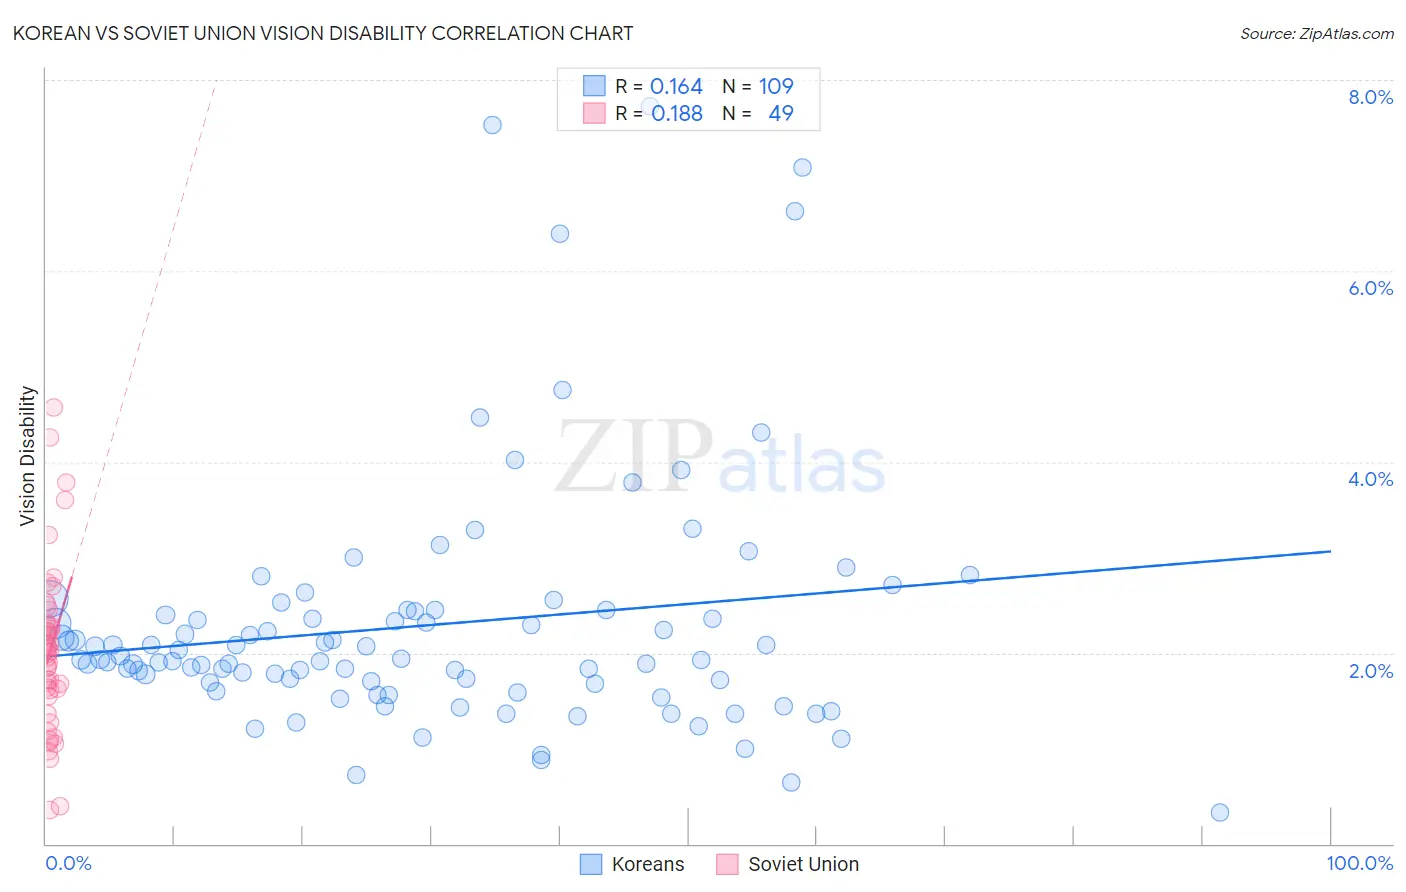
Korean vs Soviet Union Vision Disability Correlation Chart
The statistical analysis conducted on geographies consisting of 510,182,066 people shows a poor positive correlation between the proportion of Koreans and percentage of population with vision disability in the United States with a correlation coefficient (R) of 0.164 and weighted average of 2.1%. Similarly, the statistical analysis conducted on geographies consisting of 43,504,651 people shows a poor positive correlation between the proportion of Soviet Union and percentage of population with vision disability in the United States with a correlation coefficient (R) of 0.188 and weighted average of 2.0%, a difference of 1.6%.
Vision Disability Correlation Summary
| Measurement | Korean | Soviet Union |
| Minimum | 0.33% | 0.35% |
| Maximum | 7.7% | 4.6% |
| Range | 7.4% | 4.2% |
| Mean | 2.3% | 2.0% |
| Median | 1.9% | 2.0% |
| Interquartile 25% (IQ1) | 1.7% | 1.6% |
| Interquartile 75% (IQ3) | 2.4% | 2.3% |
| Interquartile Range (IQR) | 0.76% | 0.72% |
| Standard Deviation (Sample) | 1.3% | 0.86% |
| Standard Deviation (Population) | 1.3% | 0.85% |
Similar Demographics by Vision Disability
Demographics Similar to Koreans by Vision Disability
In terms of vision disability, the demographic groups most similar to Koreans are Chilean (2.1%, a difference of 0.020%), Swedish (2.1%, a difference of 0.030%), Danish (2.1%, a difference of 0.030%), Carpatho Rusyn (2.1%, a difference of 0.080%), and Immigrants from Italy (2.1%, a difference of 0.090%).
| Demographics | Rating | Rank | Vision Disability |
| Albanians | 94.9 /100 | #101 | Exceptional 2.1% |
| Sri Lankans | 94.8 /100 | #102 | Exceptional 2.1% |
| Immigrants | Austria | 94.4 /100 | #103 | Exceptional 2.1% |
| Immigrants | Italy | 94.4 /100 | #104 | Exceptional 2.1% |
| Carpatho Rusyns | 94.3 /100 | #105 | Exceptional 2.1% |
| Swedes | 94.2 /100 | #106 | Exceptional 2.1% |
| Danes | 94.2 /100 | #107 | Exceptional 2.1% |
| Koreans | 94.1 /100 | #108 | Exceptional 2.1% |
| Chileans | 94.0 /100 | #109 | Exceptional 2.1% |
| Immigrants | Armenia | 93.8 /100 | #110 | Exceptional 2.1% |
| Peruvians | 93.5 /100 | #111 | Exceptional 2.1% |
| Immigrants | Denmark | 92.9 /100 | #112 | Exceptional 2.1% |
| Kenyans | 92.5 /100 | #113 | Exceptional 2.1% |
| Croatians | 92.3 /100 | #114 | Exceptional 2.1% |
| Immigrants | Vietnam | 92.2 /100 | #115 | Exceptional 2.1% |
Demographics Similar to Soviet Union by Vision Disability
In terms of vision disability, the demographic groups most similar to Soviet Union are Immigrants from Poland (2.0%, a difference of 0.020%), Lithuanian (2.0%, a difference of 0.060%), Immigrants from Western Asia (2.0%, a difference of 0.11%), Immigrants from Latvia (2.0%, a difference of 0.22%), and Chinese (2.0%, a difference of 0.28%).
| Demographics | Rating | Rank | Vision Disability |
| Palestinians | 98.3 /100 | #74 | Exceptional 2.0% |
| Immigrants | North Macedonia | 98.3 /100 | #75 | Exceptional 2.0% |
| Paraguayans | 98.3 /100 | #76 | Exceptional 2.0% |
| Immigrants | Jordan | 98.3 /100 | #77 | Exceptional 2.0% |
| Immigrants | Eastern Europe | 98.3 /100 | #78 | Exceptional 2.0% |
| Assyrians/Chaldeans/Syriacs | 98.1 /100 | #79 | Exceptional 2.0% |
| Lithuanians | 97.7 /100 | #80 | Exceptional 2.0% |
| Soviet Union | 97.6 /100 | #81 | Exceptional 2.0% |
| Immigrants | Poland | 97.6 /100 | #82 | Exceptional 2.0% |
| Immigrants | Western Asia | 97.5 /100 | #83 | Exceptional 2.0% |
| Immigrants | Latvia | 97.3 /100 | #84 | Exceptional 2.0% |
| Chinese | 97.2 /100 | #85 | Exceptional 2.0% |
| Immigrants | Moldova | 97.2 /100 | #86 | Exceptional 2.0% |
| Immigrants | Switzerland | 97.0 /100 | #87 | Exceptional 2.0% |
| Norwegians | 97.0 /100 | #88 | Exceptional 2.0% |