Immigrants from Lebanon vs Soviet Union Vision Disability
COMPARE
Immigrants from Lebanon
Soviet Union
Vision Disability
Vision Disability Comparison
Immigrants from Lebanon
Soviet Union
2.1%
VISION DISABILITY
96.7/ 100
METRIC RATING
90th/ 347
METRIC RANK
2.0%
VISION DISABILITY
97.6/ 100
METRIC RATING
81st/ 347
METRIC RANK
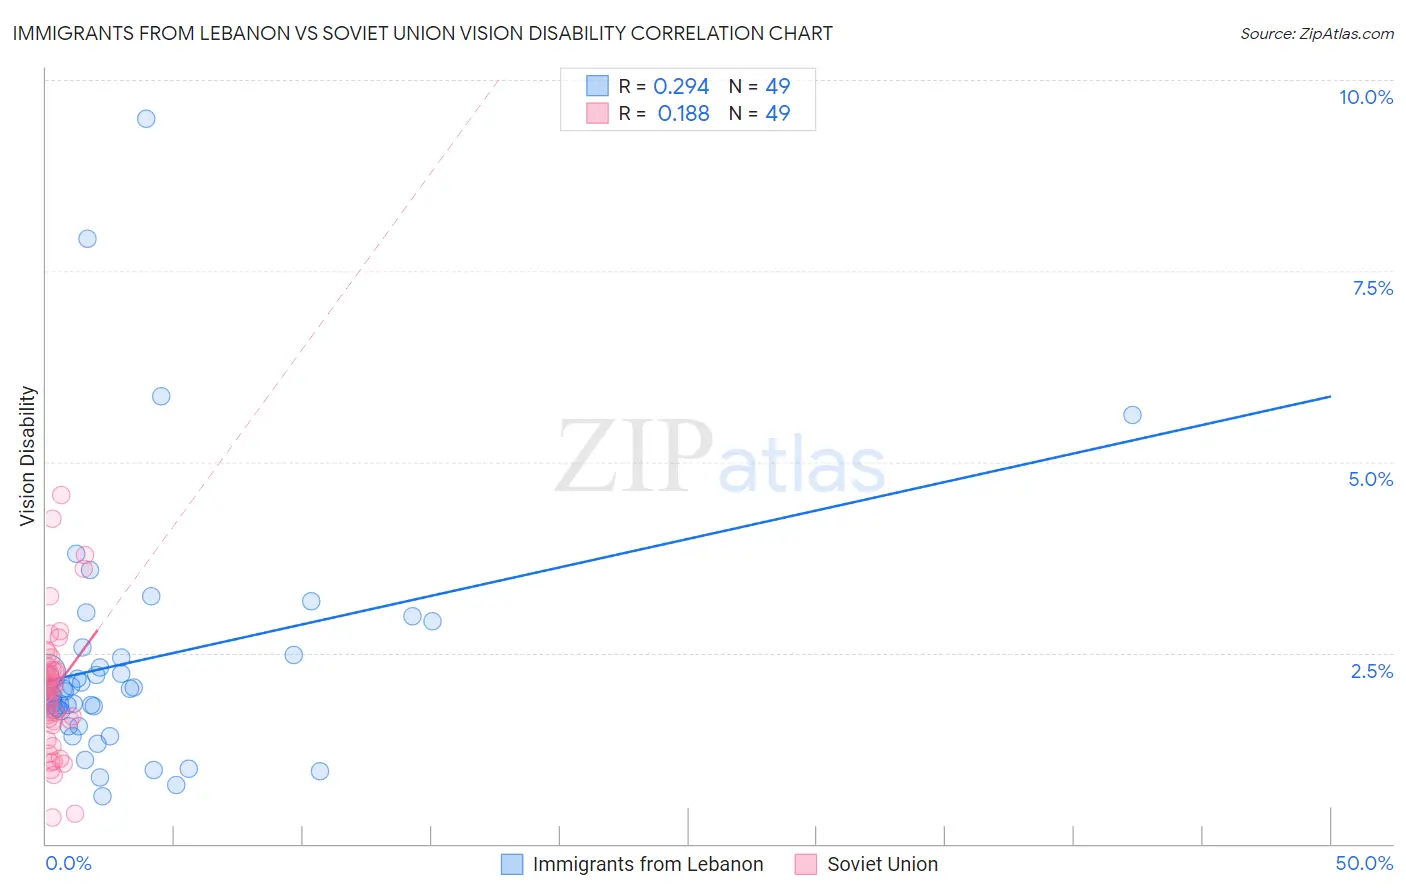
Immigrants from Lebanon vs Soviet Union Vision Disability Correlation Chart
The statistical analysis conducted on geographies consisting of 217,113,060 people shows a weak positive correlation between the proportion of Immigrants from Lebanon and percentage of population with vision disability in the United States with a correlation coefficient (R) of 0.294 and weighted average of 2.1%. Similarly, the statistical analysis conducted on geographies consisting of 43,504,651 people shows a poor positive correlation between the proportion of Soviet Union and percentage of population with vision disability in the United States with a correlation coefficient (R) of 0.188 and weighted average of 2.0%, a difference of 0.56%.
Vision Disability Correlation Summary
| Measurement | Immigrants from Lebanon | Soviet Union |
| Minimum | 0.62% | 0.35% |
| Maximum | 9.5% | 4.6% |
| Range | 8.9% | 4.2% |
| Mean | 2.4% | 2.0% |
| Median | 2.0% | 2.0% |
| Interquartile 25% (IQ1) | 1.6% | 1.6% |
| Interquartile 75% (IQ3) | 2.5% | 2.3% |
| Interquartile Range (IQR) | 0.88% | 0.72% |
| Standard Deviation (Sample) | 1.7% | 0.86% |
| Standard Deviation (Population) | 1.7% | 0.85% |
Demographics Similar to Immigrants from Lebanon and Soviet Union by Vision Disability
In terms of vision disability, the demographic groups most similar to Immigrants from Lebanon are Immigrants from Eastern Africa (2.0%, a difference of 0.14%), Norwegian (2.0%, a difference of 0.18%), Immigrants from Switzerland (2.0%, a difference of 0.19%), Immigrants from Somalia (2.1%, a difference of 0.23%), and Immigrants from Syria (2.1%, a difference of 0.24%). Similarly, the demographic groups most similar to Soviet Union are Immigrants from Poland (2.0%, a difference of 0.020%), Lithuanian (2.0%, a difference of 0.060%), Immigrants from Western Asia (2.0%, a difference of 0.11%), Immigrants from Latvia (2.0%, a difference of 0.22%), and Chinese (2.0%, a difference of 0.28%).
| Demographics | Rating | Rank | Vision Disability |
| Immigrants | North Macedonia | 98.3 /100 | #75 | Exceptional 2.0% |
| Paraguayans | 98.3 /100 | #76 | Exceptional 2.0% |
| Immigrants | Jordan | 98.3 /100 | #77 | Exceptional 2.0% |
| Immigrants | Eastern Europe | 98.3 /100 | #78 | Exceptional 2.0% |
| Assyrians/Chaldeans/Syriacs | 98.1 /100 | #79 | Exceptional 2.0% |
| Lithuanians | 97.7 /100 | #80 | Exceptional 2.0% |
| Soviet Union | 97.6 /100 | #81 | Exceptional 2.0% |
| Immigrants | Poland | 97.6 /100 | #82 | Exceptional 2.0% |
| Immigrants | Western Asia | 97.5 /100 | #83 | Exceptional 2.0% |
| Immigrants | Latvia | 97.3 /100 | #84 | Exceptional 2.0% |
| Chinese | 97.2 /100 | #85 | Exceptional 2.0% |
| Immigrants | Moldova | 97.2 /100 | #86 | Exceptional 2.0% |
| Immigrants | Switzerland | 97.0 /100 | #87 | Exceptional 2.0% |
| Norwegians | 97.0 /100 | #88 | Exceptional 2.0% |
| Immigrants | Eastern Africa | 97.0 /100 | #89 | Exceptional 2.0% |
| Immigrants | Lebanon | 96.7 /100 | #90 | Exceptional 2.1% |
| Immigrants | Somalia | 96.2 /100 | #91 | Exceptional 2.1% |
| Immigrants | Syria | 96.2 /100 | #92 | Exceptional 2.1% |
| Immigrants | Europe | 96.1 /100 | #93 | Exceptional 2.1% |
| Immigrants | Croatia | 96.0 /100 | #94 | Exceptional 2.1% |
| Australians | 95.9 /100 | #95 | Exceptional 2.1% |