Asian vs Immigrants from Mexico Vision Disability
COMPARE
Asian
Immigrants from Mexico
Vision Disability
Vision Disability Comparison
Asians
Immigrants from Mexico
1.9%
VISION DISABILITY
100.0/ 100
METRIC RATING
20th/ 347
METRIC RANK
2.5%
VISION DISABILITY
0.0/ 100
METRIC RATING
296th/ 347
METRIC RANK
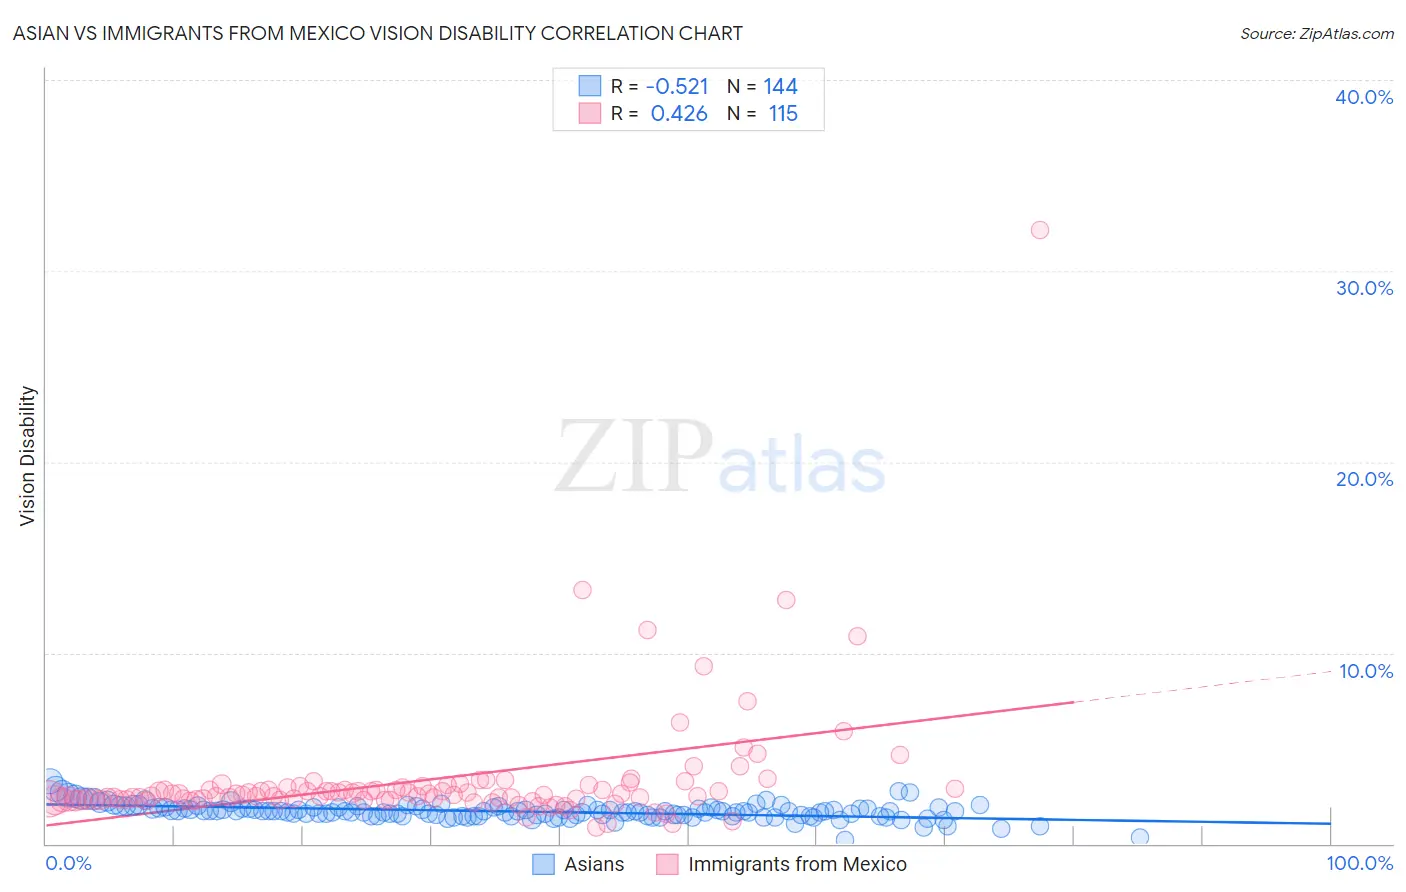
Asian vs Immigrants from Mexico Vision Disability Correlation Chart
The statistical analysis conducted on geographies consisting of 549,556,904 people shows a substantial negative correlation between the proportion of Asians and percentage of population with vision disability in the United States with a correlation coefficient (R) of -0.521 and weighted average of 1.9%. Similarly, the statistical analysis conducted on geographies consisting of 512,775,331 people shows a moderate positive correlation between the proportion of Immigrants from Mexico and percentage of population with vision disability in the United States with a correlation coefficient (R) of 0.426 and weighted average of 2.5%, a difference of 32.2%.
Vision Disability Correlation Summary
| Measurement | Asian | Immigrants from Mexico |
| Minimum | 0.21% | 0.88% |
| Maximum | 3.3% | 32.1% |
| Range | 3.1% | 31.3% |
| Mean | 1.7% | 3.3% |
| Median | 1.7% | 2.6% |
| Interquartile 25% (IQ1) | 1.5% | 2.3% |
| Interquartile 75% (IQ3) | 1.9% | 3.0% |
| Interquartile Range (IQR) | 0.42% | 0.66% |
| Standard Deviation (Sample) | 0.41% | 3.4% |
| Standard Deviation (Population) | 0.41% | 3.4% |
Similar Demographics by Vision Disability
Demographics Similar to Asians by Vision Disability
In terms of vision disability, the demographic groups most similar to Asians are Turkish (1.9%, a difference of 0.31%), Immigrants from Pakistan (1.9%, a difference of 0.35%), Immigrants from Asia (1.9%, a difference of 0.89%), Immigrants from Lithuania (1.9%, a difference of 1.0%), and Bulgarian (1.9%, a difference of 1.1%).
| Demographics | Rating | Rank | Vision Disability |
| Immigrants | Eastern Asia | 100.0 /100 | #13 | Exceptional 1.8% |
| Immigrants | China | 100.0 /100 | #14 | Exceptional 1.8% |
| Immigrants | Bolivia | 100.0 /100 | #15 | Exceptional 1.8% |
| Indians (Asian) | 100.0 /100 | #16 | Exceptional 1.8% |
| Burmese | 100.0 /100 | #17 | Exceptional 1.8% |
| Bolivians | 100.0 /100 | #18 | Exceptional 1.9% |
| Immigrants | Sri Lanka | 100.0 /100 | #19 | Exceptional 1.9% |
| Asians | 100.0 /100 | #20 | Exceptional 1.9% |
| Turks | 100.0 /100 | #21 | Exceptional 1.9% |
| Immigrants | Pakistan | 100.0 /100 | #22 | Exceptional 1.9% |
| Immigrants | Asia | 99.9 /100 | #23 | Exceptional 1.9% |
| Immigrants | Lithuania | 99.9 /100 | #24 | Exceptional 1.9% |
| Bulgarians | 99.9 /100 | #25 | Exceptional 1.9% |
| Immigrants | Japan | 99.9 /100 | #26 | Exceptional 1.9% |
| Taiwanese | 99.9 /100 | #27 | Exceptional 1.9% |
Demographics Similar to Immigrants from Mexico by Vision Disability
In terms of vision disability, the demographic groups most similar to Immigrants from Mexico are Delaware (2.5%, a difference of 0.11%), Ottawa (2.5%, a difference of 0.32%), Yaqui (2.5%, a difference of 0.66%), Crow (2.5%, a difference of 0.68%), and Immigrants from Dominica (2.5%, a difference of 0.68%).
| Demographics | Rating | Rank | Vision Disability |
| Immigrants | Nonimmigrants | 0.0 /100 | #289 | Tragic 2.5% |
| Immigrants | Cuba | 0.0 /100 | #290 | Tragic 2.5% |
| Immigrants | Honduras | 0.0 /100 | #291 | Tragic 2.5% |
| Crow | 0.0 /100 | #292 | Tragic 2.5% |
| Yaqui | 0.0 /100 | #293 | Tragic 2.5% |
| Ottawa | 0.0 /100 | #294 | Tragic 2.5% |
| Delaware | 0.0 /100 | #295 | Tragic 2.5% |
| Immigrants | Mexico | 0.0 /100 | #296 | Tragic 2.5% |
| Immigrants | Dominica | 0.0 /100 | #297 | Tragic 2.5% |
| Mexicans | 0.0 /100 | #298 | Tragic 2.5% |
| Cree | 0.0 /100 | #299 | Tragic 2.5% |
| Africans | 0.0 /100 | #300 | Tragic 2.5% |
| Menominee | 0.0 /100 | #301 | Tragic 2.5% |
| Spanish American Indians | 0.0 /100 | #302 | Tragic 2.6% |
| Immigrants | Cabo Verde | 0.0 /100 | #303 | Tragic 2.6% |