Paraguayan vs Soviet Union Vision Disability
COMPARE
Paraguayan
Soviet Union
Vision Disability
Vision Disability Comparison
Paraguayans
Soviet Union
2.0%
VISION DISABILITY
98.3/ 100
METRIC RATING
76th/ 347
METRIC RANK
2.0%
VISION DISABILITY
97.6/ 100
METRIC RATING
81st/ 347
METRIC RANK
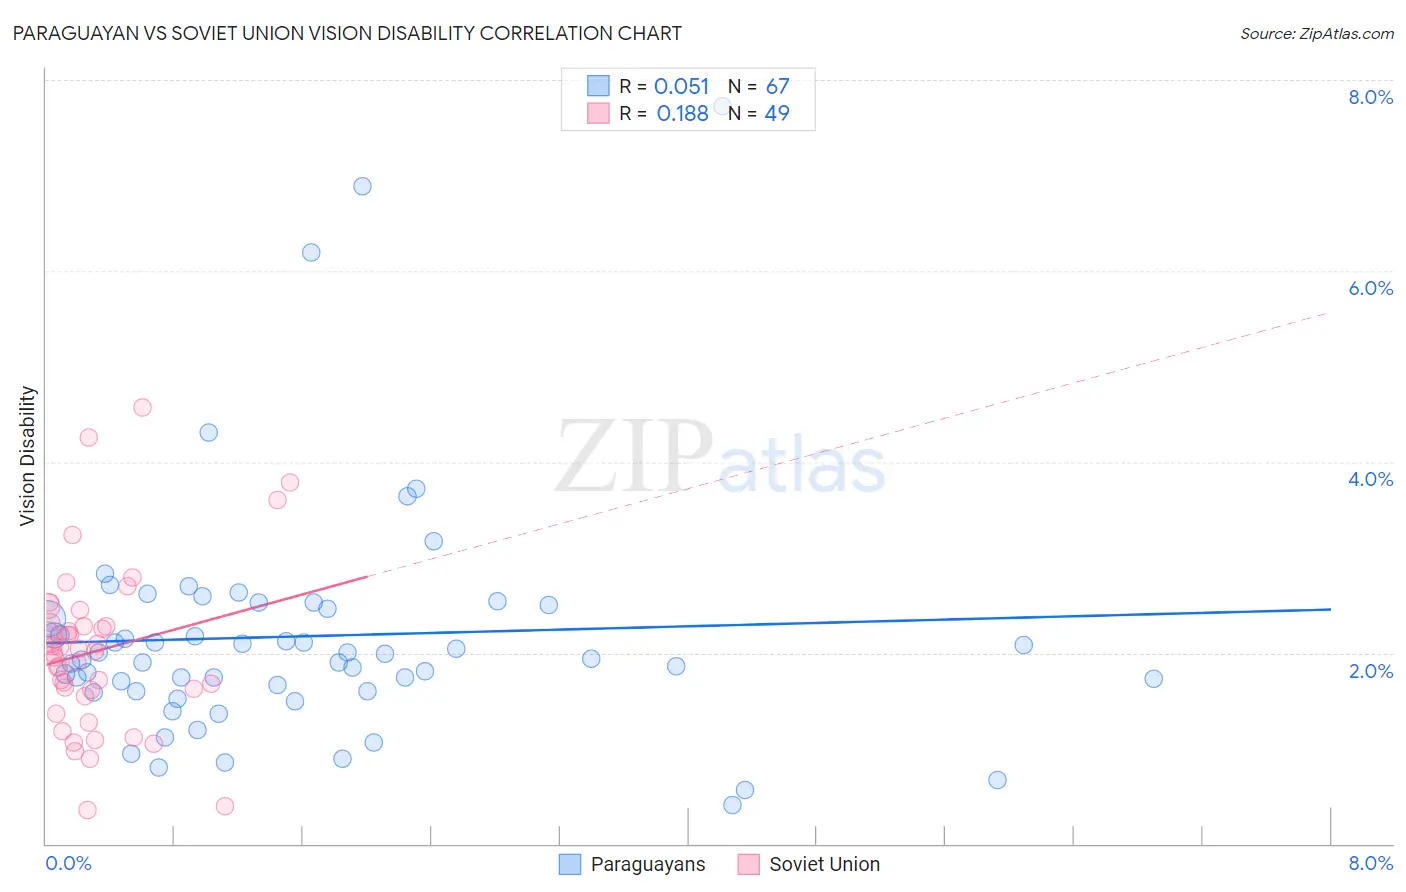
Paraguayan vs Soviet Union Vision Disability Correlation Chart
The statistical analysis conducted on geographies consisting of 95,099,644 people shows a slight positive correlation between the proportion of Paraguayans and percentage of population with vision disability in the United States with a correlation coefficient (R) of 0.051 and weighted average of 2.0%. Similarly, the statistical analysis conducted on geographies consisting of 43,504,651 people shows a poor positive correlation between the proportion of Soviet Union and percentage of population with vision disability in the United States with a correlation coefficient (R) of 0.188 and weighted average of 2.0%, a difference of 0.57%.
Vision Disability Correlation Summary
| Measurement | Paraguayan | Soviet Union |
| Minimum | 0.41% | 0.35% |
| Maximum | 7.7% | 4.6% |
| Range | 7.3% | 4.2% |
| Mean | 2.2% | 2.0% |
| Median | 1.9% | 2.0% |
| Interquartile 25% (IQ1) | 1.6% | 1.6% |
| Interquartile 75% (IQ3) | 2.5% | 2.3% |
| Interquartile Range (IQR) | 0.90% | 0.72% |
| Standard Deviation (Sample) | 1.3% | 0.86% |
| Standard Deviation (Population) | 1.3% | 0.85% |
Demographics Similar to Paraguayans and Soviet Union by Vision Disability
In terms of vision disability, the demographic groups most similar to Paraguayans are Immigrants from Jordan (2.0%, a difference of 0.0%), Palestinian (2.0%, a difference of 0.020%), Immigrants from North Macedonia (2.0%, a difference of 0.020%), Immigrants from Eastern Europe (2.0%, a difference of 0.030%), and Immigrants from Eritrea (2.0%, a difference of 0.070%). Similarly, the demographic groups most similar to Soviet Union are Immigrants from Poland (2.0%, a difference of 0.020%), Lithuanian (2.0%, a difference of 0.060%), Immigrants from Western Asia (2.0%, a difference of 0.11%), Immigrants from Latvia (2.0%, a difference of 0.22%), and Chinese (2.0%, a difference of 0.28%).
| Demographics | Rating | Rank | Vision Disability |
| Immigrants | Czechoslovakia | 98.7 /100 | #68 | Exceptional 2.0% |
| Russians | 98.6 /100 | #69 | Exceptional 2.0% |
| Immigrants | Kazakhstan | 98.6 /100 | #70 | Exceptional 2.0% |
| Immigrants | Northern Europe | 98.6 /100 | #71 | Exceptional 2.0% |
| Immigrants | France | 98.5 /100 | #72 | Exceptional 2.0% |
| Immigrants | Eritrea | 98.4 /100 | #73 | Exceptional 2.0% |
| Palestinians | 98.3 /100 | #74 | Exceptional 2.0% |
| Immigrants | North Macedonia | 98.3 /100 | #75 | Exceptional 2.0% |
| Paraguayans | 98.3 /100 | #76 | Exceptional 2.0% |
| Immigrants | Jordan | 98.3 /100 | #77 | Exceptional 2.0% |
| Immigrants | Eastern Europe | 98.3 /100 | #78 | Exceptional 2.0% |
| Assyrians/Chaldeans/Syriacs | 98.1 /100 | #79 | Exceptional 2.0% |
| Lithuanians | 97.7 /100 | #80 | Exceptional 2.0% |
| Soviet Union | 97.6 /100 | #81 | Exceptional 2.0% |
| Immigrants | Poland | 97.6 /100 | #82 | Exceptional 2.0% |
| Immigrants | Western Asia | 97.5 /100 | #83 | Exceptional 2.0% |
| Immigrants | Latvia | 97.3 /100 | #84 | Exceptional 2.0% |
| Chinese | 97.2 /100 | #85 | Exceptional 2.0% |
| Immigrants | Moldova | 97.2 /100 | #86 | Exceptional 2.0% |
| Immigrants | Switzerland | 97.0 /100 | #87 | Exceptional 2.0% |
| Norwegians | 97.0 /100 | #88 | Exceptional 2.0% |