Albanian vs Soviet Union Vision Disability
COMPARE
Albanian
Soviet Union
Vision Disability
Vision Disability Comparison
Albanians
Soviet Union
2.1%
VISION DISABILITY
94.9/ 100
METRIC RATING
101st/ 347
METRIC RANK
2.0%
VISION DISABILITY
97.6/ 100
METRIC RATING
81st/ 347
METRIC RANK
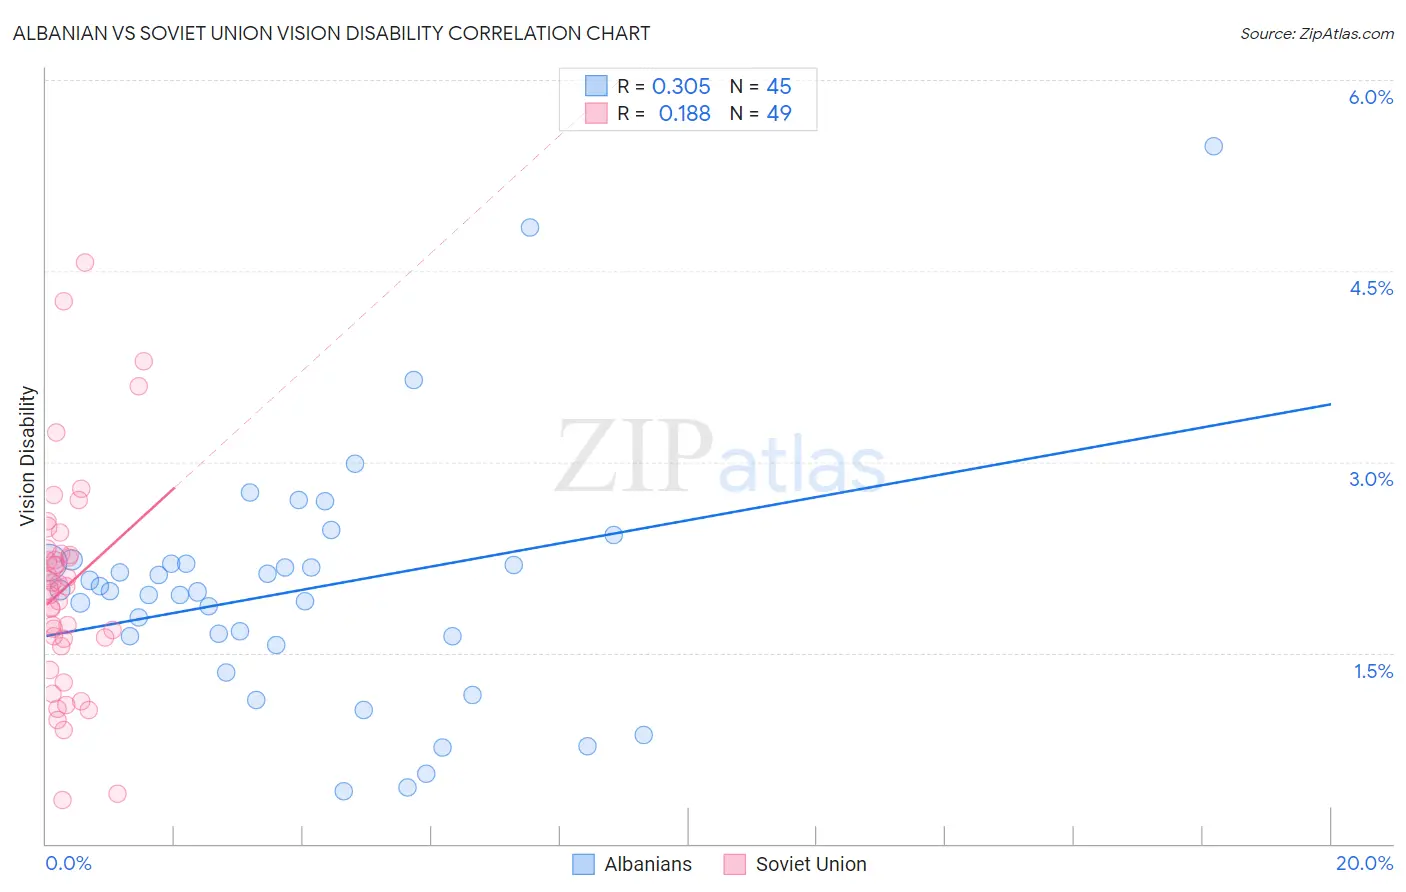
Albanian vs Soviet Union Vision Disability Correlation Chart
The statistical analysis conducted on geographies consisting of 193,200,917 people shows a mild positive correlation between the proportion of Albanians and percentage of population with vision disability in the United States with a correlation coefficient (R) of 0.305 and weighted average of 2.1%. Similarly, the statistical analysis conducted on geographies consisting of 43,504,651 people shows a poor positive correlation between the proportion of Soviet Union and percentage of population with vision disability in the United States with a correlation coefficient (R) of 0.188 and weighted average of 2.0%, a difference of 1.3%.
Vision Disability Correlation Summary
| Measurement | Albanian | Soviet Union |
| Minimum | 0.41% | 0.35% |
| Maximum | 5.5% | 4.6% |
| Range | 5.1% | 4.2% |
| Mean | 2.0% | 2.0% |
| Median | 2.0% | 2.0% |
| Interquartile 25% (IQ1) | 1.6% | 1.6% |
| Interquartile 75% (IQ3) | 2.2% | 2.3% |
| Interquartile Range (IQR) | 0.61% | 0.72% |
| Standard Deviation (Sample) | 0.97% | 0.86% |
| Standard Deviation (Population) | 0.96% | 0.85% |
Demographics Similar to Albanians and Soviet Union by Vision Disability
In terms of vision disability, the demographic groups most similar to Albanians are Greek (2.1%, a difference of 0.080%), Estonian (2.1%, a difference of 0.12%), Immigrants from South Africa (2.1%, a difference of 0.19%), Immigrants from Afghanistan (2.1%, a difference of 0.24%), and Romanian (2.1%, a difference of 0.31%). Similarly, the demographic groups most similar to Soviet Union are Immigrants from Poland (2.0%, a difference of 0.020%), Immigrants from Western Asia (2.0%, a difference of 0.11%), Immigrants from Latvia (2.0%, a difference of 0.22%), Chinese (2.0%, a difference of 0.28%), and Immigrants from Moldova (2.0%, a difference of 0.31%).
| Demographics | Rating | Rank | Vision Disability |
| Soviet Union | 97.6 /100 | #81 | Exceptional 2.0% |
| Immigrants | Poland | 97.6 /100 | #82 | Exceptional 2.0% |
| Immigrants | Western Asia | 97.5 /100 | #83 | Exceptional 2.0% |
| Immigrants | Latvia | 97.3 /100 | #84 | Exceptional 2.0% |
| Chinese | 97.2 /100 | #85 | Exceptional 2.0% |
| Immigrants | Moldova | 97.2 /100 | #86 | Exceptional 2.0% |
| Immigrants | Switzerland | 97.0 /100 | #87 | Exceptional 2.0% |
| Norwegians | 97.0 /100 | #88 | Exceptional 2.0% |
| Immigrants | Eastern Africa | 97.0 /100 | #89 | Exceptional 2.0% |
| Immigrants | Lebanon | 96.7 /100 | #90 | Exceptional 2.1% |
| Immigrants | Somalia | 96.2 /100 | #91 | Exceptional 2.1% |
| Immigrants | Syria | 96.2 /100 | #92 | Exceptional 2.1% |
| Immigrants | Europe | 96.1 /100 | #93 | Exceptional 2.1% |
| Immigrants | Croatia | 96.0 /100 | #94 | Exceptional 2.1% |
| Australians | 95.9 /100 | #95 | Exceptional 2.1% |
| Romanians | 95.7 /100 | #96 | Exceptional 2.1% |
| Immigrants | Afghanistan | 95.6 /100 | #97 | Exceptional 2.1% |
| Immigrants | South Africa | 95.4 /100 | #98 | Exceptional 2.1% |
| Estonians | 95.3 /100 | #99 | Exceptional 2.1% |
| Greeks | 95.1 /100 | #100 | Exceptional 2.1% |
| Albanians | 94.9 /100 | #101 | Exceptional 2.1% |