Asian vs Romanian Vision Disability
COMPARE
Asian
Romanian
Vision Disability
Vision Disability Comparison
Asians
Romanians
1.9%
VISION DISABILITY
100.0/ 100
METRIC RATING
20th/ 347
METRIC RANK
2.1%
VISION DISABILITY
95.7/ 100
METRIC RATING
96th/ 347
METRIC RANK
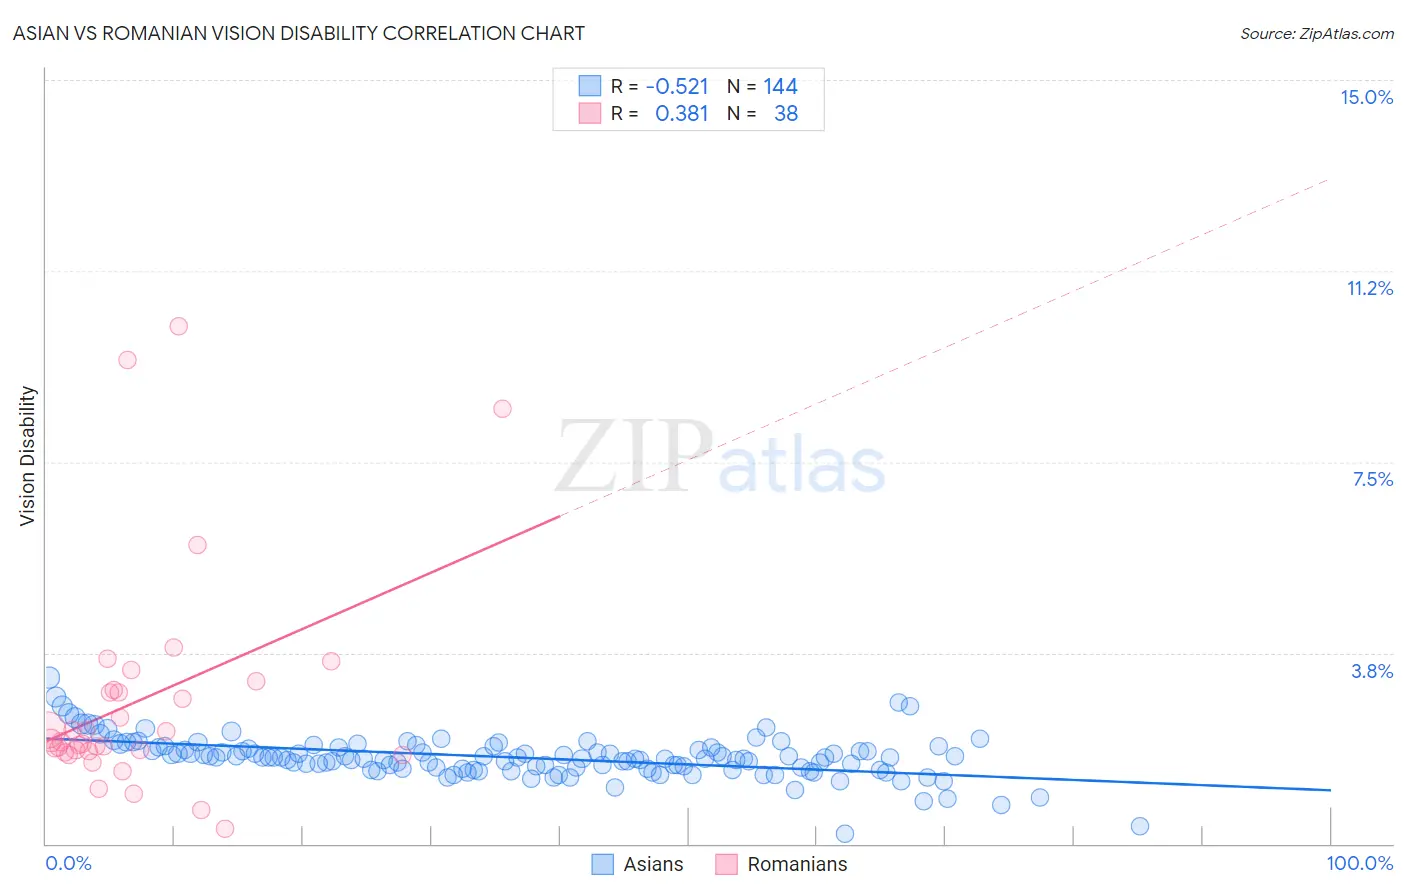
Asian vs Romanian Vision Disability Correlation Chart
The statistical analysis conducted on geographies consisting of 549,556,904 people shows a substantial negative correlation between the proportion of Asians and percentage of population with vision disability in the United States with a correlation coefficient (R) of -0.521 and weighted average of 1.9%. Similarly, the statistical analysis conducted on geographies consisting of 377,620,863 people shows a mild positive correlation between the proportion of Romanians and percentage of population with vision disability in the United States with a correlation coefficient (R) of 0.381 and weighted average of 2.1%, a difference of 8.4%.
Vision Disability Correlation Summary
| Measurement | Asian | Romanian |
| Minimum | 0.21% | 0.28% |
| Maximum | 3.3% | 10.2% |
| Range | 3.1% | 9.9% |
| Mean | 1.7% | 2.8% |
| Median | 1.7% | 2.0% |
| Interquartile 25% (IQ1) | 1.5% | 1.8% |
| Interquartile 75% (IQ3) | 1.9% | 3.0% |
| Interquartile Range (IQR) | 0.42% | 1.2% |
| Standard Deviation (Sample) | 0.41% | 2.2% |
| Standard Deviation (Population) | 0.41% | 2.2% |
Similar Demographics by Vision Disability
Demographics Similar to Asians by Vision Disability
In terms of vision disability, the demographic groups most similar to Asians are Turkish (1.9%, a difference of 0.31%), Immigrants from Pakistan (1.9%, a difference of 0.35%), Immigrants from Asia (1.9%, a difference of 0.89%), Immigrants from Lithuania (1.9%, a difference of 1.0%), and Bulgarian (1.9%, a difference of 1.1%).
| Demographics | Rating | Rank | Vision Disability |
| Immigrants | Eastern Asia | 100.0 /100 | #13 | Exceptional 1.8% |
| Immigrants | China | 100.0 /100 | #14 | Exceptional 1.8% |
| Immigrants | Bolivia | 100.0 /100 | #15 | Exceptional 1.8% |
| Indians (Asian) | 100.0 /100 | #16 | Exceptional 1.8% |
| Burmese | 100.0 /100 | #17 | Exceptional 1.8% |
| Bolivians | 100.0 /100 | #18 | Exceptional 1.9% |
| Immigrants | Sri Lanka | 100.0 /100 | #19 | Exceptional 1.9% |
| Asians | 100.0 /100 | #20 | Exceptional 1.9% |
| Turks | 100.0 /100 | #21 | Exceptional 1.9% |
| Immigrants | Pakistan | 100.0 /100 | #22 | Exceptional 1.9% |
| Immigrants | Asia | 99.9 /100 | #23 | Exceptional 1.9% |
| Immigrants | Lithuania | 99.9 /100 | #24 | Exceptional 1.9% |
| Bulgarians | 99.9 /100 | #25 | Exceptional 1.9% |
| Immigrants | Japan | 99.9 /100 | #26 | Exceptional 1.9% |
| Taiwanese | 99.9 /100 | #27 | Exceptional 1.9% |
Demographics Similar to Romanians by Vision Disability
In terms of vision disability, the demographic groups most similar to Romanians are Australian (2.1%, a difference of 0.060%), Immigrants from Afghanistan (2.1%, a difference of 0.070%), Immigrants from South Africa (2.1%, a difference of 0.11%), Immigrants from Croatia (2.1%, a difference of 0.13%), and Immigrants from Europe (2.1%, a difference of 0.15%).
| Demographics | Rating | Rank | Vision Disability |
| Immigrants | Eastern Africa | 97.0 /100 | #89 | Exceptional 2.0% |
| Immigrants | Lebanon | 96.7 /100 | #90 | Exceptional 2.1% |
| Immigrants | Somalia | 96.2 /100 | #91 | Exceptional 2.1% |
| Immigrants | Syria | 96.2 /100 | #92 | Exceptional 2.1% |
| Immigrants | Europe | 96.1 /100 | #93 | Exceptional 2.1% |
| Immigrants | Croatia | 96.0 /100 | #94 | Exceptional 2.1% |
| Australians | 95.9 /100 | #95 | Exceptional 2.1% |
| Romanians | 95.7 /100 | #96 | Exceptional 2.1% |
| Immigrants | Afghanistan | 95.6 /100 | #97 | Exceptional 2.1% |
| Immigrants | South Africa | 95.4 /100 | #98 | Exceptional 2.1% |
| Estonians | 95.3 /100 | #99 | Exceptional 2.1% |
| Greeks | 95.1 /100 | #100 | Exceptional 2.1% |
| Albanians | 94.9 /100 | #101 | Exceptional 2.1% |
| Sri Lankans | 94.8 /100 | #102 | Exceptional 2.1% |
| Immigrants | Austria | 94.4 /100 | #103 | Exceptional 2.1% |