Immigrants from Belgium vs Soviet Union Vision Disability
COMPARE
Immigrants from Belgium
Soviet Union
Vision Disability
Vision Disability Comparison
Immigrants from Belgium
Soviet Union
2.0%
VISION DISABILITY
99.1/ 100
METRIC RATING
61st/ 347
METRIC RANK
2.0%
VISION DISABILITY
97.6/ 100
METRIC RATING
81st/ 347
METRIC RANK
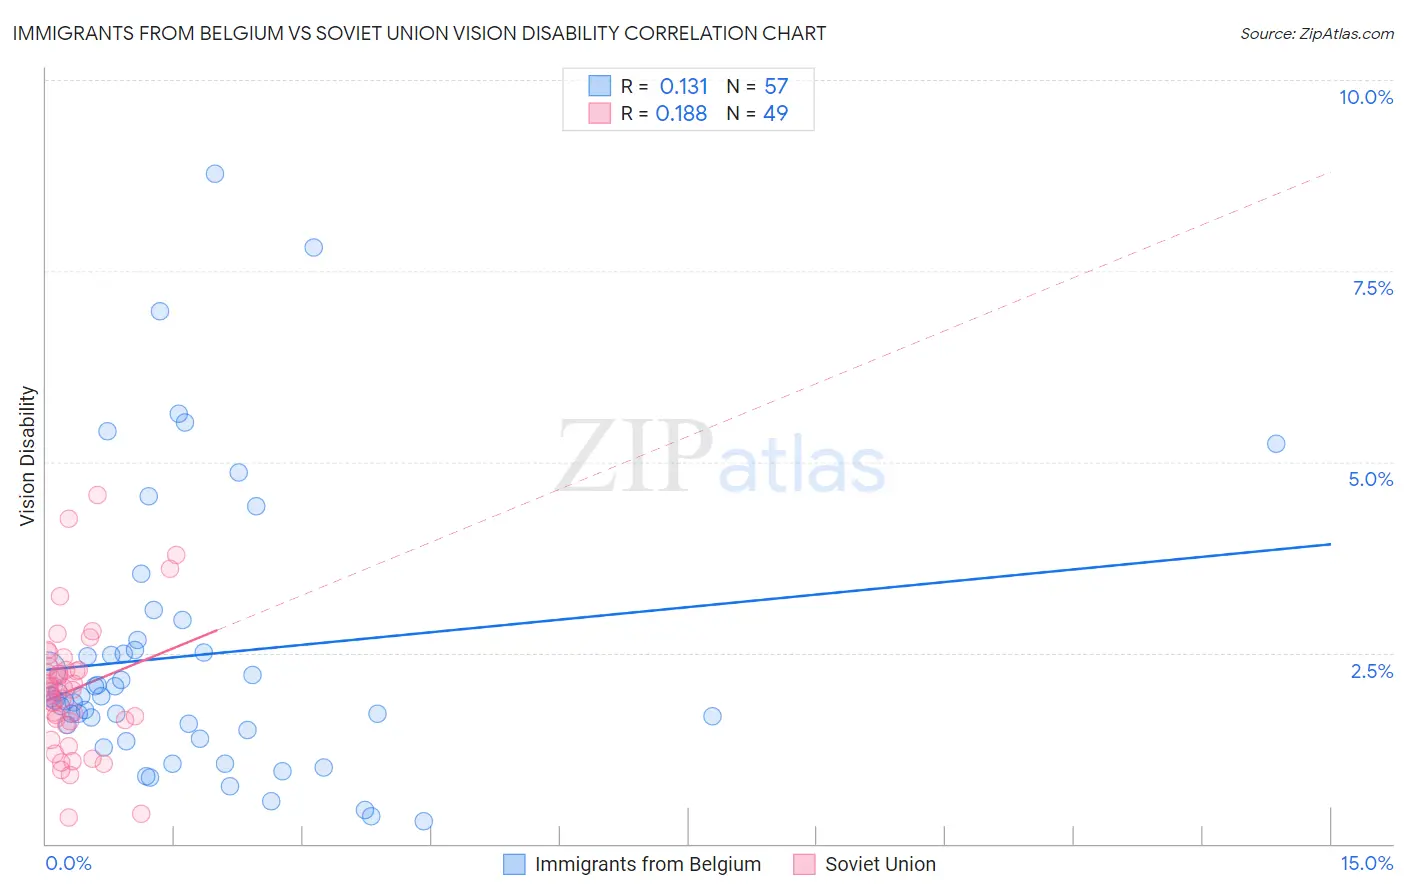
Immigrants from Belgium vs Soviet Union Vision Disability Correlation Chart
The statistical analysis conducted on geographies consisting of 146,674,933 people shows a poor positive correlation between the proportion of Immigrants from Belgium and percentage of population with vision disability in the United States with a correlation coefficient (R) of 0.131 and weighted average of 2.0%. Similarly, the statistical analysis conducted on geographies consisting of 43,504,651 people shows a poor positive correlation between the proportion of Soviet Union and percentage of population with vision disability in the United States with a correlation coefficient (R) of 0.188 and weighted average of 2.0%, a difference of 1.7%.
Vision Disability Correlation Summary
| Measurement | Immigrants from Belgium | Soviet Union |
| Minimum | 0.30% | 0.35% |
| Maximum | 8.8% | 4.6% |
| Range | 8.5% | 4.2% |
| Mean | 2.5% | 2.0% |
| Median | 1.9% | 2.0% |
| Interquartile 25% (IQ1) | 1.4% | 1.6% |
| Interquartile 75% (IQ3) | 2.6% | 2.3% |
| Interquartile Range (IQR) | 1.2% | 0.72% |
| Standard Deviation (Sample) | 1.8% | 0.86% |
| Standard Deviation (Population) | 1.8% | 0.85% |
Demographics Similar to Immigrants from Belgium and Soviet Union by Vision Disability
In terms of vision disability, the demographic groups most similar to Immigrants from Belgium are Immigrants from Russia (2.0%, a difference of 0.020%), Armenian (2.0%, a difference of 0.13%), Immigrants from Greece (2.0%, a difference of 0.26%), Maltese (2.0%, a difference of 0.33%), and Immigrants from Argentina (2.0%, a difference of 0.39%). Similarly, the demographic groups most similar to Soviet Union are Lithuanian (2.0%, a difference of 0.060%), Assyrian/Chaldean/Syriac (2.0%, a difference of 0.35%), Immigrants from Eastern Europe (2.0%, a difference of 0.53%), Immigrants from Jordan (2.0%, a difference of 0.56%), and Paraguayan (2.0%, a difference of 0.57%).
| Demographics | Rating | Rank | Vision Disability |
| Immigrants | Belgium | 99.1 /100 | #61 | Exceptional 2.0% |
| Immigrants | Russia | 99.1 /100 | #62 | Exceptional 2.0% |
| Armenians | 99.0 /100 | #63 | Exceptional 2.0% |
| Immigrants | Greece | 99.0 /100 | #64 | Exceptional 2.0% |
| Maltese | 98.9 /100 | #65 | Exceptional 2.0% |
| Immigrants | Argentina | 98.9 /100 | #66 | Exceptional 2.0% |
| Immigrants | Northern Africa | 98.8 /100 | #67 | Exceptional 2.0% |
| Immigrants | Czechoslovakia | 98.7 /100 | #68 | Exceptional 2.0% |
| Russians | 98.6 /100 | #69 | Exceptional 2.0% |
| Immigrants | Kazakhstan | 98.6 /100 | #70 | Exceptional 2.0% |
| Immigrants | Northern Europe | 98.6 /100 | #71 | Exceptional 2.0% |
| Immigrants | France | 98.5 /100 | #72 | Exceptional 2.0% |
| Immigrants | Eritrea | 98.4 /100 | #73 | Exceptional 2.0% |
| Palestinians | 98.3 /100 | #74 | Exceptional 2.0% |
| Immigrants | North Macedonia | 98.3 /100 | #75 | Exceptional 2.0% |
| Paraguayans | 98.3 /100 | #76 | Exceptional 2.0% |
| Immigrants | Jordan | 98.3 /100 | #77 | Exceptional 2.0% |
| Immigrants | Eastern Europe | 98.3 /100 | #78 | Exceptional 2.0% |
| Assyrians/Chaldeans/Syriacs | 98.1 /100 | #79 | Exceptional 2.0% |
| Lithuanians | 97.7 /100 | #80 | Exceptional 2.0% |
| Soviet Union | 97.6 /100 | #81 | Exceptional 2.0% |