Armenian vs Sierra Leonean Male Disability
COMPARE
Armenian
Sierra Leonean
Male Disability
Male Disability Comparison
Armenians
Sierra Leoneans
10.9%
MALE DISABILITY
90.1/ 100
METRIC RATING
119th/ 347
METRIC RANK
10.5%
MALE DISABILITY
98.7/ 100
METRIC RATING
75th/ 347
METRIC RANK
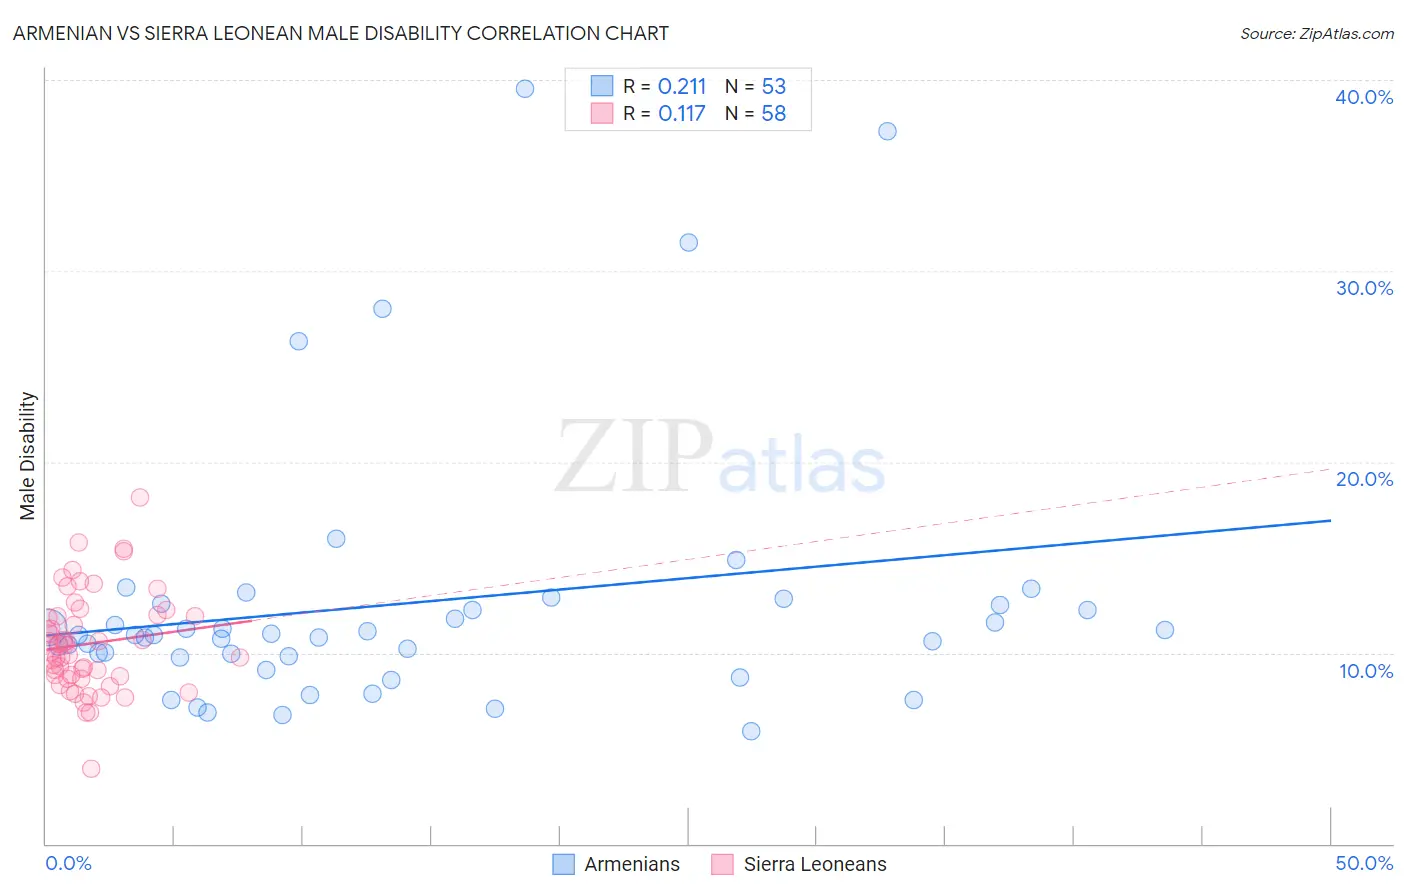
Armenian vs Sierra Leonean Male Disability Correlation Chart
The statistical analysis conducted on geographies consisting of 310,935,908 people shows a weak positive correlation between the proportion of Armenians and percentage of males with a disability in the United States with a correlation coefficient (R) of 0.211 and weighted average of 10.9%. Similarly, the statistical analysis conducted on geographies consisting of 83,361,010 people shows a poor positive correlation between the proportion of Sierra Leoneans and percentage of males with a disability in the United States with a correlation coefficient (R) of 0.117 and weighted average of 10.5%, a difference of 3.1%.
Male Disability Correlation Summary
| Measurement | Armenian | Sierra Leonean |
| Minimum | 5.9% | 3.9% |
| Maximum | 39.5% | 18.1% |
| Range | 33.7% | 14.2% |
| Mean | 12.6% | 10.5% |
| Median | 10.9% | 10.2% |
| Interquartile 25% (IQ1) | 9.8% | 8.8% |
| Interquartile 75% (IQ3) | 12.5% | 11.9% |
| Interquartile Range (IQR) | 2.8% | 3.2% |
| Standard Deviation (Sample) | 7.0% | 2.6% |
| Standard Deviation (Population) | 6.9% | 2.6% |
Similar Demographics by Male Disability
Demographics Similar to Armenians by Male Disability
In terms of male disability, the demographic groups most similar to Armenians are Immigrants from Cuba (10.9%, a difference of 0.0%), Eastern European (10.9%, a difference of 0.080%), Immigrants from Africa (10.9%, a difference of 0.11%), Immigrants from South Eastern Asia (10.9%, a difference of 0.15%), and Immigrants from Ghana (10.9%, a difference of 0.17%).
| Demographics | Rating | Rank | Male Disability |
| Ghanaians | 93.4 /100 | #112 | Exceptional 10.8% |
| Immigrants | Zimbabwe | 93.0 /100 | #113 | Exceptional 10.8% |
| Central Americans | 92.7 /100 | #114 | Exceptional 10.8% |
| Immigrants | Barbados | 92.2 /100 | #115 | Exceptional 10.8% |
| Immigrants | South Africa | 91.8 /100 | #116 | Exceptional 10.8% |
| Eastern Europeans | 90.6 /100 | #117 | Exceptional 10.9% |
| Immigrants | Cuba | 90.2 /100 | #118 | Exceptional 10.9% |
| Armenians | 90.1 /100 | #119 | Exceptional 10.9% |
| Immigrants | Africa | 89.4 /100 | #120 | Excellent 10.9% |
| Immigrants | South Eastern Asia | 89.2 /100 | #121 | Excellent 10.9% |
| Immigrants | Ghana | 89.0 /100 | #122 | Excellent 10.9% |
| Immigrants | Czechoslovakia | 88.4 /100 | #123 | Excellent 10.9% |
| South American Indians | 88.1 /100 | #124 | Excellent 10.9% |
| Immigrants | North Macedonia | 88.1 /100 | #125 | Excellent 10.9% |
| Immigrants | Trinidad and Tobago | 86.9 /100 | #126 | Excellent 10.9% |
Demographics Similar to Sierra Leoneans by Male Disability
In terms of male disability, the demographic groups most similar to Sierra Leoneans are Immigrants from Sierra Leone (10.5%, a difference of 0.040%), Laotian (10.6%, a difference of 0.10%), Immigrants from Lebanon (10.5%, a difference of 0.12%), Immigrants from Russia (10.6%, a difference of 0.12%), and Immigrants from Lithuania (10.5%, a difference of 0.26%).
| Demographics | Rating | Rank | Male Disability |
| Colombians | 99.2 /100 | #68 | Exceptional 10.5% |
| Ecuadorians | 99.2 /100 | #69 | Exceptional 10.5% |
| Immigrants | Bulgaria | 99.1 /100 | #70 | Exceptional 10.5% |
| Immigrants | Cameroon | 99.0 /100 | #71 | Exceptional 10.5% |
| Immigrants | Serbia | 99.0 /100 | #72 | Exceptional 10.5% |
| Immigrants | Lithuania | 98.9 /100 | #73 | Exceptional 10.5% |
| Immigrants | Lebanon | 98.8 /100 | #74 | Exceptional 10.5% |
| Sierra Leoneans | 98.7 /100 | #75 | Exceptional 10.5% |
| Immigrants | Sierra Leone | 98.7 /100 | #76 | Exceptional 10.5% |
| Laotians | 98.6 /100 | #77 | Exceptional 10.6% |
| Immigrants | Russia | 98.6 /100 | #78 | Exceptional 10.6% |
| Zimbabweans | 98.4 /100 | #79 | Exceptional 10.6% |
| Immigrants | Jordan | 98.4 /100 | #80 | Exceptional 10.6% |
| Immigrants | Chile | 98.3 /100 | #81 | Exceptional 10.6% |
| Immigrants | Guyana | 98.2 /100 | #82 | Exceptional 10.6% |