Argentinean vs Immigrants from the Azores 10th Grade
COMPARE
Argentinean
Immigrants from the Azores
10th Grade
10th Grade Comparison
Argentineans
Immigrants from the Azores
93.7%
10TH GRADE
50.0/ 100
METRIC RATING
174th/ 347
METRIC RANK
89.0%
10TH GRADE
0.0/ 100
METRIC RATING
332nd/ 347
METRIC RANK
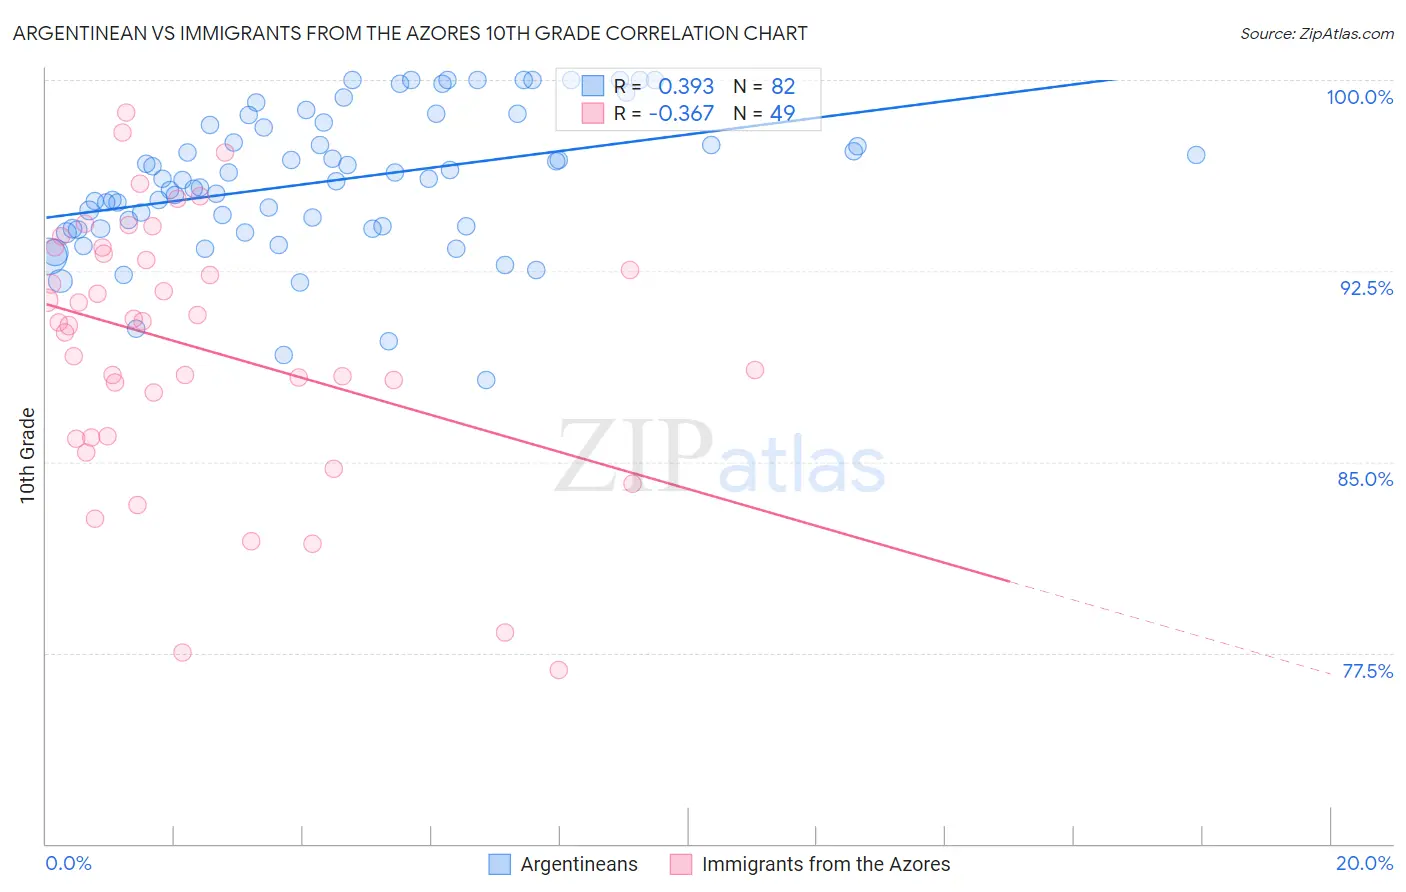
Argentinean vs Immigrants from the Azores 10th Grade Correlation Chart
The statistical analysis conducted on geographies consisting of 297,145,104 people shows a mild positive correlation between the proportion of Argentineans and percentage of population with at least 10th grade education in the United States with a correlation coefficient (R) of 0.393 and weighted average of 93.7%. Similarly, the statistical analysis conducted on geographies consisting of 46,257,310 people shows a mild negative correlation between the proportion of Immigrants from the Azores and percentage of population with at least 10th grade education in the United States with a correlation coefficient (R) of -0.367 and weighted average of 89.0%, a difference of 5.3%.
10th Grade Correlation Summary
| Measurement | Argentinean | Immigrants from the Azores |
| Minimum | 88.2% | 76.8% |
| Maximum | 100.0% | 98.7% |
| Range | 11.8% | 21.9% |
| Mean | 96.0% | 89.5% |
| Median | 96.1% | 90.5% |
| Interquartile 25% (IQ1) | 94.2% | 86.0% |
| Interquartile 75% (IQ3) | 98.3% | 93.3% |
| Interquartile Range (IQR) | 4.1% | 7.3% |
| Standard Deviation (Sample) | 2.8% | 5.1% |
| Standard Deviation (Population) | 2.7% | 5.1% |
Similar Demographics by 10th Grade
Demographics Similar to Argentineans by 10th Grade
In terms of 10th grade, the demographic groups most similar to Argentineans are Spaniard (93.7%, a difference of 0.0%), Immigrants from Nepal (93.7%, a difference of 0.0%), French American Indian (93.7%, a difference of 0.010%), Immigrants from Albania (93.8%, a difference of 0.020%), and Immigrants from Venezuela (93.8%, a difference of 0.030%).
| Demographics | Rating | Rank | 10th Grade |
| Immigrants | Egypt | 62.3 /100 | #167 | Good 93.8% |
| Alsatians | 59.4 /100 | #168 | Average 93.8% |
| Immigrants | Spain | 55.9 /100 | #169 | Average 93.8% |
| Immigrants | Venezuela | 53.9 /100 | #170 | Average 93.8% |
| Immigrants | Albania | 52.4 /100 | #171 | Average 93.8% |
| French American Indians | 50.9 /100 | #172 | Average 93.7% |
| Spaniards | 50.3 /100 | #173 | Average 93.7% |
| Argentineans | 50.0 /100 | #174 | Average 93.7% |
| Immigrants | Nepal | 49.6 /100 | #175 | Average 93.7% |
| Immigrants | Argentina | 47.1 /100 | #176 | Average 93.7% |
| Immigrants | Lebanon | 47.1 /100 | #177 | Average 93.7% |
| Sierra Leoneans | 46.1 /100 | #178 | Average 93.7% |
| Paraguayans | 45.3 /100 | #179 | Average 93.7% |
| Blackfeet | 42.8 /100 | #180 | Average 93.7% |
| Immigrants | Northern Africa | 41.6 /100 | #181 | Average 93.7% |
Demographics Similar to Immigrants from the Azores by 10th Grade
In terms of 10th grade, the demographic groups most similar to Immigrants from the Azores are Honduran (89.0%, a difference of 0.030%), Mexican American Indian (89.0%, a difference of 0.040%), Immigrants from Yemen (89.1%, a difference of 0.070%), Hispanic or Latino (88.9%, a difference of 0.15%), and Immigrants from Dominican Republic (88.7%, a difference of 0.33%).
| Demographics | Rating | Rank | 10th Grade |
| Puerto Ricans | 0.0 /100 | #325 | Tragic 89.8% |
| Central American Indians | 0.0 /100 | #326 | Tragic 89.7% |
| Immigrants | Nicaragua | 0.0 /100 | #327 | Tragic 89.5% |
| Immigrants | Cabo Verde | 0.0 /100 | #328 | Tragic 89.5% |
| Dominicans | 0.0 /100 | #329 | Tragic 89.4% |
| Immigrants | Yemen | 0.0 /100 | #330 | Tragic 89.1% |
| Mexican American Indians | 0.0 /100 | #331 | Tragic 89.0% |
| Immigrants | Azores | 0.0 /100 | #332 | Tragic 89.0% |
| Hondurans | 0.0 /100 | #333 | Tragic 89.0% |
| Hispanics or Latinos | 0.0 /100 | #334 | Tragic 88.9% |
| Immigrants | Dominican Republic | 0.0 /100 | #335 | Tragic 88.7% |
| Immigrants | Honduras | 0.0 /100 | #336 | Tragic 88.5% |
| Central Americans | 0.0 /100 | #337 | Tragic 88.4% |
| Immigrants | Latin America | 0.0 /100 | #338 | Tragic 88.3% |
| Guatemalans | 0.0 /100 | #339 | Tragic 87.9% |