Argentinean vs Ugandan Vision Disability
COMPARE
Argentinean
Ugandan
Vision Disability
Vision Disability Comparison
Argentineans
Ugandans
2.0%
VISION DISABILITY
99.1/ 100
METRIC RATING
59th/ 347
METRIC RANK
2.1%
VISION DISABILITY
92.2/ 100
METRIC RATING
116th/ 347
METRIC RANK
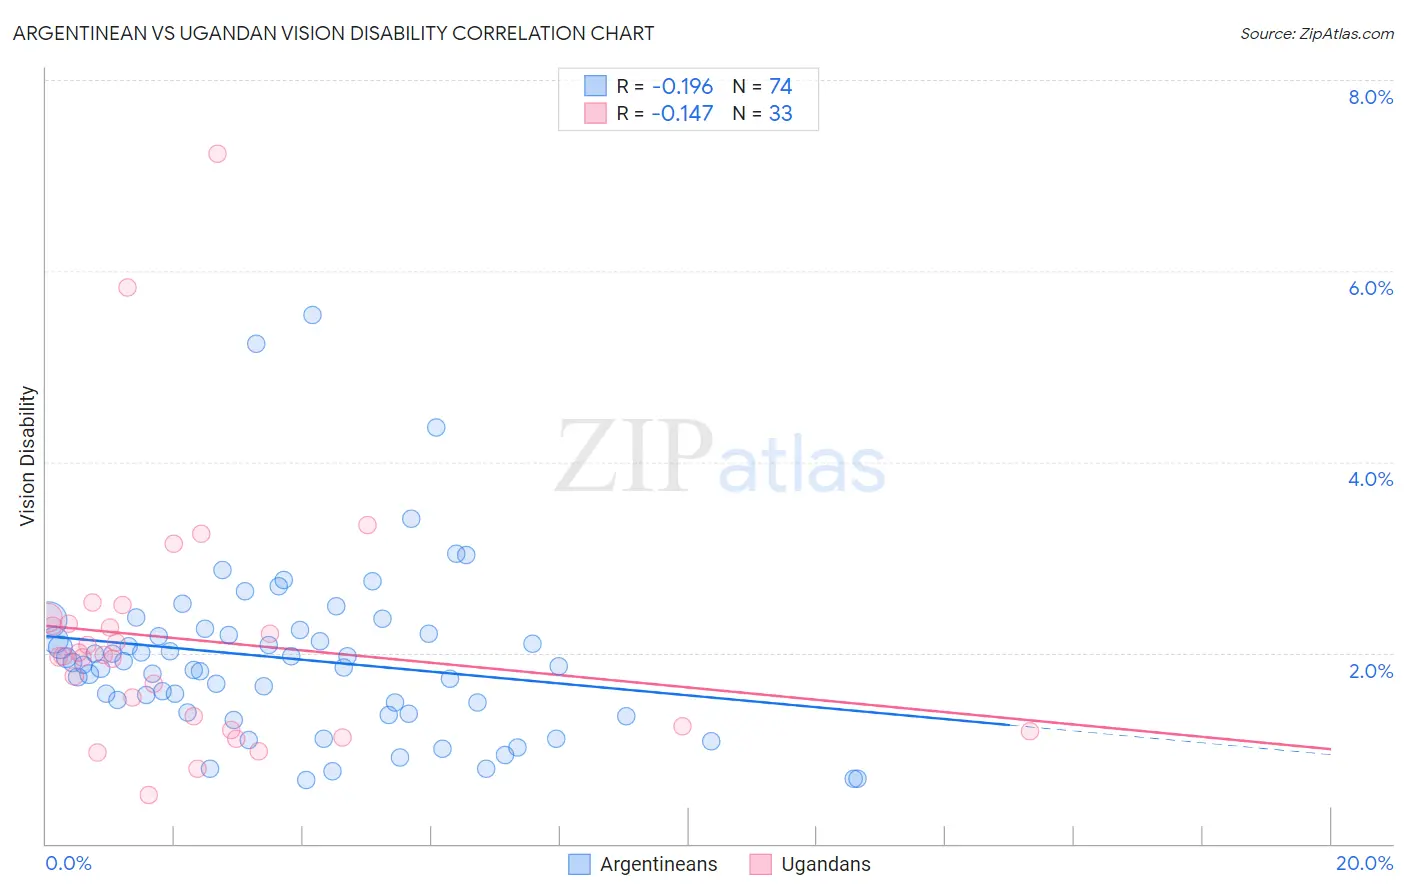
Argentinean vs Ugandan Vision Disability Correlation Chart
The statistical analysis conducted on geographies consisting of 297,071,793 people shows a poor negative correlation between the proportion of Argentineans and percentage of population with vision disability in the United States with a correlation coefficient (R) of -0.196 and weighted average of 2.0%. Similarly, the statistical analysis conducted on geographies consisting of 94,002,961 people shows a poor negative correlation between the proportion of Ugandans and percentage of population with vision disability in the United States with a correlation coefficient (R) of -0.147 and weighted average of 2.1%, a difference of 3.9%.
Vision Disability Correlation Summary
| Measurement | Argentinean | Ugandan |
| Minimum | 0.66% | 0.51% |
| Maximum | 5.5% | 7.2% |
| Range | 4.9% | 6.7% |
| Mean | 1.9% | 2.1% |
| Median | 1.9% | 2.0% |
| Interquartile 25% (IQ1) | 1.4% | 1.2% |
| Interquartile 75% (IQ3) | 2.2% | 2.3% |
| Interquartile Range (IQR) | 0.82% | 1.1% |
| Standard Deviation (Sample) | 0.89% | 1.3% |
| Standard Deviation (Population) | 0.89% | 1.3% |
Similar Demographics by Vision Disability
Demographics Similar to Argentineans by Vision Disability
In terms of vision disability, the demographic groups most similar to Argentineans are Immigrants from Romania (2.0%, a difference of 0.030%), Immigrants from Belgium (2.0%, a difference of 0.040%), Immigrants from Russia (2.0%, a difference of 0.060%), Immigrants from Saudi Arabia (2.0%, a difference of 0.14%), and Armenian (2.0%, a difference of 0.17%).
| Demographics | Rating | Rank | Vision Disability |
| Immigrants | Serbia | 99.4 /100 | #52 | Exceptional 2.0% |
| Immigrants | Belarus | 99.3 /100 | #53 | Exceptional 2.0% |
| Macedonians | 99.3 /100 | #54 | Exceptional 2.0% |
| Laotians | 99.3 /100 | #55 | Exceptional 2.0% |
| Jordanians | 99.2 /100 | #56 | Exceptional 2.0% |
| Somalis | 99.2 /100 | #57 | Exceptional 2.0% |
| Immigrants | Saudi Arabia | 99.2 /100 | #58 | Exceptional 2.0% |
| Argentineans | 99.1 /100 | #59 | Exceptional 2.0% |
| Immigrants | Romania | 99.1 /100 | #60 | Exceptional 2.0% |
| Immigrants | Belgium | 99.1 /100 | #61 | Exceptional 2.0% |
| Immigrants | Russia | 99.1 /100 | #62 | Exceptional 2.0% |
| Armenians | 99.0 /100 | #63 | Exceptional 2.0% |
| Immigrants | Greece | 99.0 /100 | #64 | Exceptional 2.0% |
| Maltese | 98.9 /100 | #65 | Exceptional 2.0% |
| Immigrants | Argentina | 98.9 /100 | #66 | Exceptional 2.0% |
Demographics Similar to Ugandans by Vision Disability
In terms of vision disability, the demographic groups most similar to Ugandans are Immigrants from Vietnam (2.1%, a difference of 0.0%), Croatian (2.1%, a difference of 0.030%), Polish (2.1%, a difference of 0.040%), Kenyan (2.1%, a difference of 0.060%), and Immigrants from Denmark (2.1%, a difference of 0.18%).
| Demographics | Rating | Rank | Vision Disability |
| Chileans | 94.0 /100 | #109 | Exceptional 2.1% |
| Immigrants | Armenia | 93.8 /100 | #110 | Exceptional 2.1% |
| Peruvians | 93.5 /100 | #111 | Exceptional 2.1% |
| Immigrants | Denmark | 92.9 /100 | #112 | Exceptional 2.1% |
| Kenyans | 92.5 /100 | #113 | Exceptional 2.1% |
| Croatians | 92.3 /100 | #114 | Exceptional 2.1% |
| Immigrants | Vietnam | 92.2 /100 | #115 | Exceptional 2.1% |
| Ugandans | 92.2 /100 | #116 | Exceptional 2.1% |
| Poles | 92.0 /100 | #117 | Exceptional 2.1% |
| Immigrants | Philippines | 91.4 /100 | #118 | Exceptional 2.1% |
| Immigrants | Uganda | 91.4 /100 | #119 | Exceptional 2.1% |
| Immigrants | Zimbabwe | 91.0 /100 | #120 | Exceptional 2.1% |
| Immigrants | Scotland | 90.4 /100 | #121 | Exceptional 2.1% |
| Immigrants | Ukraine | 90.4 /100 | #122 | Exceptional 2.1% |
| Immigrants | Albania | 90.4 /100 | #123 | Exceptional 2.1% |