Argentinean vs Navajo Vision Disability
COMPARE
Argentinean
Navajo
Vision Disability
Vision Disability Comparison
Argentineans
Navajo
2.0%
VISION DISABILITY
99.1/ 100
METRIC RATING
59th/ 347
METRIC RANK
3.1%
VISION DISABILITY
0.0/ 100
METRIC RATING
335th/ 347
METRIC RANK
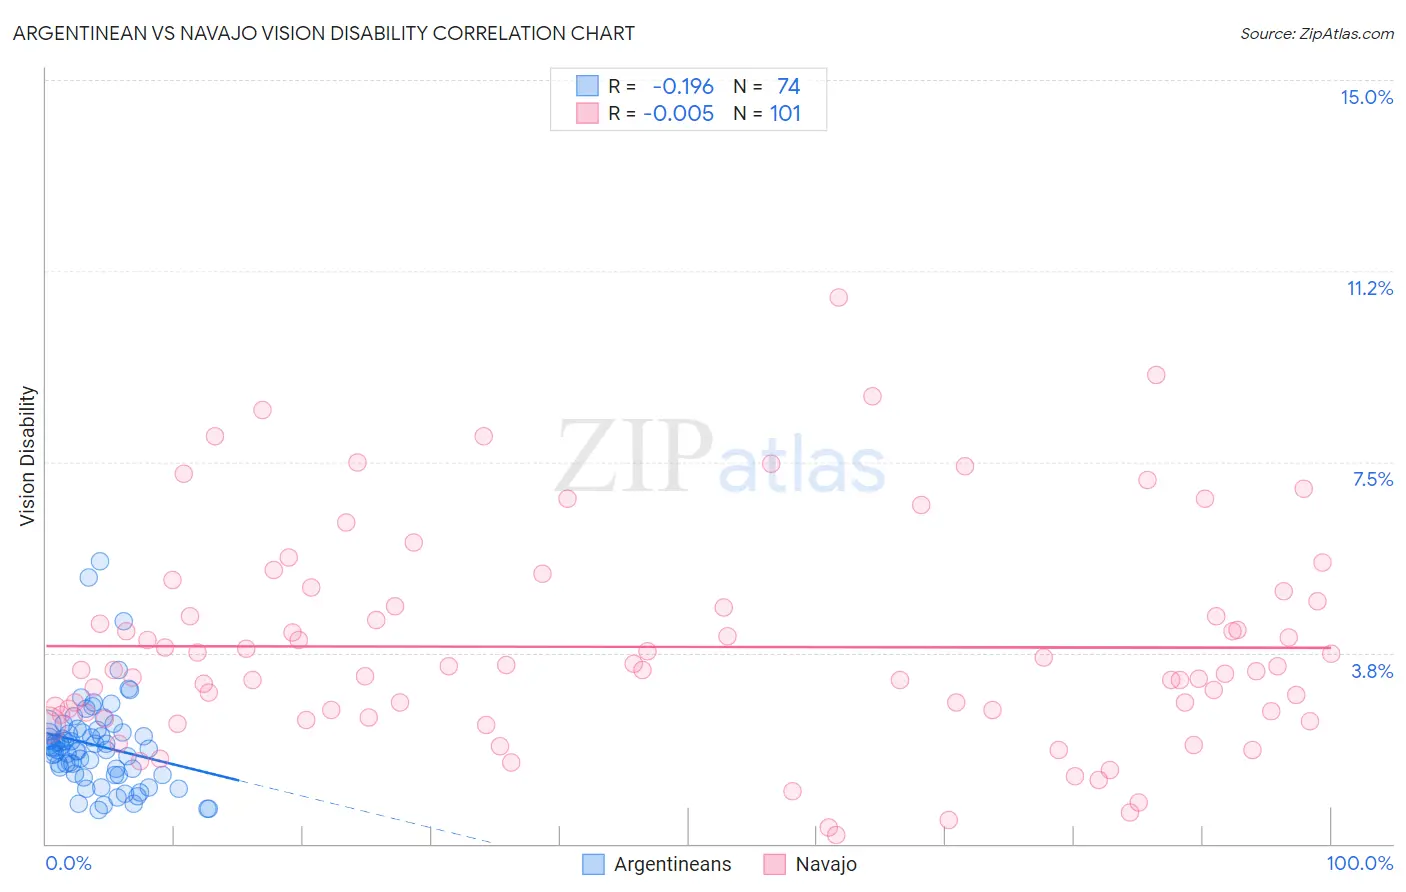
Argentinean vs Navajo Vision Disability Correlation Chart
The statistical analysis conducted on geographies consisting of 297,071,793 people shows a poor negative correlation between the proportion of Argentineans and percentage of population with vision disability in the United States with a correlation coefficient (R) of -0.196 and weighted average of 2.0%. Similarly, the statistical analysis conducted on geographies consisting of 224,647,940 people shows no correlation between the proportion of Navajo and percentage of population with vision disability in the United States with a correlation coefficient (R) of -0.005 and weighted average of 3.1%, a difference of 56.9%.
Vision Disability Correlation Summary
| Measurement | Argentinean | Navajo |
| Minimum | 0.66% | 0.16% |
| Maximum | 5.5% | 10.7% |
| Range | 4.9% | 10.6% |
| Mean | 1.9% | 3.9% |
| Median | 1.9% | 3.4% |
| Interquartile 25% (IQ1) | 1.4% | 2.6% |
| Interquartile 75% (IQ3) | 2.2% | 4.7% |
| Interquartile Range (IQR) | 0.82% | 2.2% |
| Standard Deviation (Sample) | 0.89% | 2.1% |
| Standard Deviation (Population) | 0.89% | 2.1% |
Similar Demographics by Vision Disability
Demographics Similar to Argentineans by Vision Disability
In terms of vision disability, the demographic groups most similar to Argentineans are Immigrants from Romania (2.0%, a difference of 0.030%), Immigrants from Belgium (2.0%, a difference of 0.040%), Immigrants from Russia (2.0%, a difference of 0.060%), Immigrants from Saudi Arabia (2.0%, a difference of 0.14%), and Armenian (2.0%, a difference of 0.17%).
| Demographics | Rating | Rank | Vision Disability |
| Immigrants | Serbia | 99.4 /100 | #52 | Exceptional 2.0% |
| Immigrants | Belarus | 99.3 /100 | #53 | Exceptional 2.0% |
| Macedonians | 99.3 /100 | #54 | Exceptional 2.0% |
| Laotians | 99.3 /100 | #55 | Exceptional 2.0% |
| Jordanians | 99.2 /100 | #56 | Exceptional 2.0% |
| Somalis | 99.2 /100 | #57 | Exceptional 2.0% |
| Immigrants | Saudi Arabia | 99.2 /100 | #58 | Exceptional 2.0% |
| Argentineans | 99.1 /100 | #59 | Exceptional 2.0% |
| Immigrants | Romania | 99.1 /100 | #60 | Exceptional 2.0% |
| Immigrants | Belgium | 99.1 /100 | #61 | Exceptional 2.0% |
| Immigrants | Russia | 99.1 /100 | #62 | Exceptional 2.0% |
| Armenians | 99.0 /100 | #63 | Exceptional 2.0% |
| Immigrants | Greece | 99.0 /100 | #64 | Exceptional 2.0% |
| Maltese | 98.9 /100 | #65 | Exceptional 2.0% |
| Immigrants | Argentina | 98.9 /100 | #66 | Exceptional 2.0% |
Demographics Similar to Navajo by Vision Disability
In terms of vision disability, the demographic groups most similar to Navajo are Alaskan Athabascan (3.1%, a difference of 0.16%), Dutch West Indian (3.2%, a difference of 0.19%), Chickasaw (3.2%, a difference of 1.1%), Cheyenne (3.1%, a difference of 1.7%), and Tsimshian (3.2%, a difference of 1.8%).
| Demographics | Rating | Rank | Vision Disability |
| Yuman | 0.0 /100 | #328 | Tragic 3.0% |
| Apache | 0.0 /100 | #329 | Tragic 3.0% |
| Colville | 0.0 /100 | #330 | Tragic 3.0% |
| Central American Indians | 0.0 /100 | #331 | Tragic 3.0% |
| Seminole | 0.0 /100 | #332 | Tragic 3.1% |
| Cajuns | 0.0 /100 | #333 | Tragic 3.1% |
| Cheyenne | 0.0 /100 | #334 | Tragic 3.1% |
| Navajo | 0.0 /100 | #335 | Tragic 3.1% |
| Alaskan Athabascans | 0.0 /100 | #336 | Tragic 3.1% |
| Dutch West Indians | 0.0 /100 | #337 | Tragic 3.2% |
| Chickasaw | 0.0 /100 | #338 | Tragic 3.2% |
| Tsimshian | 0.0 /100 | #339 | Tragic 3.2% |
| Creek | 0.0 /100 | #340 | Tragic 3.2% |
| Kiowa | 0.0 /100 | #341 | Tragic 3.3% |
| Choctaw | 0.0 /100 | #342 | Tragic 3.3% |