Argentinean vs Barbadian Vision Disability
COMPARE
Argentinean
Barbadian
Vision Disability
Vision Disability Comparison
Argentineans
Barbadians
2.0%
VISION DISABILITY
99.1/ 100
METRIC RATING
59th/ 347
METRIC RANK
2.3%
VISION DISABILITY
5.1/ 100
METRIC RATING
217th/ 347
METRIC RANK
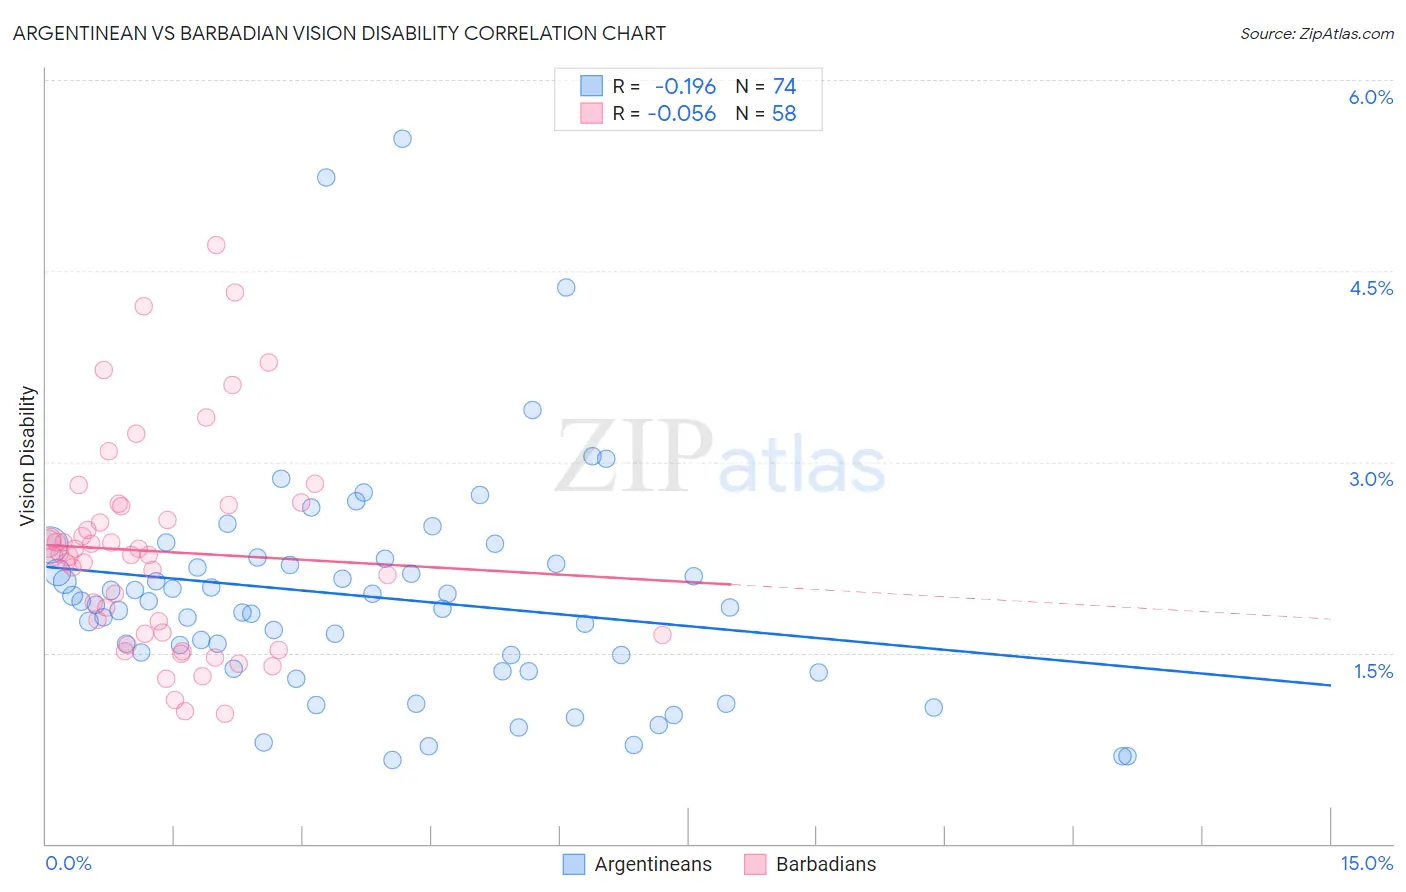
Argentinean vs Barbadian Vision Disability Correlation Chart
The statistical analysis conducted on geographies consisting of 297,071,793 people shows a poor negative correlation between the proportion of Argentineans and percentage of population with vision disability in the United States with a correlation coefficient (R) of -0.196 and weighted average of 2.0%. Similarly, the statistical analysis conducted on geographies consisting of 141,266,636 people shows a slight negative correlation between the proportion of Barbadians and percentage of population with vision disability in the United States with a correlation coefficient (R) of -0.056 and weighted average of 2.3%, a difference of 13.0%.
Vision Disability Correlation Summary
| Measurement | Argentinean | Barbadian |
| Minimum | 0.66% | 1.0% |
| Maximum | 5.5% | 4.7% |
| Range | 4.9% | 3.7% |
| Mean | 1.9% | 2.3% |
| Median | 1.9% | 2.3% |
| Interquartile 25% (IQ1) | 1.4% | 1.6% |
| Interquartile 75% (IQ3) | 2.2% | 2.6% |
| Interquartile Range (IQR) | 0.82% | 1.0% |
| Standard Deviation (Sample) | 0.89% | 0.81% |
| Standard Deviation (Population) | 0.89% | 0.81% |
Similar Demographics by Vision Disability
Demographics Similar to Argentineans by Vision Disability
In terms of vision disability, the demographic groups most similar to Argentineans are Immigrants from Romania (2.0%, a difference of 0.030%), Immigrants from Belgium (2.0%, a difference of 0.040%), Immigrants from Russia (2.0%, a difference of 0.060%), Immigrants from Saudi Arabia (2.0%, a difference of 0.14%), and Armenian (2.0%, a difference of 0.17%).
| Demographics | Rating | Rank | Vision Disability |
| Immigrants | Serbia | 99.4 /100 | #52 | Exceptional 2.0% |
| Immigrants | Belarus | 99.3 /100 | #53 | Exceptional 2.0% |
| Macedonians | 99.3 /100 | #54 | Exceptional 2.0% |
| Laotians | 99.3 /100 | #55 | Exceptional 2.0% |
| Jordanians | 99.2 /100 | #56 | Exceptional 2.0% |
| Somalis | 99.2 /100 | #57 | Exceptional 2.0% |
| Immigrants | Saudi Arabia | 99.2 /100 | #58 | Exceptional 2.0% |
| Argentineans | 99.1 /100 | #59 | Exceptional 2.0% |
| Immigrants | Romania | 99.1 /100 | #60 | Exceptional 2.0% |
| Immigrants | Belgium | 99.1 /100 | #61 | Exceptional 2.0% |
| Immigrants | Russia | 99.1 /100 | #62 | Exceptional 2.0% |
| Armenians | 99.0 /100 | #63 | Exceptional 2.0% |
| Immigrants | Greece | 99.0 /100 | #64 | Exceptional 2.0% |
| Maltese | 98.9 /100 | #65 | Exceptional 2.0% |
| Immigrants | Argentina | 98.9 /100 | #66 | Exceptional 2.0% |
Demographics Similar to Barbadians by Vision Disability
In terms of vision disability, the demographic groups most similar to Barbadians are Portuguese (2.3%, a difference of 0.070%), Ecuadorian (2.3%, a difference of 0.17%), Immigrants from Trinidad and Tobago (2.3%, a difference of 0.28%), Guamanian/Chamorro (2.3%, a difference of 0.41%), and French Canadian (2.3%, a difference of 0.43%).
| Demographics | Rating | Rank | Vision Disability |
| Immigrants | Uruguay | 11.5 /100 | #210 | Poor 2.2% |
| Indonesians | 9.5 /100 | #211 | Tragic 2.2% |
| Bermudans | 9.0 /100 | #212 | Tragic 2.2% |
| Immigrants | Ghana | 8.9 /100 | #213 | Tragic 2.2% |
| Trinidadians and Tobagonians | 8.2 /100 | #214 | Tragic 2.2% |
| Nigerians | 7.2 /100 | #215 | Tragic 2.3% |
| Immigrants | Trinidad and Tobago | 6.1 /100 | #216 | Tragic 2.3% |
| Barbadians | 5.1 /100 | #217 | Tragic 2.3% |
| Portuguese | 4.9 /100 | #218 | Tragic 2.3% |
| Ecuadorians | 4.6 /100 | #219 | Tragic 2.3% |
| Guamanians/Chamorros | 3.9 /100 | #220 | Tragic 2.3% |
| French Canadians | 3.9 /100 | #221 | Tragic 2.3% |
| Immigrants | Senegal | 3.8 /100 | #222 | Tragic 2.3% |
| Basques | 3.5 /100 | #223 | Tragic 2.3% |
| Irish | 3.4 /100 | #224 | Tragic 2.3% |