Immigrants from Indonesia vs Immigrants from Germany Ambulatory Disability
COMPARE
Immigrants from Indonesia
Immigrants from Germany
Ambulatory Disability
Ambulatory Disability Comparison
Immigrants from Indonesia
Immigrants from Germany
5.5%
AMBULATORY DISABILITY
99.9/ 100
METRIC RATING
44th/ 347
METRIC RANK
6.4%
AMBULATORY DISABILITY
1.8/ 100
METRIC RATING
237th/ 347
METRIC RANK
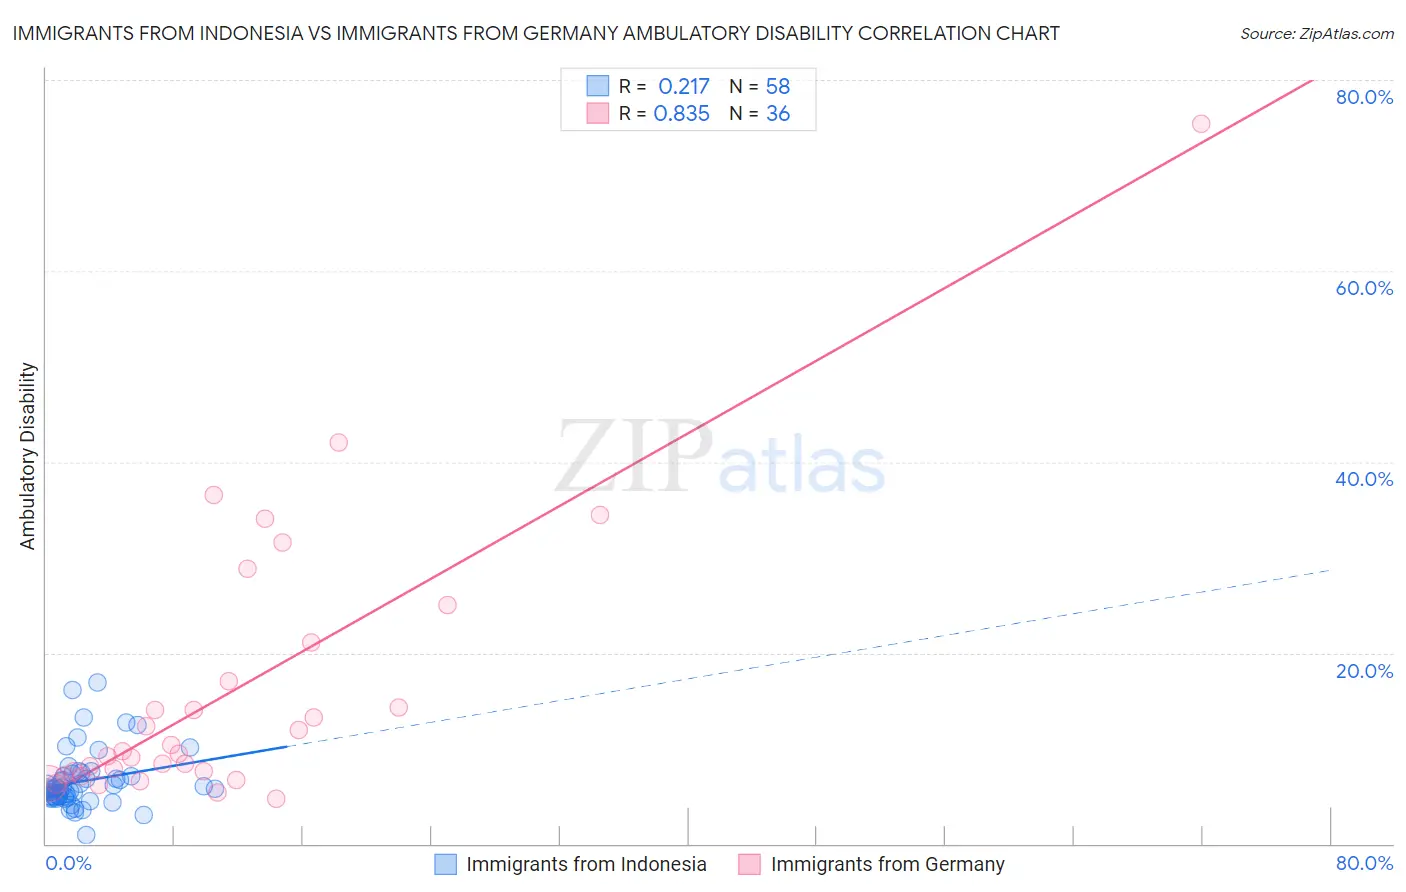
Immigrants from Indonesia vs Immigrants from Germany Ambulatory Disability Correlation Chart
The statistical analysis conducted on geographies consisting of 215,776,699 people shows a weak positive correlation between the proportion of Immigrants from Indonesia and percentage of population with ambulatory disability in the United States with a correlation coefficient (R) of 0.217 and weighted average of 5.5%. Similarly, the statistical analysis conducted on geographies consisting of 463,770,128 people shows a very strong positive correlation between the proportion of Immigrants from Germany and percentage of population with ambulatory disability in the United States with a correlation coefficient (R) of 0.835 and weighted average of 6.4%, a difference of 16.1%.
Ambulatory Disability Correlation Summary
| Measurement | Immigrants from Indonesia | Immigrants from Germany |
| Minimum | 0.92% | 4.7% |
| Maximum | 16.9% | 75.4% |
| Range | 16.0% | 70.7% |
| Mean | 6.5% | 16.1% |
| Median | 5.8% | 9.6% |
| Interquartile 25% (IQ1) | 4.8% | 7.4% |
| Interquartile 75% (IQ3) | 7.1% | 19.0% |
| Interquartile Range (IQR) | 2.3% | 11.6% |
| Standard Deviation (Sample) | 3.0% | 14.5% |
| Standard Deviation (Population) | 3.0% | 14.3% |
Similar Demographics by Ambulatory Disability
Demographics Similar to Immigrants from Indonesia by Ambulatory Disability
In terms of ambulatory disability, the demographic groups most similar to Immigrants from Indonesia are Paraguayan (5.5%, a difference of 0.12%), Immigrants from Sweden (5.6%, a difference of 0.17%), Egyptian (5.6%, a difference of 0.18%), Immigrants from Japan (5.6%, a difference of 0.18%), and Immigrants from Argentina (5.6%, a difference of 0.19%).
| Demographics | Rating | Rank | Ambulatory Disability |
| Turks | 100.0 /100 | #37 | Exceptional 5.5% |
| Cypriots | 100.0 /100 | #38 | Exceptional 5.5% |
| Immigrants | Eritrea | 100.0 /100 | #39 | Exceptional 5.5% |
| Venezuelans | 99.9 /100 | #40 | Exceptional 5.5% |
| Mongolians | 99.9 /100 | #41 | Exceptional 5.5% |
| Argentineans | 99.9 /100 | #42 | Exceptional 5.5% |
| Paraguayans | 99.9 /100 | #43 | Exceptional 5.5% |
| Immigrants | Indonesia | 99.9 /100 | #44 | Exceptional 5.5% |
| Immigrants | Sweden | 99.9 /100 | #45 | Exceptional 5.6% |
| Egyptians | 99.9 /100 | #46 | Exceptional 5.6% |
| Immigrants | Japan | 99.9 /100 | #47 | Exceptional 5.6% |
| Immigrants | Argentina | 99.9 /100 | #48 | Exceptional 5.6% |
| Bulgarians | 99.9 /100 | #49 | Exceptional 5.6% |
| Luxembourgers | 99.9 /100 | #50 | Exceptional 5.6% |
| Taiwanese | 99.8 /100 | #51 | Exceptional 5.6% |
Demographics Similar to Immigrants from Germany by Ambulatory Disability
In terms of ambulatory disability, the demographic groups most similar to Immigrants from Germany are Haitian (6.4%, a difference of 0.010%), Senegalese (6.4%, a difference of 0.080%), Dutch (6.4%, a difference of 0.090%), Immigrants from Senegal (6.4%, a difference of 0.10%), and Immigrants from Haiti (6.5%, a difference of 0.19%).
| Demographics | Rating | Rank | Ambulatory Disability |
| Mexicans | 3.5 /100 | #230 | Tragic 6.4% |
| Panamanians | 3.1 /100 | #231 | Tragic 6.4% |
| Assyrians/Chaldeans/Syriacs | 2.4 /100 | #232 | Tragic 6.4% |
| Sub-Saharan Africans | 2.3 /100 | #233 | Tragic 6.4% |
| Immigrants | Liberia | 2.3 /100 | #234 | Tragic 6.4% |
| Hispanics or Latinos | 2.2 /100 | #235 | Tragic 6.4% |
| Dutch | 2.0 /100 | #236 | Tragic 6.4% |
| Immigrants | Germany | 1.8 /100 | #237 | Tragic 6.4% |
| Haitians | 1.8 /100 | #238 | Tragic 6.4% |
| Senegalese | 1.7 /100 | #239 | Tragic 6.4% |
| Immigrants | Senegal | 1.7 /100 | #240 | Tragic 6.4% |
| Immigrants | Haiti | 1.6 /100 | #241 | Tragic 6.5% |
| Spaniards | 1.6 /100 | #242 | Tragic 6.5% |
| Germans | 1.5 /100 | #243 | Tragic 6.5% |
| Immigrants | Panama | 1.5 /100 | #244 | Tragic 6.5% |