Immigrants from Africa vs Immigrants from Germany Ambulatory Disability
COMPARE
Immigrants from Africa
Immigrants from Germany
Ambulatory Disability
Ambulatory Disability Comparison
Immigrants from Africa
Immigrants from Germany
5.9%
AMBULATORY DISABILITY
94.7/ 100
METRIC RATING
116th/ 347
METRIC RANK
6.4%
AMBULATORY DISABILITY
1.8/ 100
METRIC RATING
237th/ 347
METRIC RANK
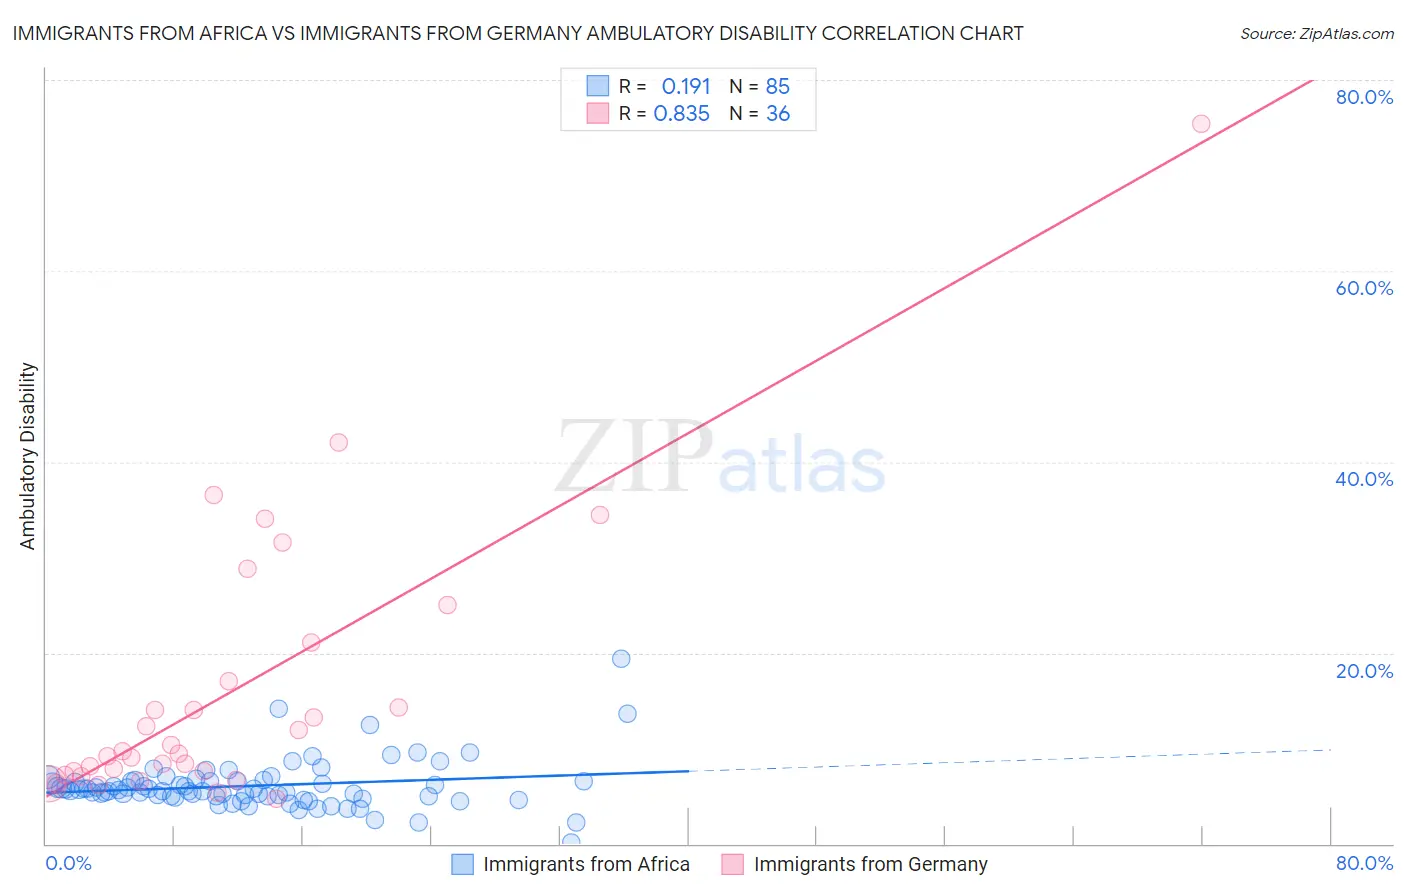
Immigrants from Africa vs Immigrants from Germany Ambulatory Disability Correlation Chart
The statistical analysis conducted on geographies consisting of 469,140,674 people shows a poor positive correlation between the proportion of Immigrants from Africa and percentage of population with ambulatory disability in the United States with a correlation coefficient (R) of 0.191 and weighted average of 5.9%. Similarly, the statistical analysis conducted on geographies consisting of 463,770,128 people shows a very strong positive correlation between the proportion of Immigrants from Germany and percentage of population with ambulatory disability in the United States with a correlation coefficient (R) of 0.835 and weighted average of 6.4%, a difference of 9.5%.
Ambulatory Disability Correlation Summary
| Measurement | Immigrants from Africa | Immigrants from Germany |
| Minimum | 0.17% | 4.7% |
| Maximum | 19.4% | 75.4% |
| Range | 19.2% | 70.7% |
| Mean | 6.1% | 16.1% |
| Median | 5.6% | 9.6% |
| Interquartile 25% (IQ1) | 5.0% | 7.4% |
| Interquartile 75% (IQ3) | 6.6% | 19.0% |
| Interquartile Range (IQR) | 1.6% | 11.6% |
| Standard Deviation (Sample) | 2.6% | 14.5% |
| Standard Deviation (Population) | 2.6% | 14.3% |
Similar Demographics by Ambulatory Disability
Demographics Similar to Immigrants from Africa by Ambulatory Disability
In terms of ambulatory disability, the demographic groups most similar to Immigrants from Africa are South American Indian (5.9%, a difference of 0.010%), Immigrants from Poland (5.9%, a difference of 0.22%), Immigrants from Uruguay (5.9%, a difference of 0.28%), Immigrants from South Eastern Asia (5.9%, a difference of 0.28%), and Russian (5.9%, a difference of 0.32%).
| Demographics | Rating | Rank | Ambulatory Disability |
| Immigrants | Netherlands | 97.1 /100 | #109 | Exceptional 5.8% |
| Immigrants | Colombia | 96.7 /100 | #110 | Exceptional 5.8% |
| Danes | 96.6 /100 | #111 | Exceptional 5.8% |
| South Africans | 96.3 /100 | #112 | Exceptional 5.9% |
| Immigrants | Uruguay | 95.6 /100 | #113 | Exceptional 5.9% |
| Immigrants | Poland | 95.4 /100 | #114 | Exceptional 5.9% |
| South American Indians | 94.8 /100 | #115 | Exceptional 5.9% |
| Immigrants | Africa | 94.7 /100 | #116 | Exceptional 5.9% |
| Immigrants | South Eastern Asia | 93.6 /100 | #117 | Exceptional 5.9% |
| Russians | 93.4 /100 | #118 | Exceptional 5.9% |
| Norwegians | 93.1 /100 | #119 | Exceptional 5.9% |
| Estonians | 92.9 /100 | #120 | Exceptional 5.9% |
| Costa Ricans | 92.6 /100 | #121 | Exceptional 5.9% |
| Icelanders | 92.6 /100 | #122 | Exceptional 5.9% |
| Immigrants | Russia | 92.4 /100 | #123 | Exceptional 5.9% |
Demographics Similar to Immigrants from Germany by Ambulatory Disability
In terms of ambulatory disability, the demographic groups most similar to Immigrants from Germany are Haitian (6.4%, a difference of 0.010%), Senegalese (6.4%, a difference of 0.080%), Dutch (6.4%, a difference of 0.090%), Immigrants from Senegal (6.4%, a difference of 0.10%), and Immigrants from Haiti (6.5%, a difference of 0.19%).
| Demographics | Rating | Rank | Ambulatory Disability |
| Mexicans | 3.5 /100 | #230 | Tragic 6.4% |
| Panamanians | 3.1 /100 | #231 | Tragic 6.4% |
| Assyrians/Chaldeans/Syriacs | 2.4 /100 | #232 | Tragic 6.4% |
| Sub-Saharan Africans | 2.3 /100 | #233 | Tragic 6.4% |
| Immigrants | Liberia | 2.3 /100 | #234 | Tragic 6.4% |
| Hispanics or Latinos | 2.2 /100 | #235 | Tragic 6.4% |
| Dutch | 2.0 /100 | #236 | Tragic 6.4% |
| Immigrants | Germany | 1.8 /100 | #237 | Tragic 6.4% |
| Haitians | 1.8 /100 | #238 | Tragic 6.4% |
| Senegalese | 1.7 /100 | #239 | Tragic 6.4% |
| Immigrants | Senegal | 1.7 /100 | #240 | Tragic 6.4% |
| Immigrants | Haiti | 1.6 /100 | #241 | Tragic 6.5% |
| Spaniards | 1.6 /100 | #242 | Tragic 6.5% |
| Germans | 1.5 /100 | #243 | Tragic 6.5% |
| Immigrants | Panama | 1.5 /100 | #244 | Tragic 6.5% |