Arab vs Cheyenne Ambulatory Disability
COMPARE
Arab
Cheyenne
Ambulatory Disability
Ambulatory Disability Comparison
Arabs
Cheyenne
5.9%
AMBULATORY DISABILITY
91.5/ 100
METRIC RATING
126th/ 347
METRIC RANK
6.9%
AMBULATORY DISABILITY
0.0/ 100
METRIC RATING
292nd/ 347
METRIC RANK
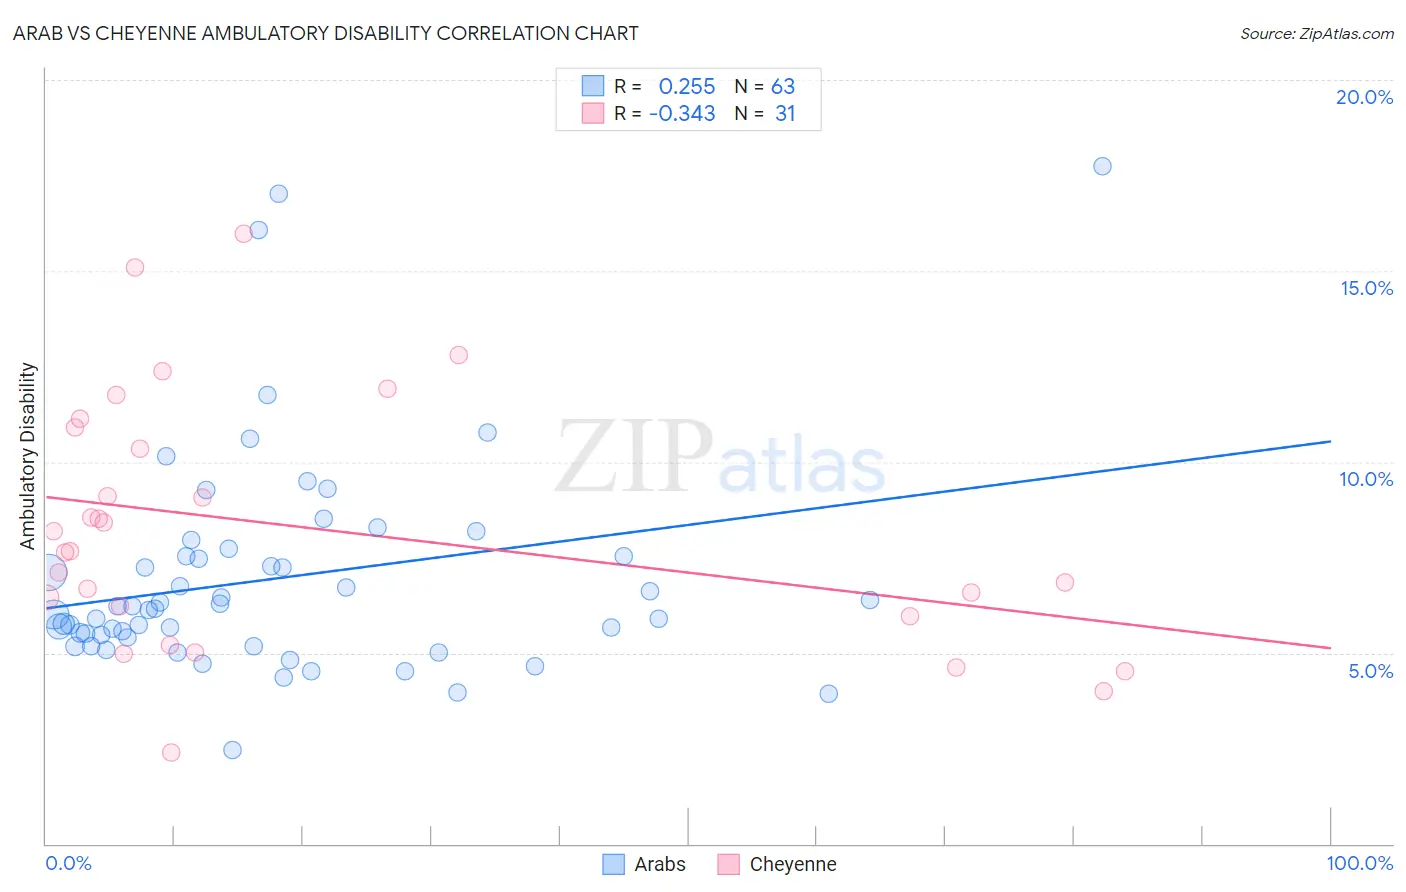
Arab vs Cheyenne Ambulatory Disability Correlation Chart
The statistical analysis conducted on geographies consisting of 486,612,258 people shows a weak positive correlation between the proportion of Arabs and percentage of population with ambulatory disability in the United States with a correlation coefficient (R) of 0.255 and weighted average of 5.9%. Similarly, the statistical analysis conducted on geographies consisting of 80,709,712 people shows a mild negative correlation between the proportion of Cheyenne and percentage of population with ambulatory disability in the United States with a correlation coefficient (R) of -0.343 and weighted average of 6.9%, a difference of 16.0%.
Ambulatory Disability Correlation Summary
| Measurement | Arab | Cheyenne |
| Minimum | 2.5% | 2.4% |
| Maximum | 17.8% | 16.0% |
| Range | 15.3% | 13.6% |
| Mean | 7.0% | 8.3% |
| Median | 6.2% | 7.7% |
| Interquartile 25% (IQ1) | 5.4% | 6.0% |
| Interquartile 75% (IQ3) | 7.5% | 10.9% |
| Interquartile Range (IQR) | 2.1% | 4.9% |
| Standard Deviation (Sample) | 2.9% | 3.3% |
| Standard Deviation (Population) | 2.8% | 3.2% |
Similar Demographics by Ambulatory Disability
Demographics Similar to Arabs by Ambulatory Disability
In terms of ambulatory disability, the demographic groups most similar to Arabs are Korean (5.9%, a difference of 0.020%), Immigrants from Nigeria (5.9%, a difference of 0.10%), Immigrants from Western Asia (5.9%, a difference of 0.13%), Immigrants from Middle Africa (5.9%, a difference of 0.14%), and Immigrants from Norway (5.9%, a difference of 0.17%).
| Demographics | Rating | Rank | Ambulatory Disability |
| Norwegians | 93.1 /100 | #119 | Exceptional 5.9% |
| Estonians | 92.9 /100 | #120 | Exceptional 5.9% |
| Costa Ricans | 92.6 /100 | #121 | Exceptional 5.9% |
| Icelanders | 92.6 /100 | #122 | Exceptional 5.9% |
| Immigrants | Russia | 92.4 /100 | #123 | Exceptional 5.9% |
| Immigrants | Middle Africa | 92.2 /100 | #124 | Exceptional 5.9% |
| Koreans | 91.6 /100 | #125 | Exceptional 5.9% |
| Arabs | 91.5 /100 | #126 | Exceptional 5.9% |
| Immigrants | Nigeria | 90.9 /100 | #127 | Exceptional 5.9% |
| Immigrants | Western Asia | 90.7 /100 | #128 | Exceptional 5.9% |
| Immigrants | Norway | 90.5 /100 | #129 | Exceptional 5.9% |
| Immigrants | Kazakhstan | 89.7 /100 | #130 | Excellent 5.9% |
| Immigrants | Costa Rica | 89.5 /100 | #131 | Excellent 5.9% |
| Immigrants | Europe | 87.8 /100 | #132 | Excellent 6.0% |
| Immigrants | Immigrants | 86.9 /100 | #133 | Excellent 6.0% |
Demographics Similar to Cheyenne by Ambulatory Disability
In terms of ambulatory disability, the demographic groups most similar to Cheyenne are West Indian (6.9%, a difference of 0.060%), Scotch-Irish (6.9%, a difference of 0.16%), Immigrants from Dominica (6.9%, a difference of 0.19%), Immigrants from St. Vincent and the Grenadines (6.9%, a difference of 0.24%), and Nonimmigrants (6.9%, a difference of 0.33%).
| Demographics | Rating | Rank | Ambulatory Disability |
| Fijians | 0.0 /100 | #285 | Tragic 6.8% |
| Yakama | 0.0 /100 | #286 | Tragic 6.8% |
| U.S. Virgin Islanders | 0.0 /100 | #287 | Tragic 6.8% |
| Immigrants | Nonimmigrants | 0.0 /100 | #288 | Tragic 6.9% |
| Immigrants | Dominica | 0.0 /100 | #289 | Tragic 6.9% |
| Scotch-Irish | 0.0 /100 | #290 | Tragic 6.9% |
| West Indians | 0.0 /100 | #291 | Tragic 6.9% |
| Cheyenne | 0.0 /100 | #292 | Tragic 6.9% |
| Immigrants | St. Vincent and the Grenadines | 0.0 /100 | #293 | Tragic 6.9% |
| Cape Verdeans | 0.0 /100 | #294 | Tragic 6.9% |
| Crow | 0.0 /100 | #295 | Tragic 6.9% |
| Alaskan Athabascans | 0.0 /100 | #296 | Tragic 6.9% |
| French American Indians | 0.0 /100 | #297 | Tragic 6.9% |
| Immigrants | Grenada | 0.0 /100 | #298 | Tragic 6.9% |
| Puget Sound Salish | 0.0 /100 | #299 | Tragic 6.9% |