Arab vs Immigrants from Bahamas Ambulatory Disability
COMPARE
Arab
Immigrants from Bahamas
Ambulatory Disability
Ambulatory Disability Comparison
Arabs
Immigrants from Bahamas
5.9%
AMBULATORY DISABILITY
91.5/ 100
METRIC RATING
126th/ 347
METRIC RANK
6.5%
AMBULATORY DISABILITY
0.8/ 100
METRIC RATING
252nd/ 347
METRIC RANK
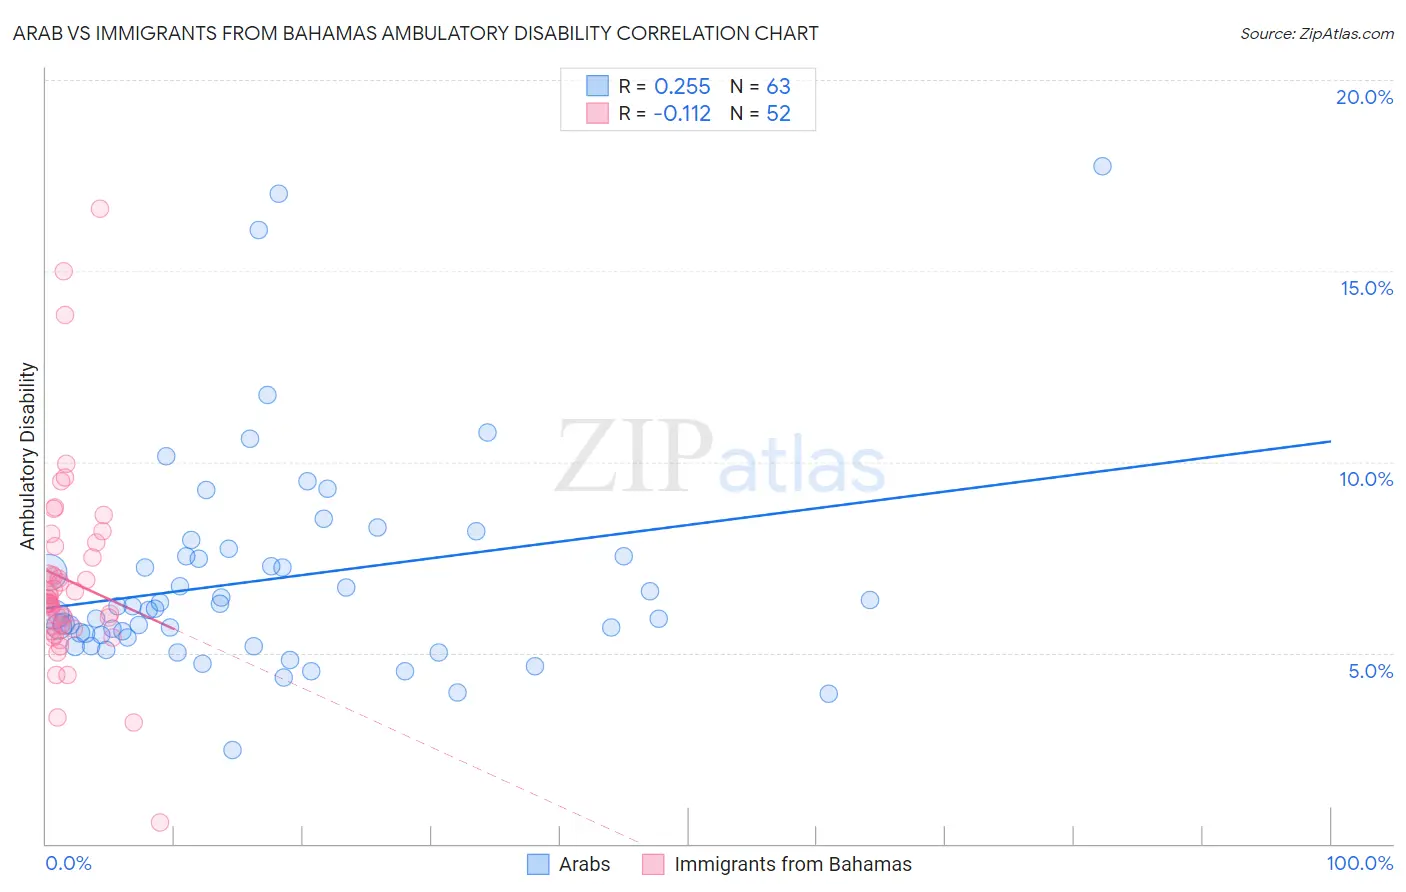
Arab vs Immigrants from Bahamas Ambulatory Disability Correlation Chart
The statistical analysis conducted on geographies consisting of 486,612,258 people shows a weak positive correlation between the proportion of Arabs and percentage of population with ambulatory disability in the United States with a correlation coefficient (R) of 0.255 and weighted average of 5.9%. Similarly, the statistical analysis conducted on geographies consisting of 104,629,900 people shows a poor negative correlation between the proportion of Immigrants from Bahamas and percentage of population with ambulatory disability in the United States with a correlation coefficient (R) of -0.112 and weighted average of 6.5%, a difference of 9.9%.
Ambulatory Disability Correlation Summary
| Measurement | Arab | Immigrants from Bahamas |
| Minimum | 2.5% | 0.55% |
| Maximum | 17.8% | 16.6% |
| Range | 15.3% | 16.1% |
| Mean | 7.0% | 6.9% |
| Median | 6.2% | 6.3% |
| Interquartile 25% (IQ1) | 5.4% | 5.7% |
| Interquartile 75% (IQ3) | 7.5% | 7.7% |
| Interquartile Range (IQR) | 2.1% | 2.0% |
| Standard Deviation (Sample) | 2.9% | 2.6% |
| Standard Deviation (Population) | 2.8% | 2.6% |
Similar Demographics by Ambulatory Disability
Demographics Similar to Arabs by Ambulatory Disability
In terms of ambulatory disability, the demographic groups most similar to Arabs are Korean (5.9%, a difference of 0.020%), Immigrants from Nigeria (5.9%, a difference of 0.10%), Immigrants from Western Asia (5.9%, a difference of 0.13%), Immigrants from Middle Africa (5.9%, a difference of 0.14%), and Immigrants from Norway (5.9%, a difference of 0.17%).
| Demographics | Rating | Rank | Ambulatory Disability |
| Norwegians | 93.1 /100 | #119 | Exceptional 5.9% |
| Estonians | 92.9 /100 | #120 | Exceptional 5.9% |
| Costa Ricans | 92.6 /100 | #121 | Exceptional 5.9% |
| Icelanders | 92.6 /100 | #122 | Exceptional 5.9% |
| Immigrants | Russia | 92.4 /100 | #123 | Exceptional 5.9% |
| Immigrants | Middle Africa | 92.2 /100 | #124 | Exceptional 5.9% |
| Koreans | 91.6 /100 | #125 | Exceptional 5.9% |
| Arabs | 91.5 /100 | #126 | Exceptional 5.9% |
| Immigrants | Nigeria | 90.9 /100 | #127 | Exceptional 5.9% |
| Immigrants | Western Asia | 90.7 /100 | #128 | Exceptional 5.9% |
| Immigrants | Norway | 90.5 /100 | #129 | Exceptional 5.9% |
| Immigrants | Kazakhstan | 89.7 /100 | #130 | Excellent 5.9% |
| Immigrants | Costa Rica | 89.5 /100 | #131 | Excellent 5.9% |
| Immigrants | Europe | 87.8 /100 | #132 | Excellent 6.0% |
| Immigrants | Immigrants | 86.9 /100 | #133 | Excellent 6.0% |
Demographics Similar to Immigrants from Bahamas by Ambulatory Disability
In terms of ambulatory disability, the demographic groups most similar to Immigrants from Bahamas are Scottish (6.5%, a difference of 0.050%), Hawaiian (6.5%, a difference of 0.20%), Belizean (6.5%, a difference of 0.21%), Welsh (6.5%, a difference of 0.28%), and Immigrants from Uzbekistan (6.5%, a difference of 0.36%).
| Demographics | Rating | Rank | Ambulatory Disability |
| Tlingit-Haida | 1.5 /100 | #245 | Tragic 6.5% |
| Armenians | 1.5 /100 | #246 | Tragic 6.5% |
| Immigrants | Cuba | 1.4 /100 | #247 | Tragic 6.5% |
| Immigrants | Portugal | 1.4 /100 | #248 | Tragic 6.5% |
| Native Hawaiians | 1.1 /100 | #249 | Tragic 6.5% |
| Chinese | 1.0 /100 | #250 | Tragic 6.5% |
| Hawaiians | 0.9 /100 | #251 | Tragic 6.5% |
| Immigrants | Bahamas | 0.8 /100 | #252 | Tragic 6.5% |
| Scottish | 0.7 /100 | #253 | Tragic 6.5% |
| Belizeans | 0.7 /100 | #254 | Tragic 6.5% |
| Welsh | 0.6 /100 | #255 | Tragic 6.5% |
| Immigrants | Uzbekistan | 0.6 /100 | #256 | Tragic 6.5% |
| Bermudans | 0.5 /100 | #257 | Tragic 6.5% |
| Spanish American Indians | 0.5 /100 | #258 | Tragic 6.5% |
| Aleuts | 0.4 /100 | #259 | Tragic 6.6% |