Arab vs Slovak Ambulatory Disability
COMPARE
Arab
Slovak
Ambulatory Disability
Ambulatory Disability Comparison
Arabs
Slovaks
5.9%
AMBULATORY DISABILITY
91.5/ 100
METRIC RATING
126th/ 347
METRIC RANK
6.7%
AMBULATORY DISABILITY
0.1/ 100
METRIC RATING
270th/ 347
METRIC RANK
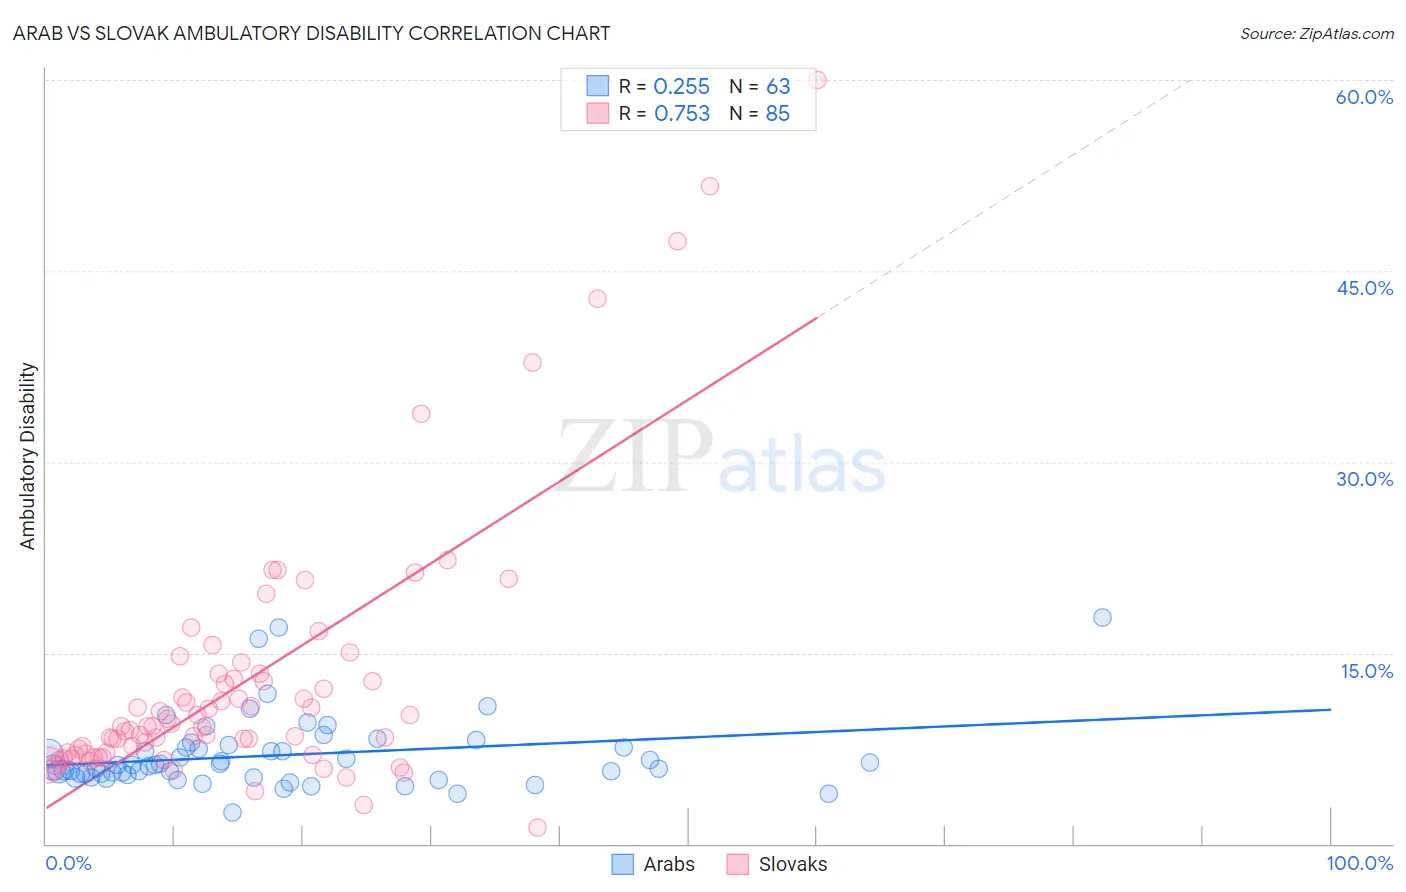
Arab vs Slovak Ambulatory Disability Correlation Chart
The statistical analysis conducted on geographies consisting of 486,612,258 people shows a weak positive correlation between the proportion of Arabs and percentage of population with ambulatory disability in the United States with a correlation coefficient (R) of 0.255 and weighted average of 5.9%. Similarly, the statistical analysis conducted on geographies consisting of 397,780,873 people shows a strong positive correlation between the proportion of Slovaks and percentage of population with ambulatory disability in the United States with a correlation coefficient (R) of 0.753 and weighted average of 6.7%, a difference of 12.4%.
Ambulatory Disability Correlation Summary
| Measurement | Arab | Slovak |
| Minimum | 2.5% | 1.3% |
| Maximum | 17.8% | 60.0% |
| Range | 15.3% | 58.7% |
| Mean | 7.0% | 12.6% |
| Median | 6.2% | 9.2% |
| Interquartile 25% (IQ1) | 5.4% | 7.0% |
| Interquartile 75% (IQ3) | 7.5% | 13.2% |
| Interquartile Range (IQR) | 2.1% | 6.1% |
| Standard Deviation (Sample) | 2.9% | 10.4% |
| Standard Deviation (Population) | 2.8% | 10.3% |
Similar Demographics by Ambulatory Disability
Demographics Similar to Arabs by Ambulatory Disability
In terms of ambulatory disability, the demographic groups most similar to Arabs are Korean (5.9%, a difference of 0.020%), Immigrants from Nigeria (5.9%, a difference of 0.10%), Immigrants from Western Asia (5.9%, a difference of 0.13%), Immigrants from Middle Africa (5.9%, a difference of 0.14%), and Immigrants from Norway (5.9%, a difference of 0.17%).
| Demographics | Rating | Rank | Ambulatory Disability |
| Norwegians | 93.1 /100 | #119 | Exceptional 5.9% |
| Estonians | 92.9 /100 | #120 | Exceptional 5.9% |
| Costa Ricans | 92.6 /100 | #121 | Exceptional 5.9% |
| Icelanders | 92.6 /100 | #122 | Exceptional 5.9% |
| Immigrants | Russia | 92.4 /100 | #123 | Exceptional 5.9% |
| Immigrants | Middle Africa | 92.2 /100 | #124 | Exceptional 5.9% |
| Koreans | 91.6 /100 | #125 | Exceptional 5.9% |
| Arabs | 91.5 /100 | #126 | Exceptional 5.9% |
| Immigrants | Nigeria | 90.9 /100 | #127 | Exceptional 5.9% |
| Immigrants | Western Asia | 90.7 /100 | #128 | Exceptional 5.9% |
| Immigrants | Norway | 90.5 /100 | #129 | Exceptional 5.9% |
| Immigrants | Kazakhstan | 89.7 /100 | #130 | Excellent 5.9% |
| Immigrants | Costa Rica | 89.5 /100 | #131 | Excellent 5.9% |
| Immigrants | Europe | 87.8 /100 | #132 | Excellent 6.0% |
| Immigrants | Immigrants | 86.9 /100 | #133 | Excellent 6.0% |
Demographics Similar to Slovaks by Ambulatory Disability
In terms of ambulatory disability, the demographic groups most similar to Slovaks are Immigrants from Trinidad and Tobago (6.7%, a difference of 0.10%), French (6.6%, a difference of 0.16%), French Canadian (6.7%, a difference of 0.46%), Spanish (6.6%, a difference of 0.47%), and Trinidadian and Tobagonian (6.6%, a difference of 0.48%).
| Demographics | Rating | Rank | Ambulatory Disability |
| Hmong | 0.3 /100 | #263 | Tragic 6.6% |
| Nepalese | 0.2 /100 | #264 | Tragic 6.6% |
| Bahamians | 0.2 /100 | #265 | Tragic 6.6% |
| Guyanese | 0.2 /100 | #266 | Tragic 6.6% |
| Trinidadians and Tobagonians | 0.2 /100 | #267 | Tragic 6.6% |
| Spanish | 0.2 /100 | #268 | Tragic 6.6% |
| French | 0.1 /100 | #269 | Tragic 6.6% |
| Slovaks | 0.1 /100 | #270 | Tragic 6.7% |
| Immigrants | Trinidad and Tobago | 0.1 /100 | #271 | Tragic 6.7% |
| French Canadians | 0.1 /100 | #272 | Tragic 6.7% |
| Whites/Caucasians | 0.1 /100 | #273 | Tragic 6.7% |
| Sioux | 0.1 /100 | #274 | Tragic 6.7% |
| Immigrants | Guyana | 0.1 /100 | #275 | Tragic 6.7% |
| Celtics | 0.1 /100 | #276 | Tragic 6.7% |
| Jamaicans | 0.1 /100 | #277 | Tragic 6.7% |