Arapaho vs Immigrants from North Macedonia Male Disability
COMPARE
Arapaho
Immigrants from North Macedonia
Male Disability
Male Disability Comparison
Arapaho
Immigrants from North Macedonia
13.3%
MALE DISABILITY
0.0/ 100
METRIC RATING
307th/ 347
METRIC RANK
10.9%
MALE DISABILITY
88.1/ 100
METRIC RATING
125th/ 347
METRIC RANK
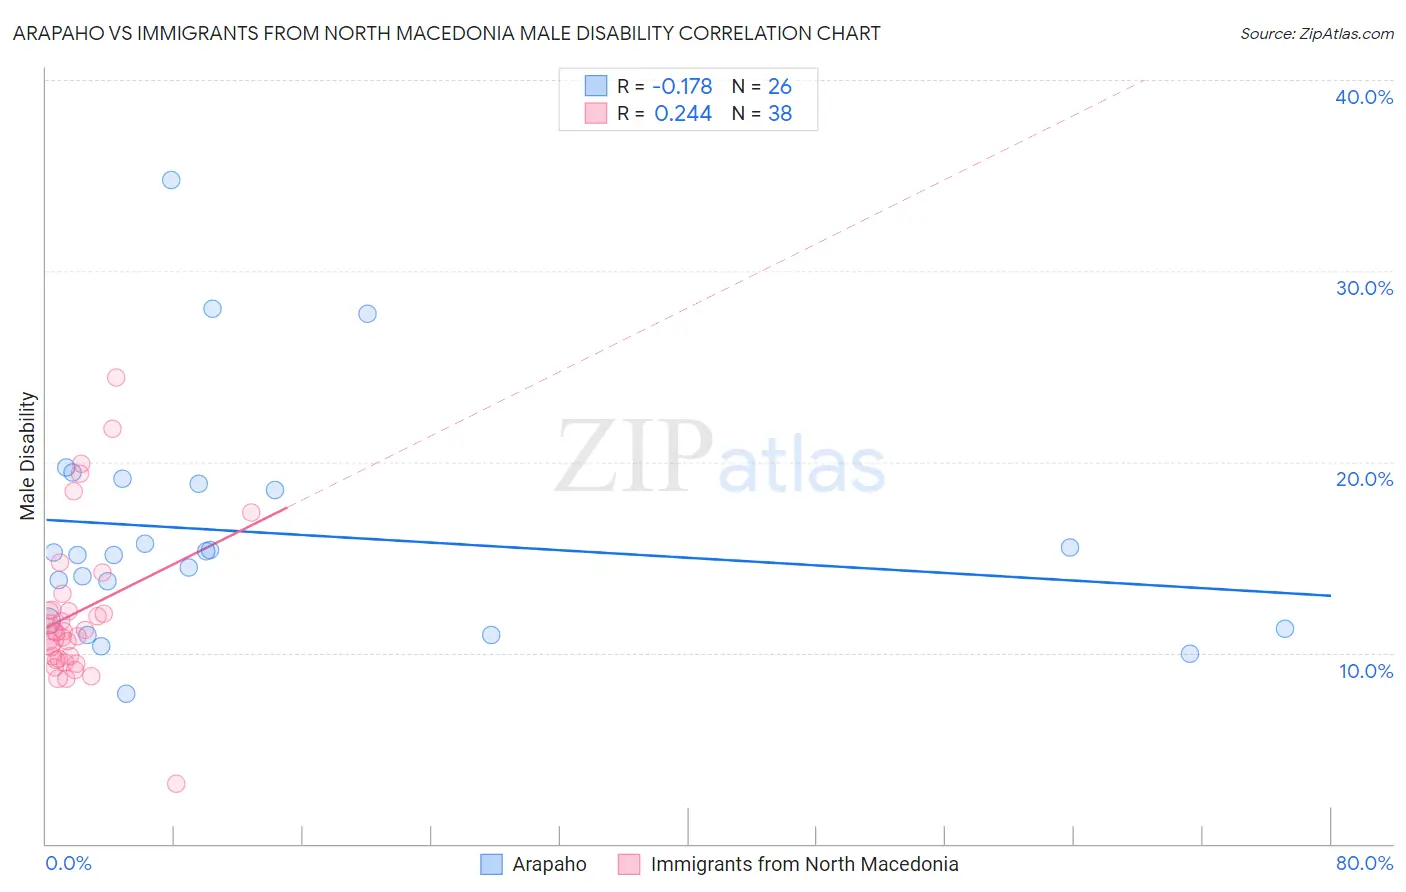
Arapaho vs Immigrants from North Macedonia Male Disability Correlation Chart
The statistical analysis conducted on geographies consisting of 29,780,236 people shows a poor negative correlation between the proportion of Arapaho and percentage of males with a disability in the United States with a correlation coefficient (R) of -0.178 and weighted average of 13.3%. Similarly, the statistical analysis conducted on geographies consisting of 74,317,186 people shows a weak positive correlation between the proportion of Immigrants from North Macedonia and percentage of males with a disability in the United States with a correlation coefficient (R) of 0.244 and weighted average of 10.9%, a difference of 22.3%.
Male Disability Correlation Summary
| Measurement | Arapaho | Immigrants from North Macedonia |
| Minimum | 7.9% | 3.1% |
| Maximum | 34.7% | 24.4% |
| Range | 26.9% | 21.3% |
| Mean | 16.3% | 12.1% |
| Median | 15.2% | 11.1% |
| Interquartile 25% (IQ1) | 11.6% | 9.7% |
| Interquartile 75% (IQ3) | 18.8% | 12.3% |
| Interquartile Range (IQR) | 7.2% | 2.6% |
| Standard Deviation (Sample) | 6.1% | 4.1% |
| Standard Deviation (Population) | 6.0% | 4.1% |
Similar Demographics by Male Disability
Demographics Similar to Arapaho by Male Disability
In terms of male disability, the demographic groups most similar to Arapaho are French American Indian (13.4%, a difference of 0.15%), Spanish American (13.3%, a difference of 0.22%), French Canadian (13.3%, a difference of 0.42%), Blackfeet (13.4%, a difference of 0.58%), and Immigrants from the Azores (13.4%, a difference of 0.72%).
| Demographics | Rating | Rank | Male Disability |
| Cheyenne | 0.0 /100 | #300 | Tragic 13.0% |
| French | 0.0 /100 | #301 | Tragic 13.0% |
| Crow | 0.0 /100 | #302 | Tragic 13.1% |
| Scotch-Irish | 0.0 /100 | #303 | Tragic 13.2% |
| Blacks/African Americans | 0.0 /100 | #304 | Tragic 13.2% |
| French Canadians | 0.0 /100 | #305 | Tragic 13.3% |
| Spanish Americans | 0.0 /100 | #306 | Tragic 13.3% |
| Arapaho | 0.0 /100 | #307 | Tragic 13.3% |
| French American Indians | 0.0 /100 | #308 | Tragic 13.4% |
| Blackfeet | 0.0 /100 | #309 | Tragic 13.4% |
| Immigrants | Azores | 0.0 /100 | #310 | Tragic 13.4% |
| Delaware | 0.0 /100 | #311 | Tragic 13.5% |
| Yakama | 0.0 /100 | #312 | Tragic 13.5% |
| Puget Sound Salish | 0.0 /100 | #313 | Tragic 13.5% |
| Aleuts | 0.0 /100 | #314 | Tragic 13.5% |
Demographics Similar to Immigrants from North Macedonia by Male Disability
In terms of male disability, the demographic groups most similar to Immigrants from North Macedonia are South American Indian (10.9%, a difference of 0.0%), Immigrants from Czechoslovakia (10.9%, a difference of 0.040%), Immigrants from Ghana (10.9%, a difference of 0.14%), Immigrants from South Eastern Asia (10.9%, a difference of 0.15%), and Immigrants from Trinidad and Tobago (10.9%, a difference of 0.16%).
| Demographics | Rating | Rank | Male Disability |
| Immigrants | Cuba | 90.2 /100 | #118 | Exceptional 10.9% |
| Armenians | 90.1 /100 | #119 | Exceptional 10.9% |
| Immigrants | Africa | 89.4 /100 | #120 | Excellent 10.9% |
| Immigrants | South Eastern Asia | 89.2 /100 | #121 | Excellent 10.9% |
| Immigrants | Ghana | 89.0 /100 | #122 | Excellent 10.9% |
| Immigrants | Czechoslovakia | 88.4 /100 | #123 | Excellent 10.9% |
| South American Indians | 88.1 /100 | #124 | Excellent 10.9% |
| Immigrants | North Macedonia | 88.1 /100 | #125 | Excellent 10.9% |
| Immigrants | Trinidad and Tobago | 86.9 /100 | #126 | Excellent 10.9% |
| Immigrants | Ukraine | 86.8 /100 | #127 | Excellent 10.9% |
| Immigrants | Latvia | 85.5 /100 | #128 | Excellent 10.9% |
| Immigrants | Philippines | 85.4 /100 | #129 | Excellent 10.9% |
| Brazilians | 85.4 /100 | #130 | Excellent 10.9% |
| Macedonians | 84.2 /100 | #131 | Excellent 11.0% |
| Immigrants | Fiji | 84.0 /100 | #132 | Excellent 11.0% |