Immigrants from Greece vs Immigrants from North Macedonia Male Disability
COMPARE
Immigrants from Greece
Immigrants from North Macedonia
Male Disability
Male Disability Comparison
Immigrants from Greece
Immigrants from North Macedonia
10.7%
MALE DISABILITY
95.6/ 100
METRIC RATING
101st/ 347
METRIC RANK
10.9%
MALE DISABILITY
88.1/ 100
METRIC RATING
125th/ 347
METRIC RANK
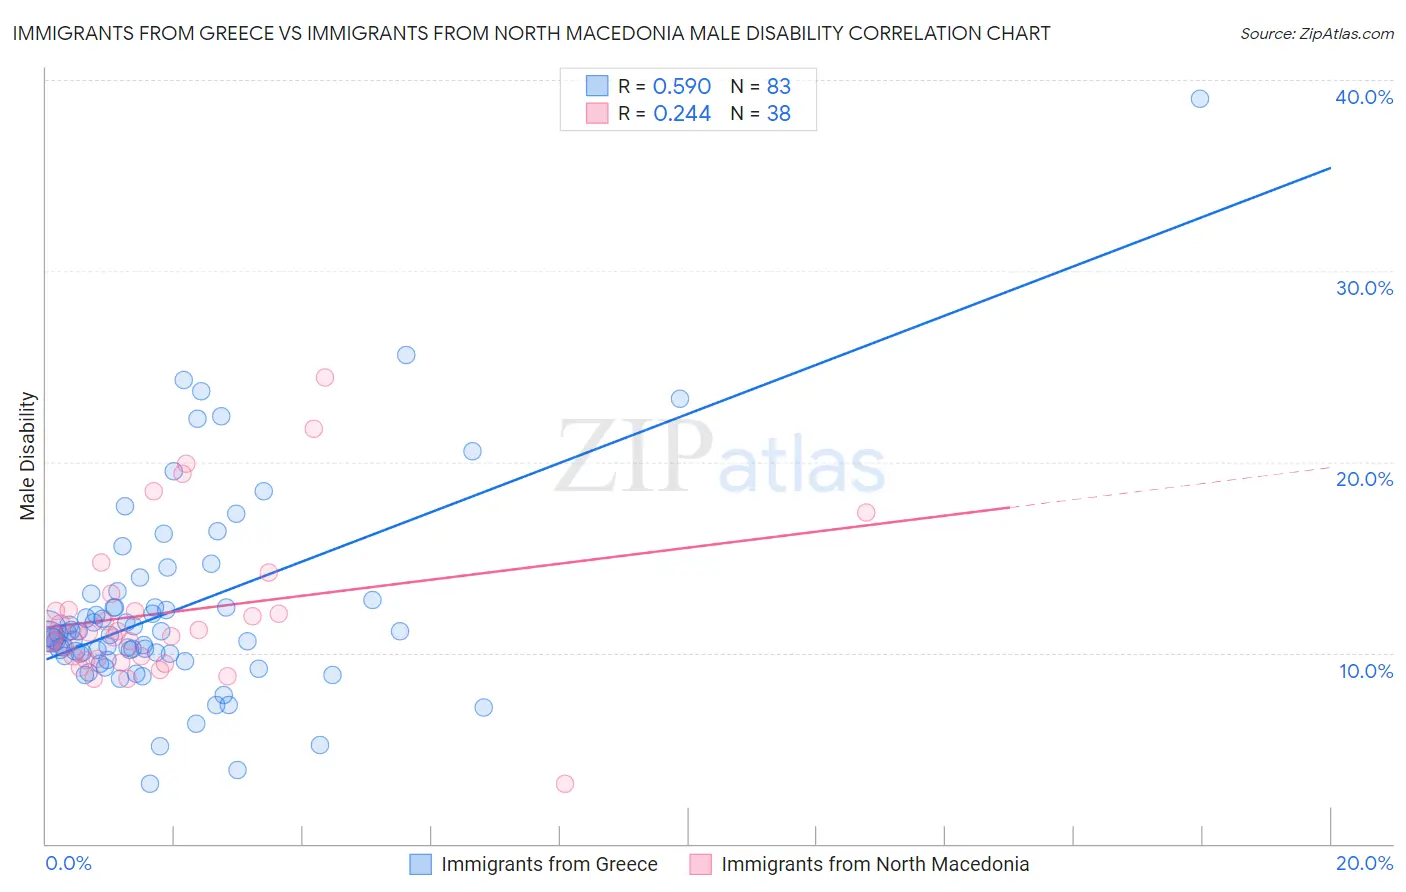
Immigrants from Greece vs Immigrants from North Macedonia Male Disability Correlation Chart
The statistical analysis conducted on geographies consisting of 216,877,187 people shows a substantial positive correlation between the proportion of Immigrants from Greece and percentage of males with a disability in the United States with a correlation coefficient (R) of 0.590 and weighted average of 10.7%. Similarly, the statistical analysis conducted on geographies consisting of 74,317,186 people shows a weak positive correlation between the proportion of Immigrants from North Macedonia and percentage of males with a disability in the United States with a correlation coefficient (R) of 0.244 and weighted average of 10.9%, a difference of 1.6%.
Male Disability Correlation Summary
| Measurement | Immigrants from Greece | Immigrants from North Macedonia |
| Minimum | 3.1% | 3.1% |
| Maximum | 39.0% | 24.4% |
| Range | 35.9% | 21.3% |
| Mean | 12.3% | 12.1% |
| Median | 11.0% | 11.1% |
| Interquartile 25% (IQ1) | 9.8% | 9.7% |
| Interquartile 75% (IQ3) | 12.8% | 12.3% |
| Interquartile Range (IQR) | 2.9% | 2.6% |
| Standard Deviation (Sample) | 5.4% | 4.1% |
| Standard Deviation (Population) | 5.3% | 4.1% |
Similar Demographics by Male Disability
Demographics Similar to Immigrants from Greece by Male Disability
In terms of male disability, the demographic groups most similar to Immigrants from Greece are Immigrants from Eastern Europe (10.7%, a difference of 0.10%), Immigrants from Kazakhstan (10.7%, a difference of 0.11%), Uruguayan (10.7%, a difference of 0.11%), Immigrants from Nigeria (10.8%, a difference of 0.17%), and Immigrants from Switzerland (10.7%, a difference of 0.18%).
| Demographics | Rating | Rank | Male Disability |
| Immigrants | Sweden | 96.9 /100 | #94 | Exceptional 10.7% |
| Chileans | 96.9 /100 | #95 | Exceptional 10.7% |
| Nicaraguans | 96.6 /100 | #96 | Exceptional 10.7% |
| Immigrants | Armenia | 96.6 /100 | #97 | Exceptional 10.7% |
| Immigrants | Romania | 96.5 /100 | #98 | Exceptional 10.7% |
| Immigrants | Switzerland | 96.1 /100 | #99 | Exceptional 10.7% |
| Immigrants | Kazakhstan | 95.9 /100 | #100 | Exceptional 10.7% |
| Immigrants | Greece | 95.6 /100 | #101 | Exceptional 10.7% |
| Immigrants | Eastern Europe | 95.3 /100 | #102 | Exceptional 10.7% |
| Uruguayans | 95.3 /100 | #103 | Exceptional 10.7% |
| Immigrants | Nigeria | 95.1 /100 | #104 | Exceptional 10.8% |
| Immigrants | Brazil | 95.0 /100 | #105 | Exceptional 10.8% |
| Immigrants | Syria | 94.9 /100 | #106 | Exceptional 10.8% |
| Immigrants | Eastern Africa | 94.3 /100 | #107 | Exceptional 10.8% |
| Immigrants | Belgium | 94.2 /100 | #108 | Exceptional 10.8% |
Demographics Similar to Immigrants from North Macedonia by Male Disability
In terms of male disability, the demographic groups most similar to Immigrants from North Macedonia are South American Indian (10.9%, a difference of 0.0%), Immigrants from Czechoslovakia (10.9%, a difference of 0.040%), Immigrants from Ghana (10.9%, a difference of 0.14%), Immigrants from South Eastern Asia (10.9%, a difference of 0.15%), and Immigrants from Trinidad and Tobago (10.9%, a difference of 0.16%).
| Demographics | Rating | Rank | Male Disability |
| Immigrants | Cuba | 90.2 /100 | #118 | Exceptional 10.9% |
| Armenians | 90.1 /100 | #119 | Exceptional 10.9% |
| Immigrants | Africa | 89.4 /100 | #120 | Excellent 10.9% |
| Immigrants | South Eastern Asia | 89.2 /100 | #121 | Excellent 10.9% |
| Immigrants | Ghana | 89.0 /100 | #122 | Excellent 10.9% |
| Immigrants | Czechoslovakia | 88.4 /100 | #123 | Excellent 10.9% |
| South American Indians | 88.1 /100 | #124 | Excellent 10.9% |
| Immigrants | North Macedonia | 88.1 /100 | #125 | Excellent 10.9% |
| Immigrants | Trinidad and Tobago | 86.9 /100 | #126 | Excellent 10.9% |
| Immigrants | Ukraine | 86.8 /100 | #127 | Excellent 10.9% |
| Immigrants | Latvia | 85.5 /100 | #128 | Excellent 10.9% |
| Immigrants | Philippines | 85.4 /100 | #129 | Excellent 10.9% |
| Brazilians | 85.4 /100 | #130 | Excellent 10.9% |
| Macedonians | 84.2 /100 | #131 | Excellent 11.0% |
| Immigrants | Fiji | 84.0 /100 | #132 | Excellent 11.0% |