Iraqi vs Immigrants from North Macedonia Male Disability
COMPARE
Iraqi
Immigrants from North Macedonia
Male Disability
Male Disability Comparison
Iraqis
Immigrants from North Macedonia
11.3%
MALE DISABILITY
30.5/ 100
METRIC RATING
184th/ 347
METRIC RANK
10.9%
MALE DISABILITY
88.1/ 100
METRIC RATING
125th/ 347
METRIC RANK
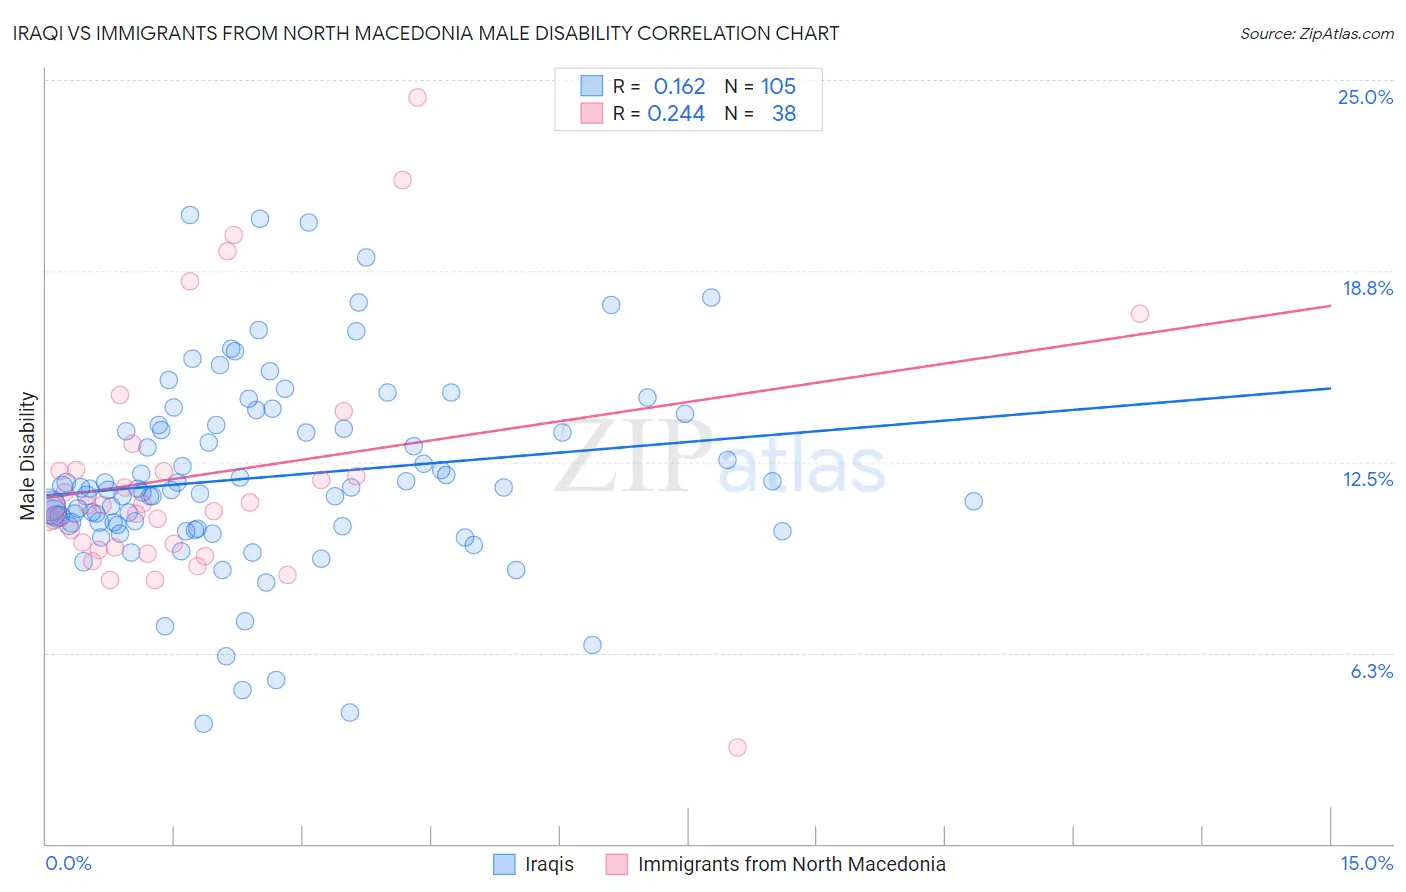
Iraqi vs Immigrants from North Macedonia Male Disability Correlation Chart
The statistical analysis conducted on geographies consisting of 170,656,152 people shows a poor positive correlation between the proportion of Iraqis and percentage of males with a disability in the United States with a correlation coefficient (R) of 0.162 and weighted average of 11.3%. Similarly, the statistical analysis conducted on geographies consisting of 74,317,186 people shows a weak positive correlation between the proportion of Immigrants from North Macedonia and percentage of males with a disability in the United States with a correlation coefficient (R) of 0.244 and weighted average of 10.9%, a difference of 4.0%.
Male Disability Correlation Summary
| Measurement | Iraqi | Immigrants from North Macedonia |
| Minimum | 3.9% | 3.1% |
| Maximum | 20.6% | 24.4% |
| Range | 16.7% | 21.3% |
| Mean | 12.0% | 12.1% |
| Median | 11.6% | 11.1% |
| Interquartile 25% (IQ1) | 10.4% | 9.7% |
| Interquartile 75% (IQ3) | 13.6% | 12.3% |
| Interquartile Range (IQR) | 3.2% | 2.6% |
| Standard Deviation (Sample) | 3.1% | 4.1% |
| Standard Deviation (Population) | 3.1% | 4.1% |
Similar Demographics by Male Disability
Demographics Similar to Iraqis by Male Disability
In terms of male disability, the demographic groups most similar to Iraqis are Pakistani (11.3%, a difference of 0.010%), Immigrants from Central America (11.3%, a difference of 0.15%), Immigrants from Zaire (11.4%, a difference of 0.19%), Immigrants from Belize (11.3%, a difference of 0.20%), and Immigrants from Austria (11.4%, a difference of 0.21%).
| Demographics | Rating | Rank | Male Disability |
| Immigrants | Norway | 44.2 /100 | #177 | Average 11.3% |
| Australians | 42.2 /100 | #178 | Average 11.3% |
| Immigrants | Caribbean | 41.4 /100 | #179 | Average 11.3% |
| Hondurans | 41.1 /100 | #180 | Average 11.3% |
| Immigrants | Senegal | 34.4 /100 | #181 | Fair 11.3% |
| Immigrants | Belize | 33.7 /100 | #182 | Fair 11.3% |
| Immigrants | Central America | 32.9 /100 | #183 | Fair 11.3% |
| Iraqis | 30.5 /100 | #184 | Fair 11.3% |
| Pakistanis | 30.3 /100 | #185 | Fair 11.3% |
| Immigrants | Zaire | 27.6 /100 | #186 | Fair 11.4% |
| Immigrants | Austria | 27.3 /100 | #187 | Fair 11.4% |
| Estonians | 26.8 /100 | #188 | Fair 11.4% |
| Immigrants | Netherlands | 25.9 /100 | #189 | Fair 11.4% |
| Immigrants | Bosnia and Herzegovina | 25.4 /100 | #190 | Fair 11.4% |
| Senegalese | 23.2 /100 | #191 | Fair 11.4% |
Demographics Similar to Immigrants from North Macedonia by Male Disability
In terms of male disability, the demographic groups most similar to Immigrants from North Macedonia are South American Indian (10.9%, a difference of 0.0%), Immigrants from Czechoslovakia (10.9%, a difference of 0.040%), Immigrants from Ghana (10.9%, a difference of 0.14%), Immigrants from South Eastern Asia (10.9%, a difference of 0.15%), and Immigrants from Trinidad and Tobago (10.9%, a difference of 0.16%).
| Demographics | Rating | Rank | Male Disability |
| Immigrants | Cuba | 90.2 /100 | #118 | Exceptional 10.9% |
| Armenians | 90.1 /100 | #119 | Exceptional 10.9% |
| Immigrants | Africa | 89.4 /100 | #120 | Excellent 10.9% |
| Immigrants | South Eastern Asia | 89.2 /100 | #121 | Excellent 10.9% |
| Immigrants | Ghana | 89.0 /100 | #122 | Excellent 10.9% |
| Immigrants | Czechoslovakia | 88.4 /100 | #123 | Excellent 10.9% |
| South American Indians | 88.1 /100 | #124 | Excellent 10.9% |
| Immigrants | North Macedonia | 88.1 /100 | #125 | Excellent 10.9% |
| Immigrants | Trinidad and Tobago | 86.9 /100 | #126 | Excellent 10.9% |
| Immigrants | Ukraine | 86.8 /100 | #127 | Excellent 10.9% |
| Immigrants | Latvia | 85.5 /100 | #128 | Excellent 10.9% |
| Immigrants | Philippines | 85.4 /100 | #129 | Excellent 10.9% |
| Brazilians | 85.4 /100 | #130 | Excellent 10.9% |
| Macedonians | 84.2 /100 | #131 | Excellent 11.0% |
| Immigrants | Fiji | 84.0 /100 | #132 | Excellent 11.0% |