Israeli vs Immigrants from Bahamas Hearing Disability
COMPARE
Israeli
Immigrants from Bahamas
Hearing Disability
Hearing Disability Comparison
Israelis
Immigrants from Bahamas
2.8%
HEARING DISABILITY
95.9/ 100
METRIC RATING
95th/ 347
METRIC RANK
2.9%
HEARING DISABILITY
80.9/ 100
METRIC RATING
143rd/ 347
METRIC RANK
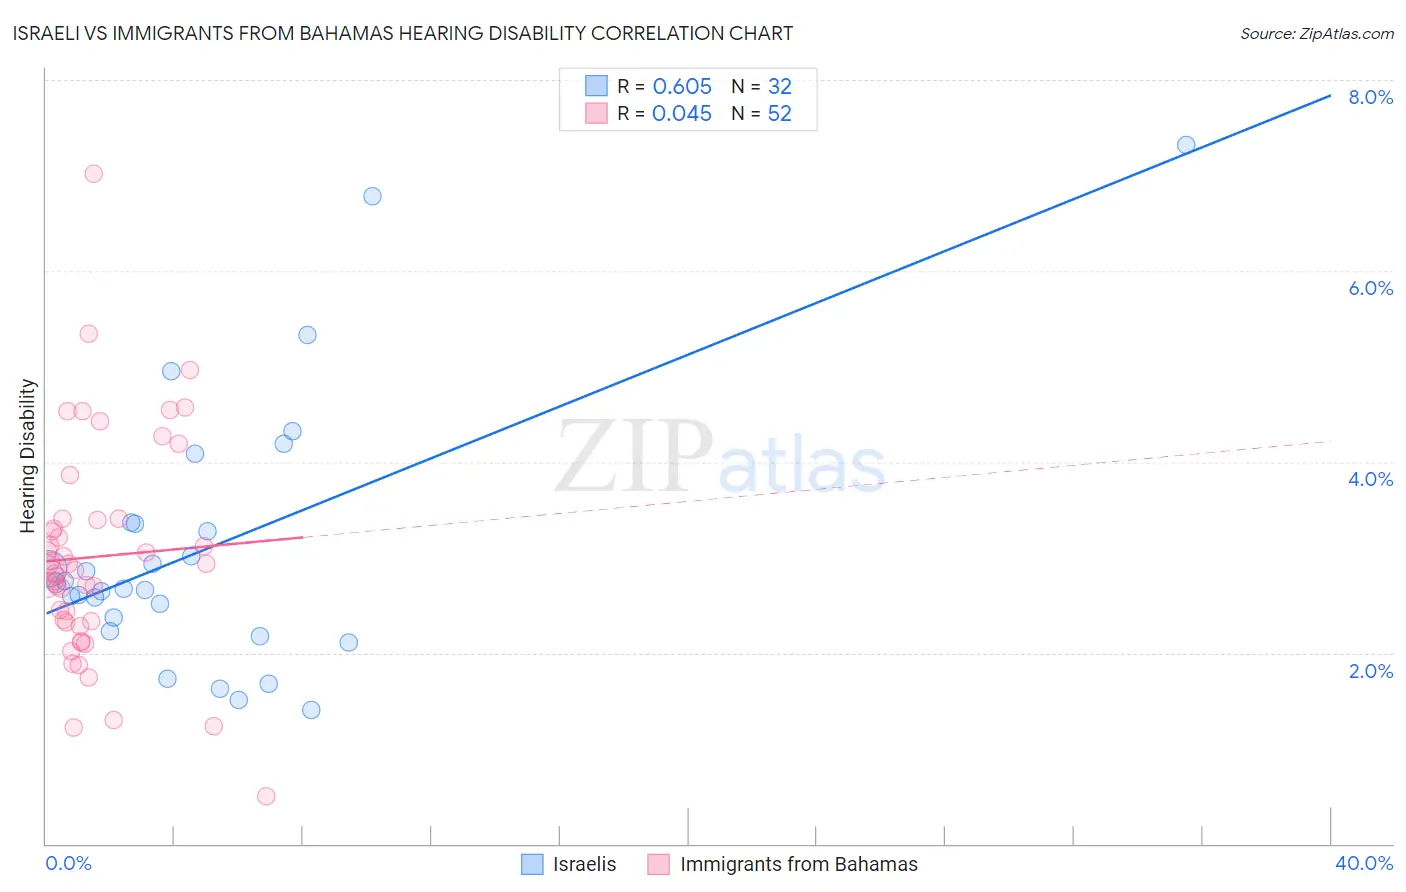
Israeli vs Immigrants from Bahamas Hearing Disability Correlation Chart
The statistical analysis conducted on geographies consisting of 211,123,306 people shows a significant positive correlation between the proportion of Israelis and percentage of population with hearing disability in the United States with a correlation coefficient (R) of 0.605 and weighted average of 2.8%. Similarly, the statistical analysis conducted on geographies consisting of 104,634,972 people shows no correlation between the proportion of Immigrants from Bahamas and percentage of population with hearing disability in the United States with a correlation coefficient (R) of 0.045 and weighted average of 2.9%, a difference of 4.3%.
Hearing Disability Correlation Summary
| Measurement | Israeli | Immigrants from Bahamas |
| Minimum | 1.4% | 0.49% |
| Maximum | 7.3% | 7.0% |
| Range | 5.9% | 6.5% |
| Mean | 3.1% | 3.0% |
| Median | 2.7% | 2.9% |
| Interquartile 25% (IQ1) | 2.3% | 2.3% |
| Interquartile 75% (IQ3) | 3.4% | 3.4% |
| Interquartile Range (IQR) | 1.1% | 1.1% |
| Standard Deviation (Sample) | 1.4% | 1.2% |
| Standard Deviation (Population) | 1.4% | 1.1% |
Similar Demographics by Hearing Disability
Demographics Similar to Israelis by Hearing Disability
In terms of hearing disability, the demographic groups most similar to Israelis are Uruguayan (2.8%, a difference of 0.020%), Immigrants from Somalia (2.8%, a difference of 0.19%), Immigrants from Kuwait (2.8%, a difference of 0.29%), Immigrants from Afghanistan (2.8%, a difference of 0.36%), and Iranian (2.8%, a difference of 0.41%).
| Demographics | Rating | Rank | Hearing Disability |
| Immigrants | Turkey | 96.7 /100 | #88 | Exceptional 2.8% |
| Belizeans | 96.6 /100 | #89 | Exceptional 2.8% |
| Immigrants | Morocco | 96.6 /100 | #90 | Exceptional 2.8% |
| Immigrants | Middle Africa | 96.5 /100 | #91 | Exceptional 2.8% |
| Iranians | 96.4 /100 | #92 | Exceptional 2.8% |
| Immigrants | Kuwait | 96.3 /100 | #93 | Exceptional 2.8% |
| Uruguayans | 95.9 /100 | #94 | Exceptional 2.8% |
| Israelis | 95.9 /100 | #95 | Exceptional 2.8% |
| Immigrants | Somalia | 95.5 /100 | #96 | Exceptional 2.8% |
| Immigrants | Afghanistan | 95.3 /100 | #97 | Exceptional 2.8% |
| Immigrants | Honduras | 95.1 /100 | #98 | Exceptional 2.8% |
| Immigrants | Guatemala | 95.1 /100 | #99 | Exceptional 2.8% |
| Immigrants | Eastern Africa | 95.0 /100 | #100 | Exceptional 2.8% |
| Immigrants | Spain | 94.9 /100 | #101 | Exceptional 2.8% |
| Taiwanese | 94.8 /100 | #102 | Exceptional 2.8% |
Demographics Similar to Immigrants from Bahamas by Hearing Disability
In terms of hearing disability, the demographic groups most similar to Immigrants from Bahamas are Laotian (2.9%, a difference of 0.020%), Immigrants from Bulgaria (2.9%, a difference of 0.27%), Immigrants from Congo (2.9%, a difference of 0.31%), Brazilian (2.9%, a difference of 0.33%), and Tongan (2.9%, a difference of 0.35%).
| Demographics | Rating | Rank | Hearing Disability |
| Immigrants | Brazil | 84.6 /100 | #136 | Excellent 2.9% |
| Sri Lankans | 84.1 /100 | #137 | Excellent 2.9% |
| Immigrants | Costa Rica | 84.0 /100 | #138 | Excellent 2.9% |
| Bermudans | 83.8 /100 | #139 | Excellent 2.9% |
| Immigrants | Jordan | 83.7 /100 | #140 | Excellent 2.9% |
| Sub-Saharan Africans | 83.3 /100 | #141 | Excellent 2.9% |
| Laotians | 81.1 /100 | #142 | Excellent 2.9% |
| Immigrants | Bahamas | 80.9 /100 | #143 | Excellent 2.9% |
| Immigrants | Bulgaria | 79.2 /100 | #144 | Good 2.9% |
| Immigrants | Congo | 78.9 /100 | #145 | Good 2.9% |
| Brazilians | 78.7 /100 | #146 | Good 2.9% |
| Tongans | 78.6 /100 | #147 | Good 2.9% |
| Immigrants | Russia | 77.7 /100 | #148 | Good 2.9% |
| Immigrants | Panama | 76.9 /100 | #149 | Good 2.9% |
| Palestinians | 73.6 /100 | #150 | Good 2.9% |