Albanian vs Immigrants from Bahamas Bachelor's Degree
COMPARE
Albanian
Immigrants from Bahamas
Bachelor's Degree
Bachelor's Degree Comparison
Albanians
Immigrants from Bahamas
40.9%
BACHELOR'S DEGREE
96.5/ 100
METRIC RATING
110th/ 347
METRIC RANK
33.3%
BACHELOR'S DEGREE
0.7/ 100
METRIC RATING
252nd/ 347
METRIC RANK
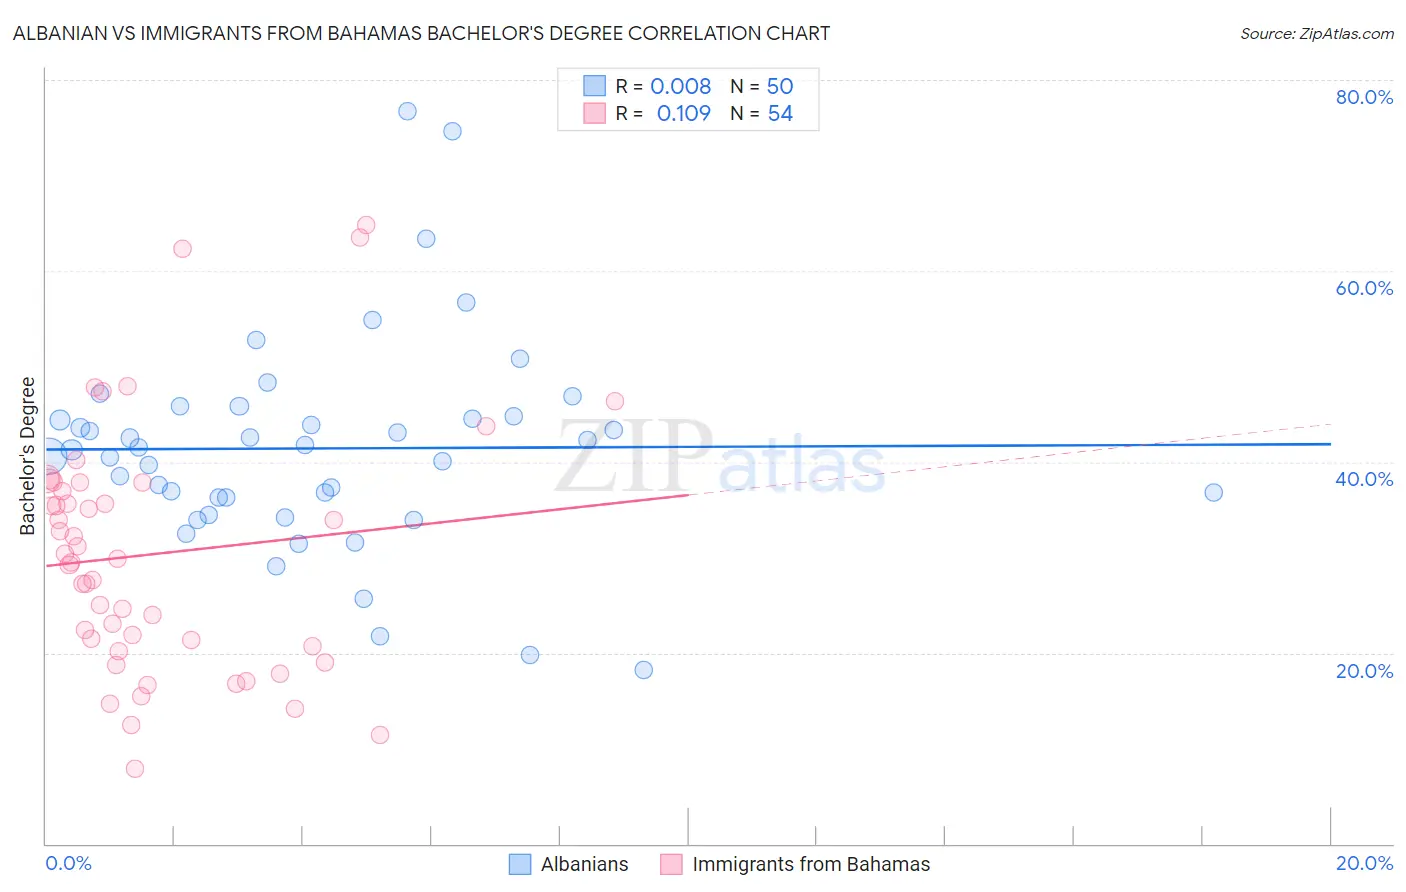
Albanian vs Immigrants from Bahamas Bachelor's Degree Correlation Chart
The statistical analysis conducted on geographies consisting of 193,245,507 people shows no correlation between the proportion of Albanians and percentage of population with at least bachelor's degree education in the United States with a correlation coefficient (R) of 0.008 and weighted average of 40.9%. Similarly, the statistical analysis conducted on geographies consisting of 104,662,355 people shows a poor positive correlation between the proportion of Immigrants from Bahamas and percentage of population with at least bachelor's degree education in the United States with a correlation coefficient (R) of 0.109 and weighted average of 33.3%, a difference of 22.7%.
Bachelor's Degree Correlation Summary
| Measurement | Albanian | Immigrants from Bahamas |
| Minimum | 18.2% | 7.9% |
| Maximum | 76.7% | 64.8% |
| Range | 58.4% | 56.9% |
| Mean | 41.4% | 30.4% |
| Median | 41.4% | 29.6% |
| Interquartile 25% (IQ1) | 36.3% | 20.7% |
| Interquartile 75% (IQ3) | 44.8% | 37.8% |
| Interquartile Range (IQR) | 8.5% | 17.1% |
| Standard Deviation (Sample) | 11.2% | 12.9% |
| Standard Deviation (Population) | 11.1% | 12.8% |
Similar Demographics by Bachelor's Degree
Demographics Similar to Albanians by Bachelor's Degree
In terms of bachelor's degree, the demographic groups most similar to Albanians are Immigrants from Chile (40.8%, a difference of 0.050%), Arab (40.9%, a difference of 0.080%), Ukrainian (40.9%, a difference of 0.090%), Ugandan (40.8%, a difference of 0.090%), and Brazilian (40.8%, a difference of 0.14%).
| Demographics | Rating | Rank | Bachelor's Degree |
| Chileans | 97.5 /100 | #103 | Exceptional 41.2% |
| Jordanians | 97.4 /100 | #104 | Exceptional 41.2% |
| Syrians | 97.4 /100 | #105 | Exceptional 41.1% |
| Alsatians | 97.0 /100 | #106 | Exceptional 41.0% |
| Northern Europeans | 96.8 /100 | #107 | Exceptional 41.0% |
| Ukrainians | 96.6 /100 | #108 | Exceptional 40.9% |
| Arabs | 96.6 /100 | #109 | Exceptional 40.9% |
| Albanians | 96.5 /100 | #110 | Exceptional 40.9% |
| Immigrants | Chile | 96.4 /100 | #111 | Exceptional 40.8% |
| Ugandans | 96.3 /100 | #112 | Exceptional 40.8% |
| Brazilians | 96.3 /100 | #113 | Exceptional 40.8% |
| Afghans | 96.2 /100 | #114 | Exceptional 40.8% |
| Palestinians | 95.8 /100 | #115 | Exceptional 40.7% |
| Immigrants | Uganda | 95.7 /100 | #116 | Exceptional 40.7% |
| Austrians | 95.5 /100 | #117 | Exceptional 40.6% |
Demographics Similar to Immigrants from Bahamas by Bachelor's Degree
In terms of bachelor's degree, the demographic groups most similar to Immigrants from Bahamas are Japanese (33.3%, a difference of 0.070%), U.S. Virgin Islander (33.2%, a difference of 0.21%), Native Hawaiian (33.2%, a difference of 0.27%), Iroquois (33.2%, a difference of 0.28%), and Nicaraguan (33.1%, a difference of 0.47%).
| Demographics | Rating | Rank | Bachelor's Degree |
| Immigrants | Fiji | 1.2 /100 | #245 | Tragic 33.7% |
| Jamaicans | 1.0 /100 | #246 | Tragic 33.6% |
| Immigrants | Congo | 1.0 /100 | #247 | Tragic 33.6% |
| Cree | 1.0 /100 | #248 | Tragic 33.6% |
| Immigrants | Liberia | 0.9 /100 | #249 | Tragic 33.5% |
| Indonesians | 0.9 /100 | #250 | Tragic 33.5% |
| Japanese | 0.7 /100 | #251 | Tragic 33.3% |
| Immigrants | Bahamas | 0.7 /100 | #252 | Tragic 33.3% |
| U.S. Virgin Islanders | 0.7 /100 | #253 | Tragic 33.2% |
| Native Hawaiians | 0.7 /100 | #254 | Tragic 33.2% |
| Iroquois | 0.7 /100 | #255 | Tragic 33.2% |
| Nicaraguans | 0.6 /100 | #256 | Tragic 33.1% |
| Spanish Americans | 0.6 /100 | #257 | Tragic 33.1% |
| French American Indians | 0.6 /100 | #258 | Tragic 33.1% |
| Osage | 0.5 /100 | #259 | Tragic 33.0% |