Alaskan Athabascan vs Lithuanian Unemployment Among Seniors over 65 years
COMPARE
Alaskan Athabascan
Lithuanian
Unemployment Among Seniors over 65 years
Unemployment Among Seniors over 65 years Comparison
Alaskan Athabascans
Lithuanians
7.0%
UNEMPLOYMENT AMONG SENIORS OVER 65 YEARS
0.0/ 100
METRIC RATING
344th/ 347
METRIC RANK
5.1%
UNEMPLOYMENT AMONG SENIORS OVER 65 YEARS
58.2/ 100
METRIC RATING
169th/ 347
METRIC RANK
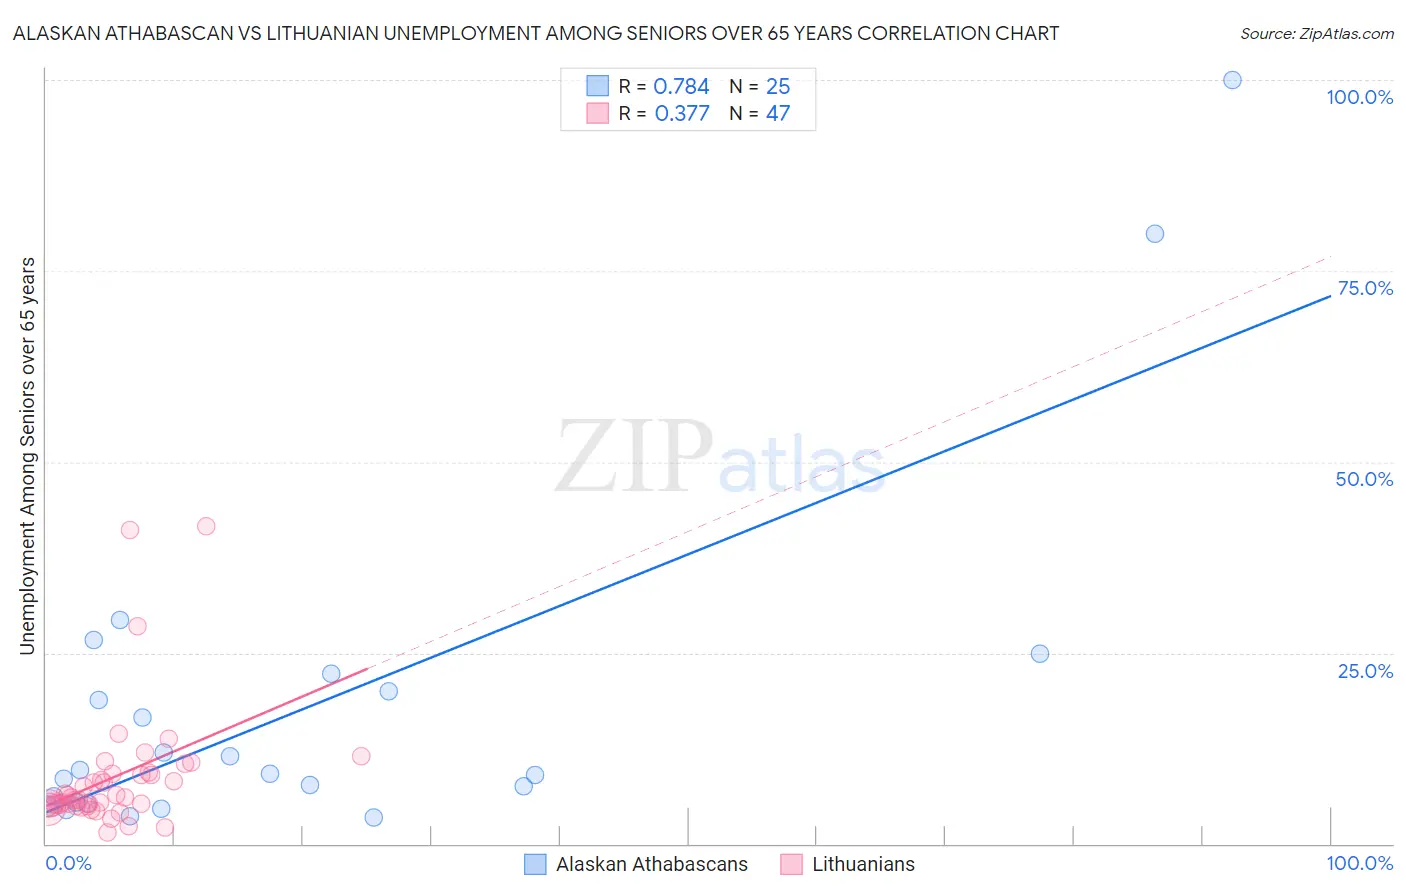
Alaskan Athabascan vs Lithuanian Unemployment Among Seniors over 65 years Correlation Chart
The statistical analysis conducted on geographies consisting of 44,116,307 people shows a strong positive correlation between the proportion of Alaskan Athabascans and unemployment rate amomg seniors over the age of 65 in the United States with a correlation coefficient (R) of 0.784 and weighted average of 7.0%. Similarly, the statistical analysis conducted on geographies consisting of 374,267,486 people shows a mild positive correlation between the proportion of Lithuanians and unemployment rate amomg seniors over the age of 65 in the United States with a correlation coefficient (R) of 0.377 and weighted average of 5.1%, a difference of 37.2%.
Unemployment Among Seniors over 65 years Correlation Summary
| Measurement | Alaskan Athabascan | Lithuanian |
| Minimum | 3.5% | 1.5% |
| Maximum | 100.0% | 41.5% |
| Range | 96.5% | 40.0% |
| Mean | 18.1% | 8.7% |
| Median | 9.2% | 6.0% |
| Interquartile 25% (IQ1) | 5.3% | 4.9% |
| Interquartile 75% (IQ3) | 21.1% | 9.2% |
| Interquartile Range (IQR) | 15.9% | 4.3% |
| Standard Deviation (Sample) | 23.1% | 8.1% |
| Standard Deviation (Population) | 22.7% | 8.1% |
Similar Demographics by Unemployment Among Seniors over 65 years
Demographics Similar to Alaskan Athabascans by Unemployment Among Seniors over 65 years
In terms of unemployment among seniors over 65 years, the demographic groups most similar to Alaskan Athabascans are Tlingit-Haida (6.8%, a difference of 3.8%), Navajo (6.7%, a difference of 5.1%), Yakama (6.7%, a difference of 5.6%), Ute (6.3%, a difference of 11.3%), and Paiute (6.3%, a difference of 11.3%).
| Demographics | Rating | Rank | Unemployment Among Seniors over 65 years |
| Immigrants | Dominican Republic | 0.0 /100 | #333 | Tragic 6.0% |
| Tohono O'odham | 0.0 /100 | #334 | Tragic 6.1% |
| Immigrants | Armenia | 0.0 /100 | #335 | Tragic 6.2% |
| Pima | 0.0 /100 | #336 | Tragic 6.3% |
| Alaska Natives | 0.0 /100 | #337 | Tragic 6.3% |
| Immigrants | Azores | 0.0 /100 | #338 | Tragic 6.3% |
| Paiute | 0.0 /100 | #339 | Tragic 6.3% |
| Ute | 0.0 /100 | #340 | Tragic 6.3% |
| Yakama | 0.0 /100 | #341 | Tragic 6.7% |
| Navajo | 0.0 /100 | #342 | Tragic 6.7% |
| Tlingit-Haida | 0.0 /100 | #343 | Tragic 6.8% |
| Alaskan Athabascans | 0.0 /100 | #344 | Tragic 7.0% |
| Immigrants | Yemen | 0.0 /100 | #345 | Tragic 8.2% |
| Yup'ik | 0.0 /100 | #346 | Tragic 9.1% |
| Crow | 0.0 /100 | #347 | Tragic 16.9% |
Demographics Similar to Lithuanians by Unemployment Among Seniors over 65 years
In terms of unemployment among seniors over 65 years, the demographic groups most similar to Lithuanians are Mongolian (5.1%, a difference of 0.050%), Immigrants from Western Europe (5.1%, a difference of 0.070%), Immigrants from Eastern Asia (5.1%, a difference of 0.11%), Nonimmigrants (5.1%, a difference of 0.13%), and Immigrants from Ireland (5.1%, a difference of 0.16%).
| Demographics | Rating | Rank | Unemployment Among Seniors over 65 years |
| Immigrants | South Eastern Asia | 65.6 /100 | #162 | Good 5.1% |
| Potawatomi | 64.5 /100 | #163 | Good 5.1% |
| Nepalese | 64.5 /100 | #164 | Good 5.1% |
| Immigrants | Ukraine | 64.2 /100 | #165 | Good 5.1% |
| Immigrants | Laos | 63.8 /100 | #166 | Good 5.1% |
| Immigrants | Western Europe | 60.4 /100 | #167 | Good 5.1% |
| Mongolians | 59.8 /100 | #168 | Average 5.1% |
| Lithuanians | 58.2 /100 | #169 | Average 5.1% |
| Immigrants | Eastern Asia | 54.9 /100 | #170 | Average 5.1% |
| Immigrants | Nonimmigrants | 54.1 /100 | #171 | Average 5.1% |
| Immigrants | Ireland | 53.2 /100 | #172 | Average 5.1% |
| Immigrants | Spain | 51.7 /100 | #173 | Average 5.1% |
| Spanish Americans | 50.0 /100 | #174 | Average 5.1% |
| Immigrants | Eastern Europe | 49.8 /100 | #175 | Average 5.1% |
| Indians (Asian) | 46.6 /100 | #176 | Average 5.2% |