Alaskan Athabascan vs Immigrants from Hong Kong Vision Disability
COMPARE
Alaskan Athabascan
Immigrants from Hong Kong
Vision Disability
Vision Disability Comparison
Alaskan Athabascans
Immigrants from Hong Kong
3.1%
VISION DISABILITY
0.0/ 100
METRIC RATING
336th/ 347
METRIC RANK
1.8%
VISION DISABILITY
100.0/ 100
METRIC RATING
10th/ 347
METRIC RANK
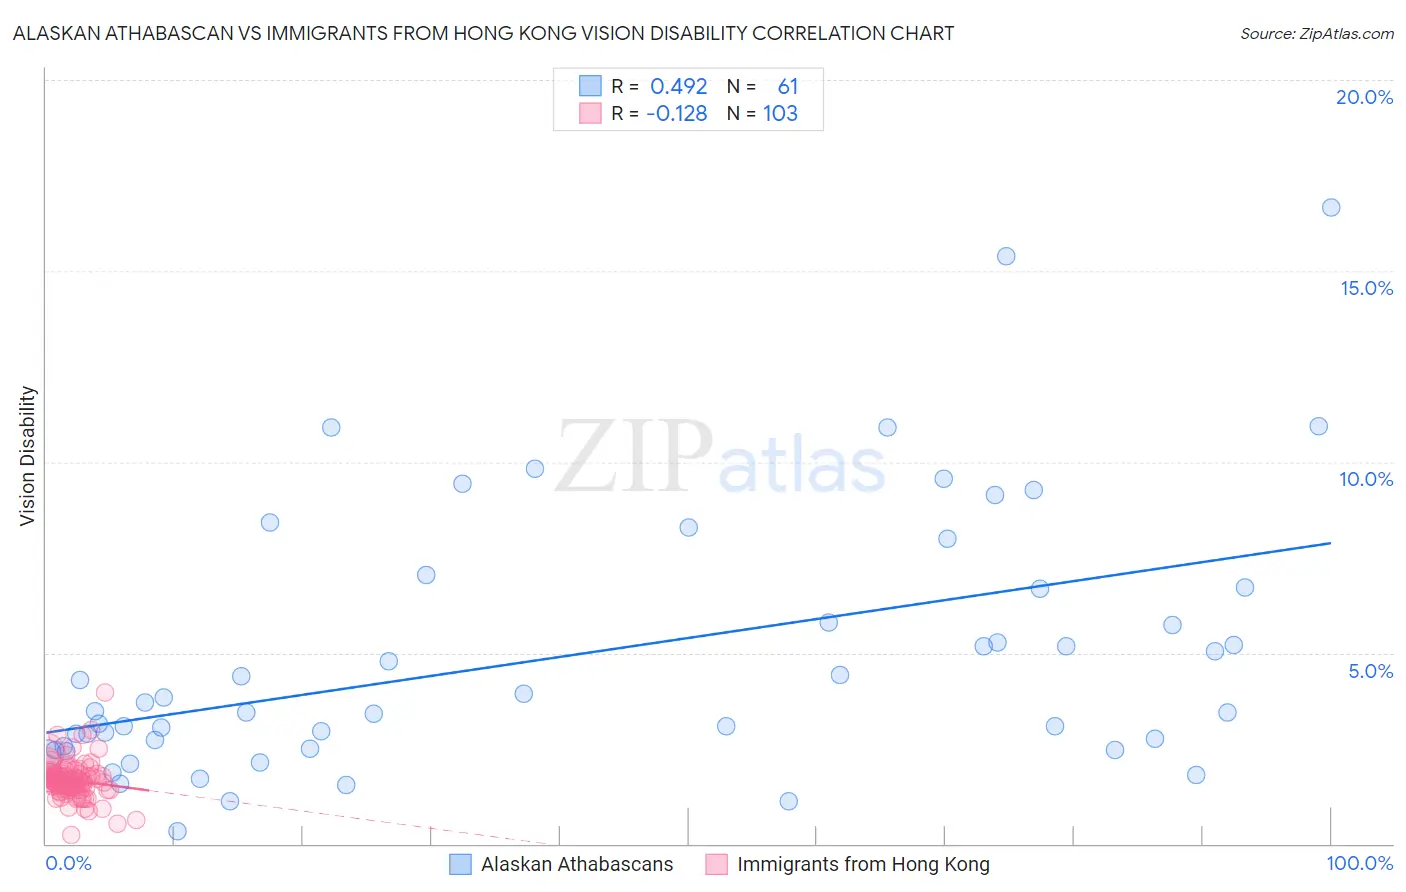
Alaskan Athabascan vs Immigrants from Hong Kong Vision Disability Correlation Chart
The statistical analysis conducted on geographies consisting of 45,813,116 people shows a moderate positive correlation between the proportion of Alaskan Athabascans and percentage of population with vision disability in the United States with a correlation coefficient (R) of 0.492 and weighted average of 3.1%. Similarly, the statistical analysis conducted on geographies consisting of 253,892,306 people shows a poor negative correlation between the proportion of Immigrants from Hong Kong and percentage of population with vision disability in the United States with a correlation coefficient (R) of -0.128 and weighted average of 1.8%, a difference of 74.5%.
Vision Disability Correlation Summary
| Measurement | Alaskan Athabascan | Immigrants from Hong Kong |
| Minimum | 0.32% | 0.24% |
| Maximum | 16.7% | 4.0% |
| Range | 16.4% | 3.7% |
| Mean | 4.9% | 1.7% |
| Median | 3.5% | 1.7% |
| Interquartile 25% (IQ1) | 2.5% | 1.5% |
| Interquartile 75% (IQ3) | 6.7% | 1.8% |
| Interquartile Range (IQR) | 4.2% | 0.35% |
| Standard Deviation (Sample) | 3.4% | 0.48% |
| Standard Deviation (Population) | 3.4% | 0.48% |
Similar Demographics by Vision Disability
Demographics Similar to Alaskan Athabascans by Vision Disability
In terms of vision disability, the demographic groups most similar to Alaskan Athabascans are Dutch West Indian (3.2%, a difference of 0.030%), Navajo (3.1%, a difference of 0.16%), Chickasaw (3.2%, a difference of 0.93%), Tsimshian (3.2%, a difference of 1.6%), and Creek (3.2%, a difference of 1.8%).
| Demographics | Rating | Rank | Vision Disability |
| Apache | 0.0 /100 | #329 | Tragic 3.0% |
| Colville | 0.0 /100 | #330 | Tragic 3.0% |
| Central American Indians | 0.0 /100 | #331 | Tragic 3.0% |
| Seminole | 0.0 /100 | #332 | Tragic 3.1% |
| Cajuns | 0.0 /100 | #333 | Tragic 3.1% |
| Cheyenne | 0.0 /100 | #334 | Tragic 3.1% |
| Navajo | 0.0 /100 | #335 | Tragic 3.1% |
| Alaskan Athabascans | 0.0 /100 | #336 | Tragic 3.1% |
| Dutch West Indians | 0.0 /100 | #337 | Tragic 3.2% |
| Chickasaw | 0.0 /100 | #338 | Tragic 3.2% |
| Tsimshian | 0.0 /100 | #339 | Tragic 3.2% |
| Creek | 0.0 /100 | #340 | Tragic 3.2% |
| Kiowa | 0.0 /100 | #341 | Tragic 3.3% |
| Choctaw | 0.0 /100 | #342 | Tragic 3.3% |
| Pima | 0.0 /100 | #343 | Tragic 3.3% |
Demographics Similar to Immigrants from Hong Kong by Vision Disability
In terms of vision disability, the demographic groups most similar to Immigrants from Hong Kong are Immigrants from Singapore (1.8%, a difference of 0.19%), Iranian (1.8%, a difference of 0.93%), Immigrants from South Central Asia (1.8%, a difference of 1.1%), Immigrants from Israel (1.8%, a difference of 1.1%), and Immigrants from Iran (1.8%, a difference of 1.1%).
| Demographics | Rating | Rank | Vision Disability |
| Immigrants | Taiwan | 100.0 /100 | #3 | Exceptional 1.7% |
| Thais | 100.0 /100 | #4 | Exceptional 1.7% |
| Okinawans | 100.0 /100 | #5 | Exceptional 1.8% |
| Immigrants | Iran | 100.0 /100 | #6 | Exceptional 1.8% |
| Immigrants | South Central Asia | 100.0 /100 | #7 | Exceptional 1.8% |
| Iranians | 100.0 /100 | #8 | Exceptional 1.8% |
| Immigrants | Singapore | 100.0 /100 | #9 | Exceptional 1.8% |
| Immigrants | Hong Kong | 100.0 /100 | #10 | Exceptional 1.8% |
| Immigrants | Israel | 100.0 /100 | #11 | Exceptional 1.8% |
| Immigrants | Korea | 100.0 /100 | #12 | Exceptional 1.8% |
| Immigrants | Eastern Asia | 100.0 /100 | #13 | Exceptional 1.8% |
| Immigrants | China | 100.0 /100 | #14 | Exceptional 1.8% |
| Immigrants | Bolivia | 100.0 /100 | #15 | Exceptional 1.8% |
| Indians (Asian) | 100.0 /100 | #16 | Exceptional 1.8% |
| Burmese | 100.0 /100 | #17 | Exceptional 1.8% |