Alaskan Athabascan vs Immigrants from Hong Kong Seniors Poverty Over the Age of 75
COMPARE
Alaskan Athabascan
Immigrants from Hong Kong
Seniors Poverty Over the Age of 75
Seniors Poverty Over the Age of 75 Comparison
Alaskan Athabascans
Immigrants from Hong Kong
13.4%
SENIORS POVERTY OVER THE AGE OF 75
0.8/ 100
METRIC RATING
237th/ 347
METRIC RANK
12.8%
SENIORS POVERTY OVER THE AGE OF 75
6.5/ 100
METRIC RATING
212th/ 347
METRIC RANK
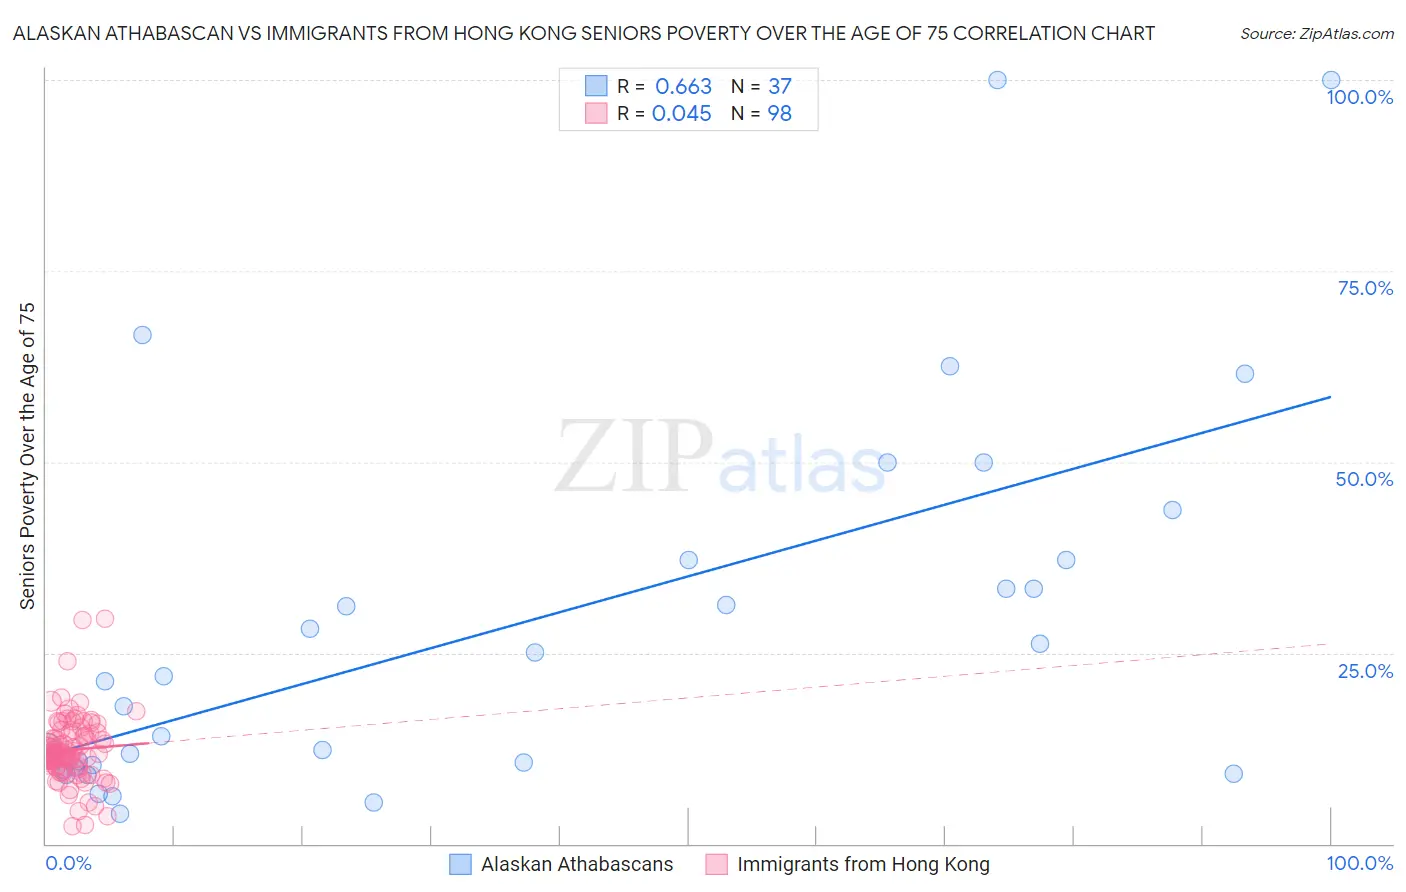
Alaskan Athabascan vs Immigrants from Hong Kong Seniors Poverty Over the Age of 75 Correlation Chart
The statistical analysis conducted on geographies consisting of 45,512,640 people shows a significant positive correlation between the proportion of Alaskan Athabascans and poverty level among seniors over the age of 75 in the United States with a correlation coefficient (R) of 0.663 and weighted average of 13.4%. Similarly, the statistical analysis conducted on geographies consisting of 252,162,249 people shows no correlation between the proportion of Immigrants from Hong Kong and poverty level among seniors over the age of 75 in the United States with a correlation coefficient (R) of 0.045 and weighted average of 12.8%, a difference of 4.0%.
Seniors Poverty Over the Age of 75 Correlation Summary
| Measurement | Alaskan Athabascan | Immigrants from Hong Kong |
| Minimum | 3.9% | 2.3% |
| Maximum | 100.0% | 29.4% |
| Range | 96.1% | 27.1% |
| Mean | 28.1% | 12.3% |
| Median | 21.2% | 11.8% |
| Interquartile 25% (IQ1) | 10.2% | 10.1% |
| Interquartile 75% (IQ3) | 37.1% | 14.5% |
| Interquartile Range (IQR) | 27.0% | 4.4% |
| Standard Deviation (Sample) | 24.6% | 4.4% |
| Standard Deviation (Population) | 24.2% | 4.4% |
Similar Demographics by Seniors Poverty Over the Age of 75
Demographics Similar to Alaskan Athabascans by Seniors Poverty Over the Age of 75
In terms of seniors poverty over the age of 75, the demographic groups most similar to Alaskan Athabascans are Peruvian (13.4%, a difference of 0.020%), Panamanian (13.4%, a difference of 0.12%), Moroccan (13.3%, a difference of 0.18%), Japanese (13.3%, a difference of 0.19%), and Argentinean (13.4%, a difference of 0.42%).
| Demographics | Rating | Rank | Seniors Poverty Over the Age of 75 |
| Immigrants | China | 1.5 /100 | #230 | Tragic 13.2% |
| Sub-Saharan Africans | 1.5 /100 | #231 | Tragic 13.2% |
| Immigrants | Chile | 1.3 /100 | #232 | Tragic 13.3% |
| Immigrants | Costa Rica | 1.3 /100 | #233 | Tragic 13.3% |
| Immigrants | Israel | 1.1 /100 | #234 | Tragic 13.3% |
| Japanese | 0.9 /100 | #235 | Tragic 13.3% |
| Moroccans | 0.9 /100 | #236 | Tragic 13.3% |
| Alaskan Athabascans | 0.8 /100 | #237 | Tragic 13.4% |
| Peruvians | 0.8 /100 | #238 | Tragic 13.4% |
| Panamanians | 0.8 /100 | #239 | Tragic 13.4% |
| Argentineans | 0.7 /100 | #240 | Tragic 13.4% |
| Immigrants | Russia | 0.6 /100 | #241 | Tragic 13.4% |
| Immigrants | Somalia | 0.6 /100 | #242 | Tragic 13.5% |
| Dutch West Indians | 0.6 /100 | #243 | Tragic 13.5% |
| Spanish Americans | 0.5 /100 | #244 | Tragic 13.5% |
Demographics Similar to Immigrants from Hong Kong by Seniors Poverty Over the Age of 75
In terms of seniors poverty over the age of 75, the demographic groups most similar to Immigrants from Hong Kong are Brazilian (12.8%, a difference of 0.13%), Comanche (12.8%, a difference of 0.15%), French American Indian (12.9%, a difference of 0.15%), Immigrants from Africa (12.9%, a difference of 0.22%), and Immigrants from Liberia (12.8%, a difference of 0.25%).
| Demographics | Rating | Rank | Seniors Poverty Over the Age of 75 |
| Indians (Asian) | 9.7 /100 | #205 | Tragic 12.7% |
| Albanians | 9.6 /100 | #206 | Tragic 12.7% |
| Costa Ricans | 8.7 /100 | #207 | Tragic 12.8% |
| Immigrants | Eastern Asia | 8.4 /100 | #208 | Tragic 12.8% |
| Immigrants | Liberia | 7.3 /100 | #209 | Tragic 12.8% |
| Comanche | 7.0 /100 | #210 | Tragic 12.8% |
| Brazilians | 6.9 /100 | #211 | Tragic 12.8% |
| Immigrants | Hong Kong | 6.5 /100 | #212 | Tragic 12.8% |
| French American Indians | 6.1 /100 | #213 | Tragic 12.9% |
| Immigrants | Africa | 5.9 /100 | #214 | Tragic 12.9% |
| South American Indians | 5.5 /100 | #215 | Tragic 12.9% |
| Immigrants | Brazil | 5.2 /100 | #216 | Tragic 12.9% |
| Bermudans | 4.9 /100 | #217 | Tragic 12.9% |
| Immigrants | Western Asia | 4.9 /100 | #218 | Tragic 12.9% |
| Ute | 4.7 /100 | #219 | Tragic 12.9% |