Syrian vs Immigrants from Hong Kong Vision Disability
COMPARE
Syrian
Immigrants from Hong Kong
Vision Disability
Vision Disability Comparison
Syrians
Immigrants from Hong Kong
2.1%
VISION DISABILITY
87.5/ 100
METRIC RATING
133rd/ 347
METRIC RANK
1.8%
VISION DISABILITY
100.0/ 100
METRIC RATING
10th/ 347
METRIC RANK
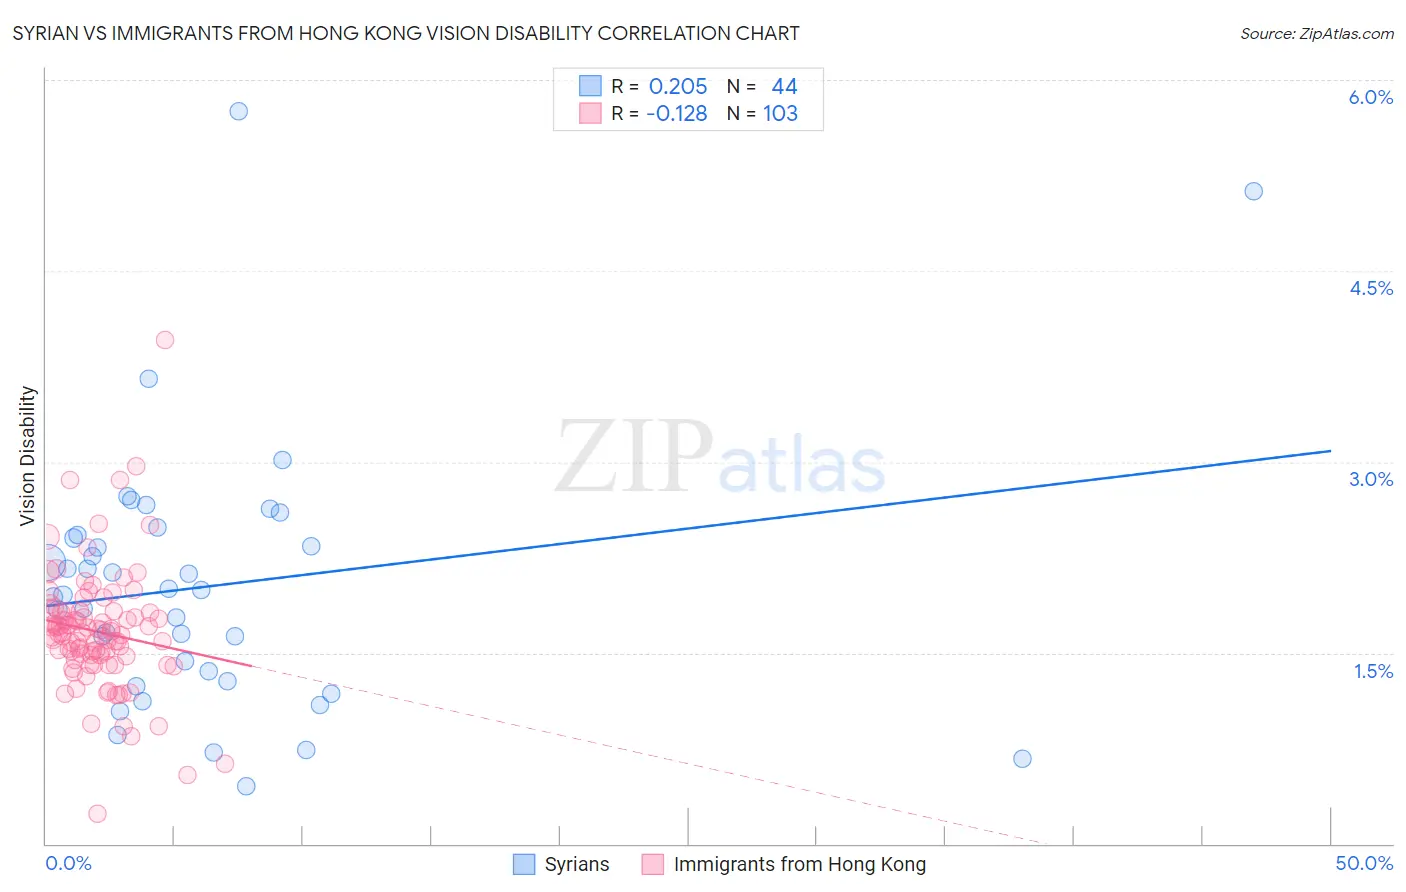
Syrian vs Immigrants from Hong Kong Vision Disability Correlation Chart
The statistical analysis conducted on geographies consisting of 266,224,532 people shows a weak positive correlation between the proportion of Syrians and percentage of population with vision disability in the United States with a correlation coefficient (R) of 0.205 and weighted average of 2.1%. Similarly, the statistical analysis conducted on geographies consisting of 253,892,306 people shows a poor negative correlation between the proportion of Immigrants from Hong Kong and percentage of population with vision disability in the United States with a correlation coefficient (R) of -0.128 and weighted average of 1.8%, a difference of 16.3%.
Vision Disability Correlation Summary
| Measurement | Syrian | Immigrants from Hong Kong |
| Minimum | 0.46% | 0.24% |
| Maximum | 5.8% | 4.0% |
| Range | 5.3% | 3.7% |
| Mean | 2.0% | 1.7% |
| Median | 2.0% | 1.7% |
| Interquartile 25% (IQ1) | 1.3% | 1.5% |
| Interquartile 75% (IQ3) | 2.4% | 1.8% |
| Interquartile Range (IQR) | 1.1% | 0.35% |
| Standard Deviation (Sample) | 1.0% | 0.48% |
| Standard Deviation (Population) | 1.0% | 0.48% |
Similar Demographics by Vision Disability
Demographics Similar to Syrians by Vision Disability
In terms of vision disability, the demographic groups most similar to Syrians are Venezuelan (2.1%, a difference of 0.050%), New Zealander (2.1%, a difference of 0.10%), Vietnamese (2.1%, a difference of 0.12%), Immigrants from Hungary (2.1%, a difference of 0.17%), and Czech (2.1%, a difference of 0.17%).
| Demographics | Rating | Rank | Vision Disability |
| Immigrants | Peru | 89.5 /100 | #126 | Excellent 2.1% |
| Sudanese | 89.2 /100 | #127 | Excellent 2.1% |
| Immigrants | Chile | 89.0 /100 | #128 | Excellent 2.1% |
| Immigrants | Cameroon | 88.8 /100 | #129 | Excellent 2.1% |
| Immigrants | Kenya | 88.7 /100 | #130 | Excellent 2.1% |
| Immigrants | Hungary | 88.7 /100 | #131 | Excellent 2.1% |
| New Zealanders | 88.2 /100 | #132 | Excellent 2.1% |
| Syrians | 87.5 /100 | #133 | Excellent 2.1% |
| Venezuelans | 87.2 /100 | #134 | Excellent 2.1% |
| Vietnamese | 86.7 /100 | #135 | Excellent 2.1% |
| Czechs | 86.3 /100 | #136 | Excellent 2.1% |
| Immigrants | South Eastern Asia | 86.3 /100 | #137 | Excellent 2.1% |
| Arabs | 86.3 /100 | #138 | Excellent 2.1% |
| Immigrants | Morocco | 85.2 /100 | #139 | Excellent 2.1% |
| Immigrants | Netherlands | 84.2 /100 | #140 | Excellent 2.1% |
Demographics Similar to Immigrants from Hong Kong by Vision Disability
In terms of vision disability, the demographic groups most similar to Immigrants from Hong Kong are Immigrants from Singapore (1.8%, a difference of 0.19%), Iranian (1.8%, a difference of 0.93%), Immigrants from South Central Asia (1.8%, a difference of 1.1%), Immigrants from Israel (1.8%, a difference of 1.1%), and Immigrants from Iran (1.8%, a difference of 1.1%).
| Demographics | Rating | Rank | Vision Disability |
| Immigrants | Taiwan | 100.0 /100 | #3 | Exceptional 1.7% |
| Thais | 100.0 /100 | #4 | Exceptional 1.7% |
| Okinawans | 100.0 /100 | #5 | Exceptional 1.8% |
| Immigrants | Iran | 100.0 /100 | #6 | Exceptional 1.8% |
| Immigrants | South Central Asia | 100.0 /100 | #7 | Exceptional 1.8% |
| Iranians | 100.0 /100 | #8 | Exceptional 1.8% |
| Immigrants | Singapore | 100.0 /100 | #9 | Exceptional 1.8% |
| Immigrants | Hong Kong | 100.0 /100 | #10 | Exceptional 1.8% |
| Immigrants | Israel | 100.0 /100 | #11 | Exceptional 1.8% |
| Immigrants | Korea | 100.0 /100 | #12 | Exceptional 1.8% |
| Immigrants | Eastern Asia | 100.0 /100 | #13 | Exceptional 1.8% |
| Immigrants | China | 100.0 /100 | #14 | Exceptional 1.8% |
| Immigrants | Bolivia | 100.0 /100 | #15 | Exceptional 1.8% |
| Indians (Asian) | 100.0 /100 | #16 | Exceptional 1.8% |
| Burmese | 100.0 /100 | #17 | Exceptional 1.8% |