Alaskan Athabascan vs Scotch-Irish Vision Disability
COMPARE
Alaskan Athabascan
Scotch-Irish
Vision Disability
Vision Disability Comparison
Alaskan Athabascans
Scotch-Irish
3.1%
VISION DISABILITY
0.0/ 100
METRIC RATING
336th/ 347
METRIC RANK
2.4%
VISION DISABILITY
0.0/ 100
METRIC RATING
276th/ 347
METRIC RANK
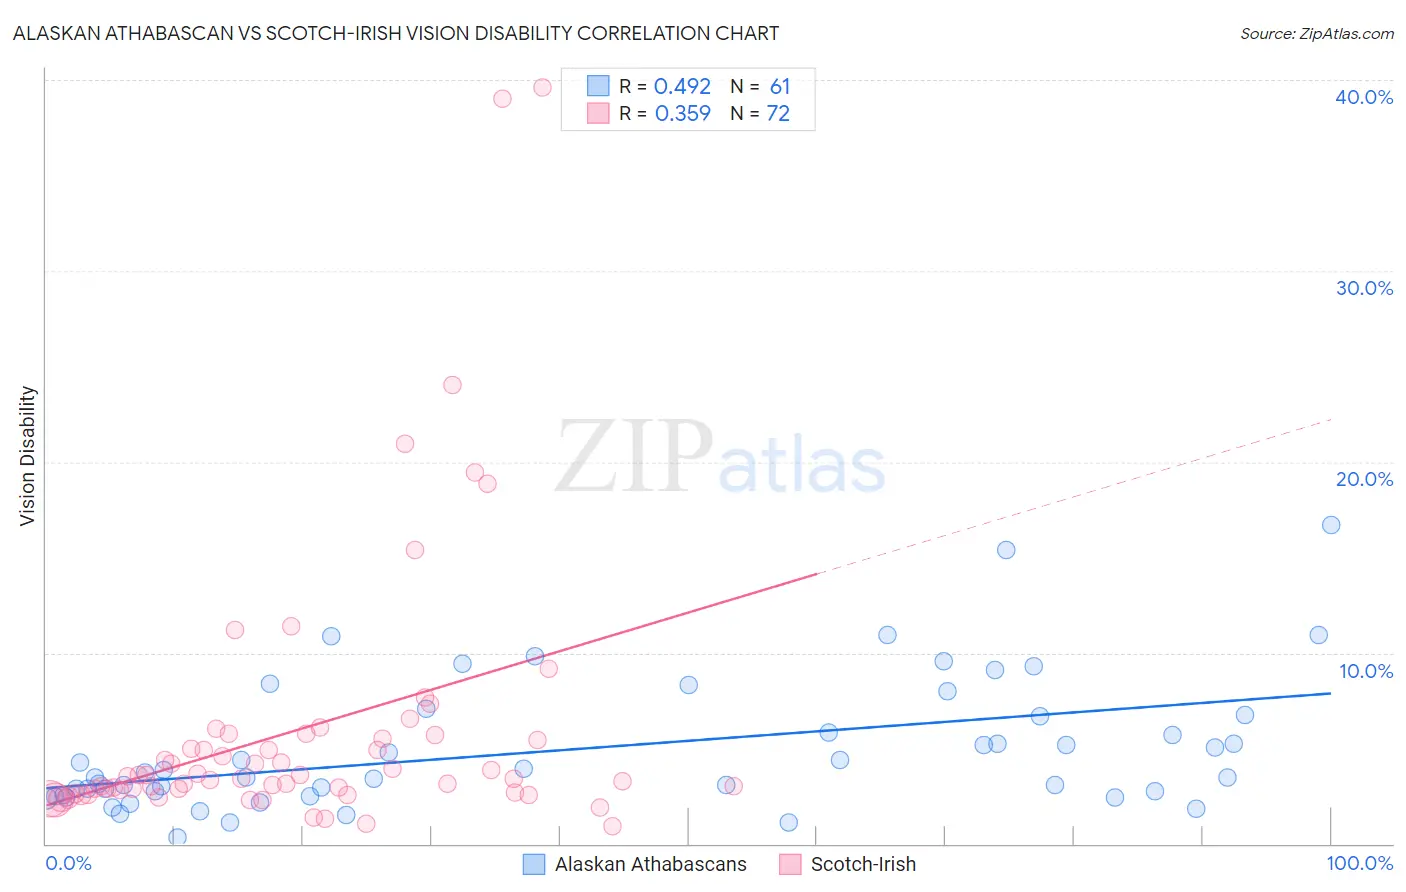
Alaskan Athabascan vs Scotch-Irish Vision Disability Correlation Chart
The statistical analysis conducted on geographies consisting of 45,813,116 people shows a moderate positive correlation between the proportion of Alaskan Athabascans and percentage of population with vision disability in the United States with a correlation coefficient (R) of 0.492 and weighted average of 3.1%. Similarly, the statistical analysis conducted on geographies consisting of 547,366,805 people shows a mild positive correlation between the proportion of Scotch-Irish and percentage of population with vision disability in the United States with a correlation coefficient (R) of 0.359 and weighted average of 2.4%, a difference of 29.1%.
Vision Disability Correlation Summary
| Measurement | Alaskan Athabascan | Scotch-Irish |
| Minimum | 0.32% | 0.89% |
| Maximum | 16.7% | 39.6% |
| Range | 16.4% | 38.7% |
| Mean | 4.9% | 6.0% |
| Median | 3.5% | 3.5% |
| Interquartile 25% (IQ1) | 2.5% | 2.7% |
| Interquartile 75% (IQ3) | 6.7% | 5.6% |
| Interquartile Range (IQR) | 4.2% | 2.9% |
| Standard Deviation (Sample) | 3.4% | 7.3% |
| Standard Deviation (Population) | 3.4% | 7.2% |
Similar Demographics by Vision Disability
Demographics Similar to Alaskan Athabascans by Vision Disability
In terms of vision disability, the demographic groups most similar to Alaskan Athabascans are Dutch West Indian (3.2%, a difference of 0.030%), Navajo (3.1%, a difference of 0.16%), Chickasaw (3.2%, a difference of 0.93%), Tsimshian (3.2%, a difference of 1.6%), and Creek (3.2%, a difference of 1.8%).
| Demographics | Rating | Rank | Vision Disability |
| Apache | 0.0 /100 | #329 | Tragic 3.0% |
| Colville | 0.0 /100 | #330 | Tragic 3.0% |
| Central American Indians | 0.0 /100 | #331 | Tragic 3.0% |
| Seminole | 0.0 /100 | #332 | Tragic 3.1% |
| Cajuns | 0.0 /100 | #333 | Tragic 3.1% |
| Cheyenne | 0.0 /100 | #334 | Tragic 3.1% |
| Navajo | 0.0 /100 | #335 | Tragic 3.1% |
| Alaskan Athabascans | 0.0 /100 | #336 | Tragic 3.1% |
| Dutch West Indians | 0.0 /100 | #337 | Tragic 3.2% |
| Chickasaw | 0.0 /100 | #338 | Tragic 3.2% |
| Tsimshian | 0.0 /100 | #339 | Tragic 3.2% |
| Creek | 0.0 /100 | #340 | Tragic 3.2% |
| Kiowa | 0.0 /100 | #341 | Tragic 3.3% |
| Choctaw | 0.0 /100 | #342 | Tragic 3.3% |
| Pima | 0.0 /100 | #343 | Tragic 3.3% |
Demographics Similar to Scotch-Irish by Vision Disability
In terms of vision disability, the demographic groups most similar to Scotch-Irish are Bahamian (2.4%, a difference of 0.040%), Chippewa (2.4%, a difference of 0.090%), Spanish (2.4%, a difference of 0.20%), Nepalese (2.4%, a difference of 0.21%), and Cape Verdean (2.4%, a difference of 0.25%).
| Demographics | Rating | Rank | Vision Disability |
| Celtics | 0.1 /100 | #269 | Tragic 2.4% |
| Cubans | 0.1 /100 | #270 | Tragic 2.4% |
| Immigrants | Azores | 0.1 /100 | #271 | Tragic 2.4% |
| Spaniards | 0.1 /100 | #272 | Tragic 2.4% |
| Immigrants | Bahamas | 0.1 /100 | #273 | Tragic 2.4% |
| Immigrants | Latin America | 0.0 /100 | #274 | Tragic 2.4% |
| Chippewa | 0.0 /100 | #275 | Tragic 2.4% |
| Scotch-Irish | 0.0 /100 | #276 | Tragic 2.4% |
| Bahamians | 0.0 /100 | #277 | Tragic 2.4% |
| Spanish | 0.0 /100 | #278 | Tragic 2.4% |
| Nepalese | 0.0 /100 | #279 | Tragic 2.4% |
| Cape Verdeans | 0.0 /100 | #280 | Tragic 2.4% |
| U.S. Virgin Islanders | 0.0 /100 | #281 | Tragic 2.5% |
| Immigrants | Caribbean | 0.0 /100 | #282 | Tragic 2.5% |
| Puget Sound Salish | 0.0 /100 | #283 | Tragic 2.5% |