Alaskan Athabascan vs Immigrants from Hong Kong Disability Age 35 to 64
COMPARE
Alaskan Athabascan
Immigrants from Hong Kong
Disability Age 35 to 64
Disability Age 35 to 64 Comparison
Alaskan Athabascans
Immigrants from Hong Kong
15.7%
DISABILITY AGE 35 TO 64
0.0/ 100
METRIC RATING
332nd/ 347
METRIC RANK
8.2%
DISABILITY AGE 35 TO 64
100.0/ 100
METRIC RATING
3rd/ 347
METRIC RANK
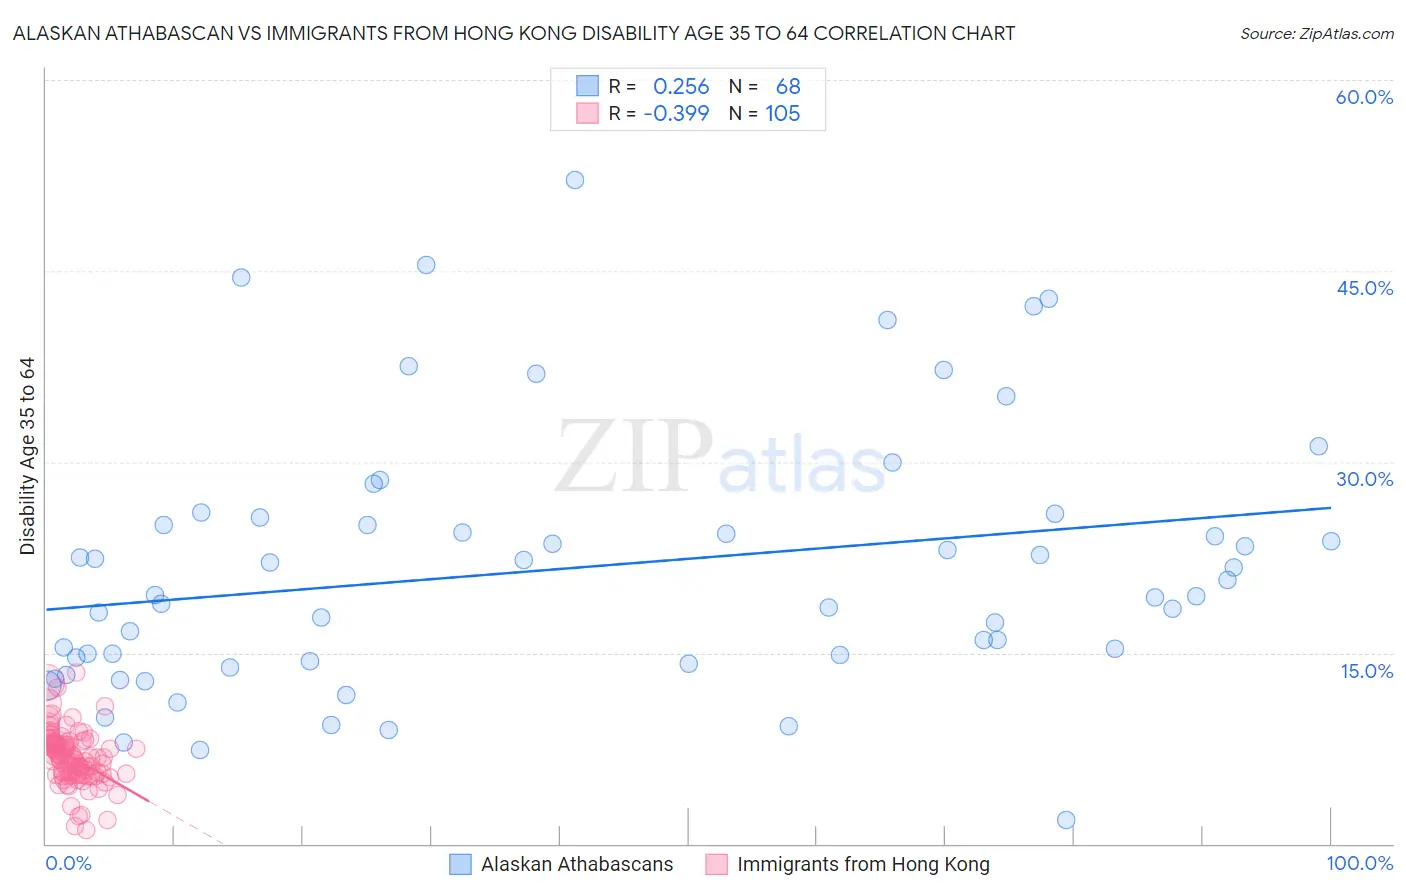
Alaskan Athabascan vs Immigrants from Hong Kong Disability Age 35 to 64 Correlation Chart
The statistical analysis conducted on geographies consisting of 45,816,251 people shows a weak positive correlation between the proportion of Alaskan Athabascans and percentage of population with a disability between the ages 34 and 64 in the United States with a correlation coefficient (R) of 0.256 and weighted average of 15.7%. Similarly, the statistical analysis conducted on geographies consisting of 253,870,545 people shows a mild negative correlation between the proportion of Immigrants from Hong Kong and percentage of population with a disability between the ages 34 and 64 in the United States with a correlation coefficient (R) of -0.399 and weighted average of 8.2%, a difference of 91.8%.
Disability Age 35 to 64 Correlation Summary
| Measurement | Alaskan Athabascan | Immigrants from Hong Kong |
| Minimum | 1.9% | 1.1% |
| Maximum | 52.2% | 13.5% |
| Range | 50.3% | 12.4% |
| Mean | 21.7% | 6.8% |
| Median | 19.5% | 6.7% |
| Interquartile 25% (IQ1) | 14.5% | 5.4% |
| Interquartile 75% (IQ3) | 25.4% | 7.9% |
| Interquartile Range (IQR) | 10.9% | 2.4% |
| Standard Deviation (Sample) | 10.3% | 2.1% |
| Standard Deviation (Population) | 10.3% | 2.1% |
Similar Demographics by Disability Age 35 to 64
Demographics Similar to Alaskan Athabascans by Disability Age 35 to 64
In terms of disability age 35 to 64, the demographic groups most similar to Alaskan Athabascans are Yuman (15.8%, a difference of 0.55%), Dutch West Indian (15.6%, a difference of 0.59%), Colville (15.8%, a difference of 0.75%), Seminole (15.9%, a difference of 0.85%), and Menominee (15.9%, a difference of 1.1%).
| Demographics | Rating | Rank | Disability Age 35 to 64 |
| Arapaho | 0.0 /100 | #325 | Tragic 15.1% |
| Natives/Alaskans | 0.0 /100 | #326 | Tragic 15.3% |
| Pueblo | 0.0 /100 | #327 | Tragic 15.3% |
| Cajuns | 0.0 /100 | #328 | Tragic 15.3% |
| Cherokee | 0.0 /100 | #329 | Tragic 15.5% |
| Navajo | 0.0 /100 | #330 | Tragic 15.5% |
| Dutch West Indians | 0.0 /100 | #331 | Tragic 15.6% |
| Alaskan Athabascans | 0.0 /100 | #332 | Tragic 15.7% |
| Yuman | 0.0 /100 | #333 | Tragic 15.8% |
| Colville | 0.0 /100 | #334 | Tragic 15.8% |
| Seminole | 0.0 /100 | #335 | Tragic 15.9% |
| Menominee | 0.0 /100 | #336 | Tragic 15.9% |
| Puerto Ricans | 0.0 /100 | #337 | Tragic 15.9% |
| Chickasaw | 0.0 /100 | #338 | Tragic 16.1% |
| Pima | 0.0 /100 | #339 | Tragic 16.1% |
Demographics Similar to Immigrants from Hong Kong by Disability Age 35 to 64
In terms of disability age 35 to 64, the demographic groups most similar to Immigrants from Hong Kong are Immigrants from India (8.3%, a difference of 1.1%), Filipino (8.0%, a difference of 1.8%), Immigrants from Iran (8.5%, a difference of 3.6%), Immigrants from Taiwan (7.8%, a difference of 4.4%), and Thai (8.6%, a difference of 4.6%).
| Demographics | Rating | Rank | Disability Age 35 to 64 |
| Immigrants | Taiwan | 100.0 /100 | #1 | Exceptional 7.8% |
| Filipinos | 100.0 /100 | #2 | Exceptional 8.0% |
| Immigrants | Hong Kong | 100.0 /100 | #3 | Exceptional 8.2% |
| Immigrants | India | 100.0 /100 | #4 | Exceptional 8.3% |
| Immigrants | Iran | 100.0 /100 | #5 | Exceptional 8.5% |
| Thais | 100.0 /100 | #6 | Exceptional 8.6% |
| Immigrants | Israel | 100.0 /100 | #7 | Exceptional 8.6% |
| Iranians | 100.0 /100 | #8 | Exceptional 8.7% |
| Immigrants | China | 100.0 /100 | #9 | Exceptional 8.7% |
| Immigrants | Bolivia | 100.0 /100 | #10 | Exceptional 8.7% |
| Immigrants | Eastern Asia | 100.0 /100 | #11 | Exceptional 8.8% |
| Indians (Asian) | 100.0 /100 | #12 | Exceptional 8.9% |
| Immigrants | South Central Asia | 100.0 /100 | #13 | Exceptional 8.9% |
| Immigrants | Singapore | 100.0 /100 | #14 | Exceptional 8.9% |
| Bolivians | 100.0 /100 | #15 | Exceptional 8.9% |