Alaskan Athabascan vs Guatemalan Self-Care Disability
COMPARE
Alaskan Athabascan
Guatemalan
Self-Care Disability
Self-Care Disability Comparison
Alaskan Athabascans
Guatemalans
2.5%
SELF-CARE DISABILITY
10.4/ 100
METRIC RATING
206th/ 347
METRIC RANK
2.6%
SELF-CARE DISABILITY
2.7/ 100
METRIC RATING
228th/ 347
METRIC RANK
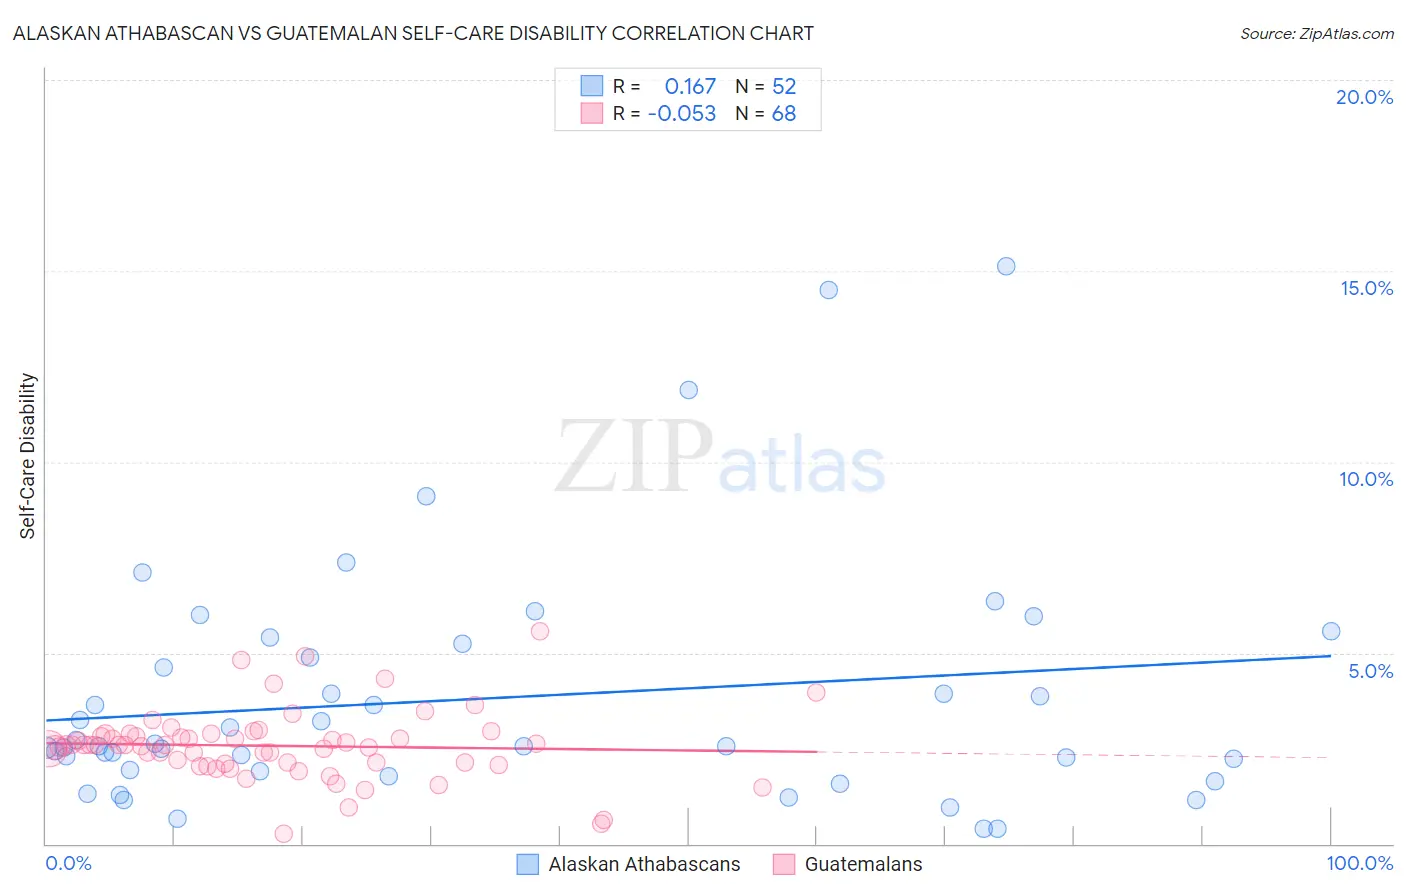
Alaskan Athabascan vs Guatemalan Self-Care Disability Correlation Chart
The statistical analysis conducted on geographies consisting of 45,796,895 people shows a poor positive correlation between the proportion of Alaskan Athabascans and percentage of population with self-care disability in the United States with a correlation coefficient (R) of 0.167 and weighted average of 2.5%. Similarly, the statistical analysis conducted on geographies consisting of 408,997,178 people shows a slight negative correlation between the proportion of Guatemalans and percentage of population with self-care disability in the United States with a correlation coefficient (R) of -0.053 and weighted average of 2.6%, a difference of 1.7%.
Self-Care Disability Correlation Summary
| Measurement | Alaskan Athabascan | Guatemalan |
| Minimum | 0.38% | 0.26% |
| Maximum | 15.1% | 5.6% |
| Range | 14.7% | 5.3% |
| Mean | 3.8% | 2.6% |
| Median | 2.6% | 2.6% |
| Interquartile 25% (IQ1) | 1.9% | 2.1% |
| Interquartile 75% (IQ3) | 5.0% | 2.8% |
| Interquartile Range (IQR) | 3.1% | 0.73% |
| Standard Deviation (Sample) | 3.2% | 0.92% |
| Standard Deviation (Population) | 3.1% | 0.91% |
Similar Demographics by Self-Care Disability
Demographics Similar to Alaskan Athabascans by Self-Care Disability
In terms of self-care disability, the demographic groups most similar to Alaskan Athabascans are French (2.5%, a difference of 0.060%), Immigrants from Russia (2.5%, a difference of 0.080%), Immigrants from Bahamas (2.5%, a difference of 0.18%), Central American (2.5%, a difference of 0.23%), and Immigrants from Lebanon (2.5%, a difference of 0.24%).
| Demographics | Rating | Rank | Self-Care Disability |
| Immigrants | Ghana | 14.7 /100 | #199 | Poor 2.5% |
| Immigrants | Western Africa | 13.3 /100 | #200 | Poor 2.5% |
| Immigrants | South Eastern Asia | 12.9 /100 | #201 | Poor 2.5% |
| Slovaks | 12.6 /100 | #202 | Poor 2.5% |
| Immigrants | Lebanon | 12.4 /100 | #203 | Poor 2.5% |
| Immigrants | Bahamas | 11.9 /100 | #204 | Poor 2.5% |
| Immigrants | Russia | 11.0 /100 | #205 | Poor 2.5% |
| Alaskan Athabascans | 10.4 /100 | #206 | Poor 2.5% |
| French | 9.9 /100 | #207 | Tragic 2.5% |
| Central Americans | 8.7 /100 | #208 | Tragic 2.5% |
| Malaysians | 7.7 /100 | #209 | Tragic 2.5% |
| Panamanians | 6.4 /100 | #210 | Tragic 2.5% |
| Native Hawaiians | 5.1 /100 | #211 | Tragic 2.6% |
| Samoans | 5.1 /100 | #212 | Tragic 2.6% |
| Ecuadorians | 4.7 /100 | #213 | Tragic 2.6% |
Demographics Similar to Guatemalans by Self-Care Disability
In terms of self-care disability, the demographic groups most similar to Guatemalans are Immigrants from Philippines (2.6%, a difference of 0.010%), Guamanian/Chamorro (2.6%, a difference of 0.070%), Immigrants from Ecuador (2.6%, a difference of 0.080%), Chinese (2.6%, a difference of 0.090%), and Iraqi (2.6%, a difference of 0.19%).
| Demographics | Rating | Rank | Self-Care Disability |
| Hondurans | 3.8 /100 | #221 | Tragic 2.6% |
| Spaniards | 3.8 /100 | #222 | Tragic 2.6% |
| French Canadians | 3.8 /100 | #223 | Tragic 2.6% |
| Osage | 3.6 /100 | #224 | Tragic 2.6% |
| Iraqis | 3.2 /100 | #225 | Tragic 2.6% |
| Chinese | 2.9 /100 | #226 | Tragic 2.6% |
| Immigrants | Philippines | 2.7 /100 | #227 | Tragic 2.6% |
| Guatemalans | 2.7 /100 | #228 | Tragic 2.6% |
| Guamanians/Chamorros | 2.5 /100 | #229 | Tragic 2.6% |
| Immigrants | Ecuador | 2.5 /100 | #230 | Tragic 2.6% |
| Immigrants | Guatemala | 2.2 /100 | #231 | Tragic 2.6% |
| Albanians | 2.2 /100 | #232 | Tragic 2.6% |
| Liberians | 2.1 /100 | #233 | Tragic 2.6% |
| Vietnamese | 2.1 /100 | #234 | Tragic 2.6% |
| Bahamians | 2.0 /100 | #235 | Tragic 2.6% |