Cajun vs Guatemalan Self-Care Disability
COMPARE
Cajun
Guatemalan
Self-Care Disability
Self-Care Disability Comparison
Cajuns
Guatemalans
2.9%
SELF-CARE DISABILITY
0.0/ 100
METRIC RATING
329th/ 347
METRIC RANK
2.6%
SELF-CARE DISABILITY
2.7/ 100
METRIC RATING
228th/ 347
METRIC RANK
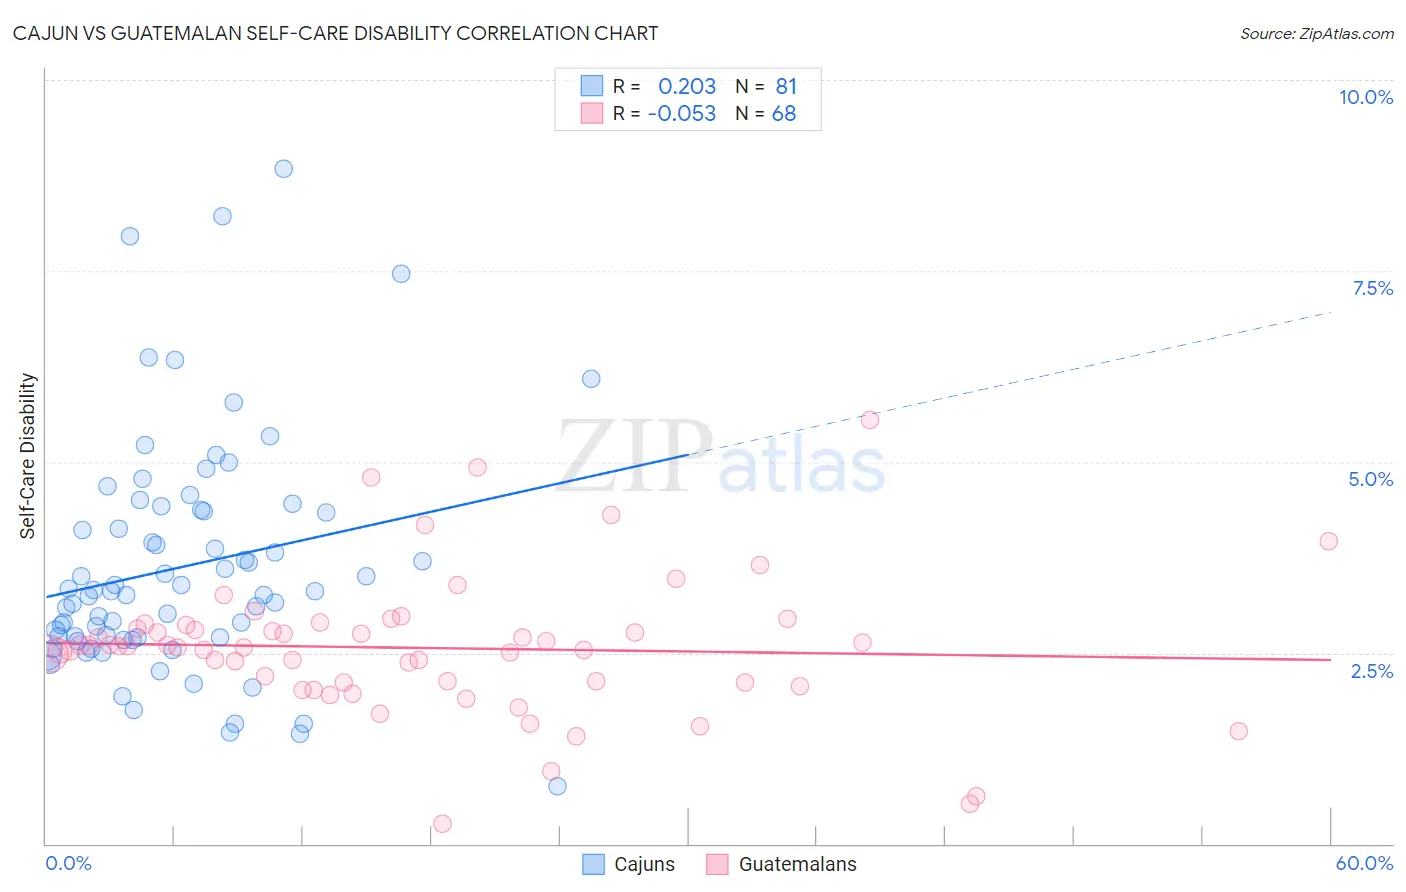
Cajun vs Guatemalan Self-Care Disability Correlation Chart
The statistical analysis conducted on geographies consisting of 149,634,207 people shows a weak positive correlation between the proportion of Cajuns and percentage of population with self-care disability in the United States with a correlation coefficient (R) of 0.203 and weighted average of 2.9%. Similarly, the statistical analysis conducted on geographies consisting of 408,997,178 people shows a slight negative correlation between the proportion of Guatemalans and percentage of population with self-care disability in the United States with a correlation coefficient (R) of -0.053 and weighted average of 2.6%, a difference of 14.3%.
Self-Care Disability Correlation Summary
| Measurement | Cajun | Guatemalan |
| Minimum | 0.75% | 0.26% |
| Maximum | 8.8% | 5.6% |
| Range | 8.1% | 5.3% |
| Mean | 3.6% | 2.6% |
| Median | 3.3% | 2.6% |
| Interquartile 25% (IQ1) | 2.7% | 2.1% |
| Interquartile 75% (IQ3) | 4.4% | 2.8% |
| Interquartile Range (IQR) | 1.7% | 0.73% |
| Standard Deviation (Sample) | 1.5% | 0.92% |
| Standard Deviation (Population) | 1.5% | 0.91% |
Similar Demographics by Self-Care Disability
Demographics Similar to Cajuns by Self-Care Disability
In terms of self-care disability, the demographic groups most similar to Cajuns are Hopi (2.9%, a difference of 0.21%), Black/African American (2.9%, a difference of 0.60%), Paiute (2.9%, a difference of 0.67%), Nepalese (3.0%, a difference of 0.75%), and Lumbee (3.0%, a difference of 0.87%).
| Demographics | Rating | Rank | Self-Care Disability |
| Comanche | 0.0 /100 | #322 | Tragic 2.9% |
| Seminole | 0.0 /100 | #323 | Tragic 2.9% |
| Cherokee | 0.0 /100 | #324 | Tragic 2.9% |
| Immigrants | Uzbekistan | 0.0 /100 | #325 | Tragic 2.9% |
| Paiute | 0.0 /100 | #326 | Tragic 2.9% |
| Blacks/African Americans | 0.0 /100 | #327 | Tragic 2.9% |
| Hopi | 0.0 /100 | #328 | Tragic 2.9% |
| Cajuns | 0.0 /100 | #329 | Tragic 2.9% |
| Nepalese | 0.0 /100 | #330 | Tragic 3.0% |
| Lumbee | 0.0 /100 | #331 | Tragic 3.0% |
| Kiowa | 0.0 /100 | #332 | Tragic 3.0% |
| Dutch West Indians | 0.0 /100 | #333 | Tragic 3.0% |
| Houma | 0.0 /100 | #334 | Tragic 3.0% |
| Immigrants | Azores | 0.0 /100 | #335 | Tragic 3.0% |
| Immigrants | Yemen | 0.0 /100 | #336 | Tragic 3.0% |
Demographics Similar to Guatemalans by Self-Care Disability
In terms of self-care disability, the demographic groups most similar to Guatemalans are Immigrants from Philippines (2.6%, a difference of 0.010%), Guamanian/Chamorro (2.6%, a difference of 0.070%), Immigrants from Ecuador (2.6%, a difference of 0.080%), Chinese (2.6%, a difference of 0.090%), and Iraqi (2.6%, a difference of 0.19%).
| Demographics | Rating | Rank | Self-Care Disability |
| Hondurans | 3.8 /100 | #221 | Tragic 2.6% |
| Spaniards | 3.8 /100 | #222 | Tragic 2.6% |
| French Canadians | 3.8 /100 | #223 | Tragic 2.6% |
| Osage | 3.6 /100 | #224 | Tragic 2.6% |
| Iraqis | 3.2 /100 | #225 | Tragic 2.6% |
| Chinese | 2.9 /100 | #226 | Tragic 2.6% |
| Immigrants | Philippines | 2.7 /100 | #227 | Tragic 2.6% |
| Guatemalans | 2.7 /100 | #228 | Tragic 2.6% |
| Guamanians/Chamorros | 2.5 /100 | #229 | Tragic 2.6% |
| Immigrants | Ecuador | 2.5 /100 | #230 | Tragic 2.6% |
| Immigrants | Guatemala | 2.2 /100 | #231 | Tragic 2.6% |
| Albanians | 2.2 /100 | #232 | Tragic 2.6% |
| Liberians | 2.1 /100 | #233 | Tragic 2.6% |
| Vietnamese | 2.1 /100 | #234 | Tragic 2.6% |
| Bahamians | 2.0 /100 | #235 | Tragic 2.6% |