Alaska Native vs Estonian Self-Care Disability
COMPARE
Alaska Native
Estonian
Self-Care Disability
Self-Care Disability Comparison
Alaska Natives
Estonians
2.4%
SELF-CARE DISABILITY
84.5/ 100
METRIC RATING
141st/ 347
METRIC RANK
2.3%
SELF-CARE DISABILITY
98.3/ 100
METRIC RATING
85th/ 347
METRIC RANK
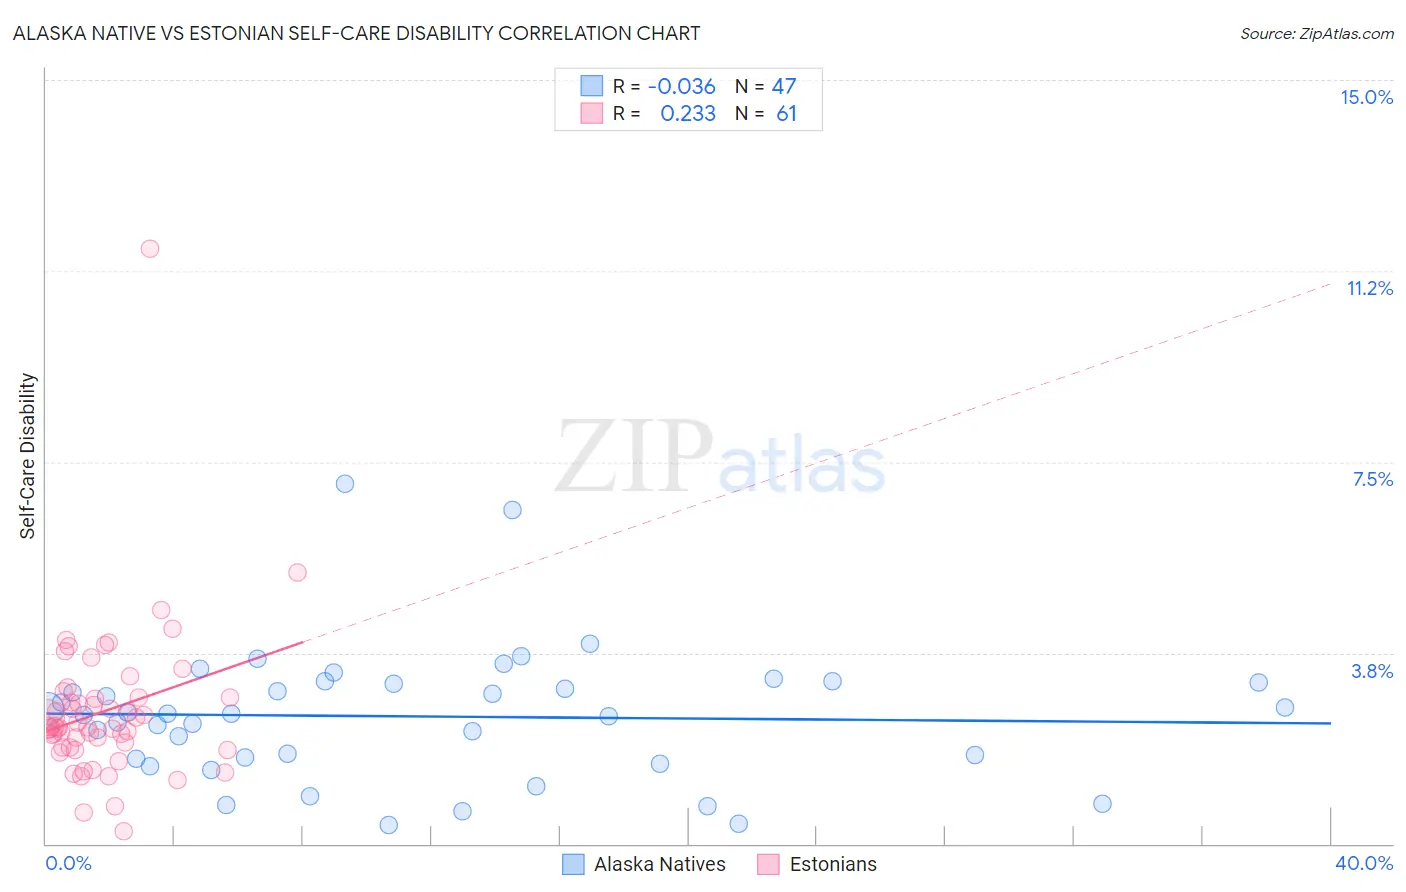
Alaska Native vs Estonian Self-Care Disability Correlation Chart
The statistical analysis conducted on geographies consisting of 76,706,144 people shows no correlation between the proportion of Alaska Natives and percentage of population with self-care disability in the United States with a correlation coefficient (R) of -0.036 and weighted average of 2.4%. Similarly, the statistical analysis conducted on geographies consisting of 123,478,369 people shows a weak positive correlation between the proportion of Estonians and percentage of population with self-care disability in the United States with a correlation coefficient (R) of 0.233 and weighted average of 2.3%, a difference of 2.9%.
Self-Care Disability Correlation Summary
| Measurement | Alaska Native | Estonian |
| Minimum | 0.38% | 0.24% |
| Maximum | 7.1% | 11.7% |
| Range | 6.7% | 11.4% |
| Mean | 2.5% | 2.6% |
| Median | 2.5% | 2.3% |
| Interquartile 25% (IQ1) | 1.7% | 1.9% |
| Interquartile 75% (IQ3) | 3.2% | 2.9% |
| Interquartile Range (IQR) | 1.5% | 0.99% |
| Standard Deviation (Sample) | 1.3% | 1.5% |
| Standard Deviation (Population) | 1.3% | 1.5% |
Similar Demographics by Self-Care Disability
Demographics Similar to Alaska Natives by Self-Care Disability
In terms of self-care disability, the demographic groups most similar to Alaska Natives are Immigrants from Uruguay (2.4%, a difference of 0.090%), Immigrants from Peru (2.4%, a difference of 0.12%), Afghan (2.4%, a difference of 0.19%), Immigrants from Croatia (2.4%, a difference of 0.21%), and Sri Lankan (2.4%, a difference of 0.21%).
| Demographics | Rating | Rank | Self-Care Disability |
| Russians | 88.2 /100 | #134 | Excellent 2.4% |
| Laotians | 87.8 /100 | #135 | Excellent 2.4% |
| South American Indians | 87.2 /100 | #136 | Excellent 2.4% |
| Austrians | 87.0 /100 | #137 | Excellent 2.4% |
| Immigrants | Croatia | 86.6 /100 | #138 | Excellent 2.4% |
| Sri Lankans | 86.6 /100 | #139 | Excellent 2.4% |
| Immigrants | Uruguay | 85.4 /100 | #140 | Excellent 2.4% |
| Alaska Natives | 84.5 /100 | #141 | Excellent 2.4% |
| Immigrants | Peru | 83.2 /100 | #142 | Excellent 2.4% |
| Afghans | 82.3 /100 | #143 | Excellent 2.4% |
| Costa Ricans | 80.8 /100 | #144 | Excellent 2.4% |
| Germans | 80.1 /100 | #145 | Excellent 2.4% |
| Israelis | 80.0 /100 | #146 | Good 2.4% |
| Dutch | 77.5 /100 | #147 | Good 2.4% |
| Romanians | 75.8 /100 | #148 | Good 2.4% |
Demographics Similar to Estonians by Self-Care Disability
In terms of self-care disability, the demographic groups most similar to Estonians are Immigrants from Northern Africa (2.3%, a difference of 0.020%), Sierra Leonean (2.4%, a difference of 0.16%), Lithuanian (2.4%, a difference of 0.16%), Immigrants from Congo (2.4%, a difference of 0.21%), and Immigrants from Spain (2.3%, a difference of 0.34%).
| Demographics | Rating | Rank | Self-Care Disability |
| Immigrants | Ireland | 99.0 /100 | #78 | Exceptional 2.3% |
| Immigrants | Kenya | 99.0 /100 | #79 | Exceptional 2.3% |
| Chileans | 98.8 /100 | #80 | Exceptional 2.3% |
| Ugandans | 98.8 /100 | #81 | Exceptional 2.3% |
| Immigrants | Denmark | 98.8 /100 | #82 | Exceptional 2.3% |
| Indians (Asian) | 98.7 /100 | #83 | Exceptional 2.3% |
| Immigrants | Spain | 98.7 /100 | #84 | Exceptional 2.3% |
| Estonians | 98.3 /100 | #85 | Exceptional 2.3% |
| Immigrants | Northern Africa | 98.2 /100 | #86 | Exceptional 2.3% |
| Sierra Leoneans | 98.0 /100 | #87 | Exceptional 2.4% |
| Lithuanians | 98.0 /100 | #88 | Exceptional 2.4% |
| Immigrants | Congo | 98.0 /100 | #89 | Exceptional 2.4% |
| Immigrants | Czechoslovakia | 97.7 /100 | #90 | Exceptional 2.4% |
| Immigrants | Jordan | 97.7 /100 | #91 | Exceptional 2.4% |
| Icelanders | 97.4 /100 | #92 | Exceptional 2.4% |