Alaska Native vs Guyanese Self-Care Disability
COMPARE
Alaska Native
Guyanese
Self-Care Disability
Self-Care Disability Comparison
Alaska Natives
Guyanese
2.4%
SELF-CARE DISABILITY
84.5/ 100
METRIC RATING
141st/ 347
METRIC RANK
2.7%
SELF-CARE DISABILITY
0.0/ 100
METRIC RATING
291st/ 347
METRIC RANK
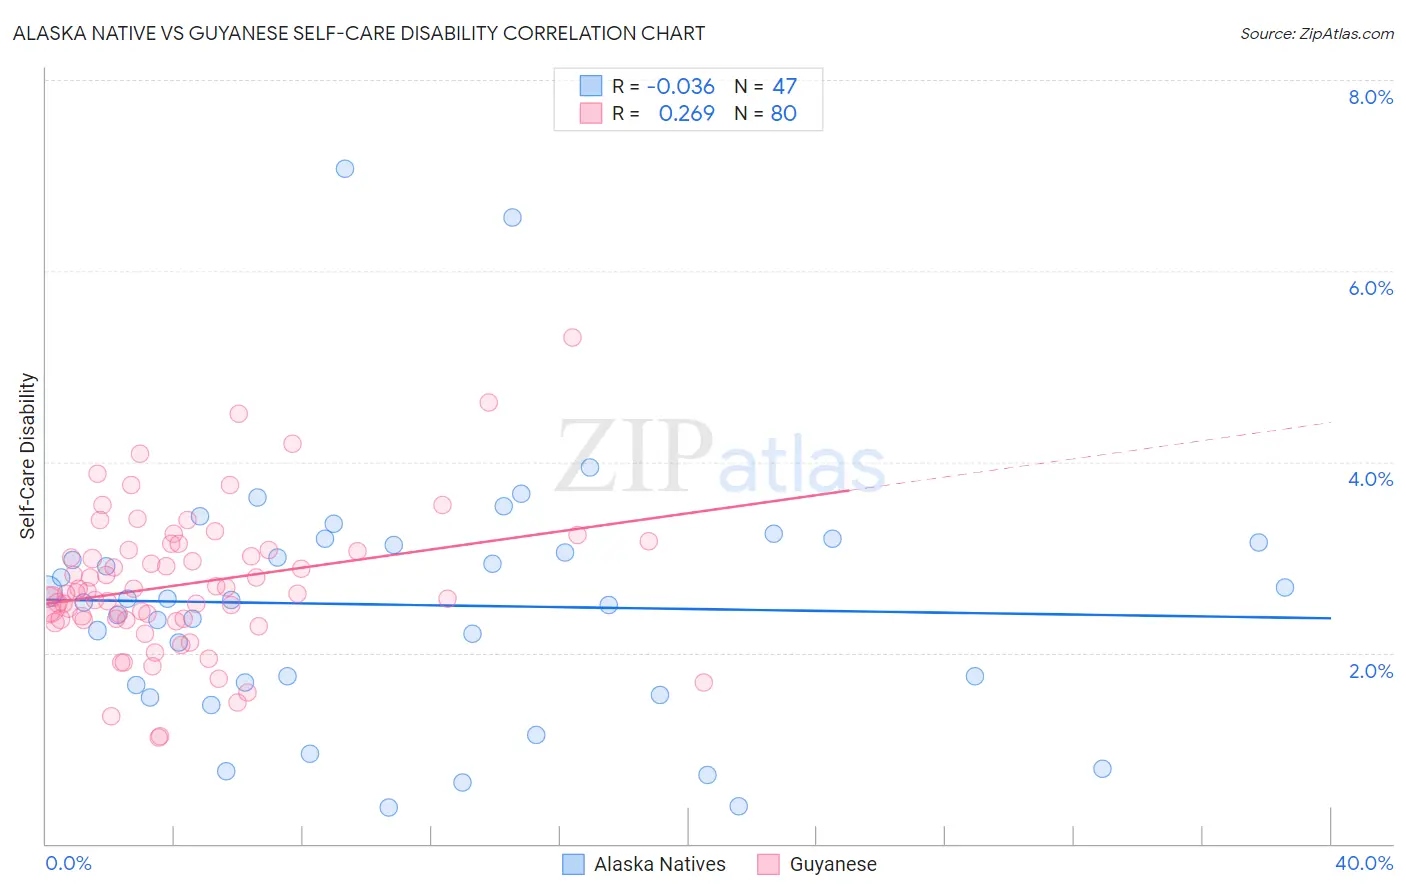
Alaska Native vs Guyanese Self-Care Disability Correlation Chart
The statistical analysis conducted on geographies consisting of 76,706,144 people shows no correlation between the proportion of Alaska Natives and percentage of population with self-care disability in the United States with a correlation coefficient (R) of -0.036 and weighted average of 2.4%. Similarly, the statistical analysis conducted on geographies consisting of 176,718,445 people shows a weak positive correlation between the proportion of Guyanese and percentage of population with self-care disability in the United States with a correlation coefficient (R) of 0.269 and weighted average of 2.7%, a difference of 13.3%.
Self-Care Disability Correlation Summary
| Measurement | Alaska Native | Guyanese |
| Minimum | 0.38% | 1.1% |
| Maximum | 7.1% | 5.3% |
| Range | 6.7% | 4.2% |
| Mean | 2.5% | 2.7% |
| Median | 2.5% | 2.6% |
| Interquartile 25% (IQ1) | 1.7% | 2.3% |
| Interquartile 75% (IQ3) | 3.2% | 3.1% |
| Interquartile Range (IQR) | 1.5% | 0.73% |
| Standard Deviation (Sample) | 1.3% | 0.75% |
| Standard Deviation (Population) | 1.3% | 0.74% |
Similar Demographics by Self-Care Disability
Demographics Similar to Alaska Natives by Self-Care Disability
In terms of self-care disability, the demographic groups most similar to Alaska Natives are Immigrants from Uruguay (2.4%, a difference of 0.090%), Immigrants from Peru (2.4%, a difference of 0.12%), Afghan (2.4%, a difference of 0.19%), Immigrants from Croatia (2.4%, a difference of 0.21%), and Sri Lankan (2.4%, a difference of 0.21%).
| Demographics | Rating | Rank | Self-Care Disability |
| Russians | 88.2 /100 | #134 | Excellent 2.4% |
| Laotians | 87.8 /100 | #135 | Excellent 2.4% |
| South American Indians | 87.2 /100 | #136 | Excellent 2.4% |
| Austrians | 87.0 /100 | #137 | Excellent 2.4% |
| Immigrants | Croatia | 86.6 /100 | #138 | Excellent 2.4% |
| Sri Lankans | 86.6 /100 | #139 | Excellent 2.4% |
| Immigrants | Uruguay | 85.4 /100 | #140 | Excellent 2.4% |
| Alaska Natives | 84.5 /100 | #141 | Excellent 2.4% |
| Immigrants | Peru | 83.2 /100 | #142 | Excellent 2.4% |
| Afghans | 82.3 /100 | #143 | Excellent 2.4% |
| Costa Ricans | 80.8 /100 | #144 | Excellent 2.4% |
| Germans | 80.1 /100 | #145 | Excellent 2.4% |
| Israelis | 80.0 /100 | #146 | Good 2.4% |
| Dutch | 77.5 /100 | #147 | Good 2.4% |
| Romanians | 75.8 /100 | #148 | Good 2.4% |
Demographics Similar to Guyanese by Self-Care Disability
In terms of self-care disability, the demographic groups most similar to Guyanese are Central American Indian (2.7%, a difference of 0.16%), Belizean (2.7%, a difference of 0.16%), Blackfeet (2.7%, a difference of 0.16%), Cuban (2.7%, a difference of 0.26%), and Barbadian (2.7%, a difference of 0.31%).
| Demographics | Rating | Rank | Self-Care Disability |
| Fijians | 0.0 /100 | #284 | Tragic 2.7% |
| Jamaicans | 0.0 /100 | #285 | Tragic 2.7% |
| French American Indians | 0.0 /100 | #286 | Tragic 2.7% |
| Immigrants | Jamaica | 0.0 /100 | #287 | Tragic 2.7% |
| Immigrants | Barbados | 0.0 /100 | #288 | Tragic 2.7% |
| Africans | 0.0 /100 | #289 | Tragic 2.7% |
| Cubans | 0.0 /100 | #290 | Tragic 2.7% |
| Guyanese | 0.0 /100 | #291 | Tragic 2.7% |
| Central American Indians | 0.0 /100 | #292 | Tragic 2.7% |
| Belizeans | 0.0 /100 | #293 | Tragic 2.7% |
| Blackfeet | 0.0 /100 | #294 | Tragic 2.7% |
| Barbadians | 0.0 /100 | #295 | Tragic 2.7% |
| Immigrants | Portugal | 0.0 /100 | #296 | Tragic 2.8% |
| West Indians | 0.0 /100 | #297 | Tragic 2.8% |
| Americans | 0.0 /100 | #298 | Tragic 2.8% |