Lebanese vs German Disability
COMPARE
Lebanese
German
Disability
Disability Comparison
Lebanese
Germans
11.8%
DISABILITY
27.9/ 100
METRIC RATING
187th/ 347
METRIC RANK
12.8%
DISABILITY
0.0/ 100
METRIC RATING
278th/ 347
METRIC RANK
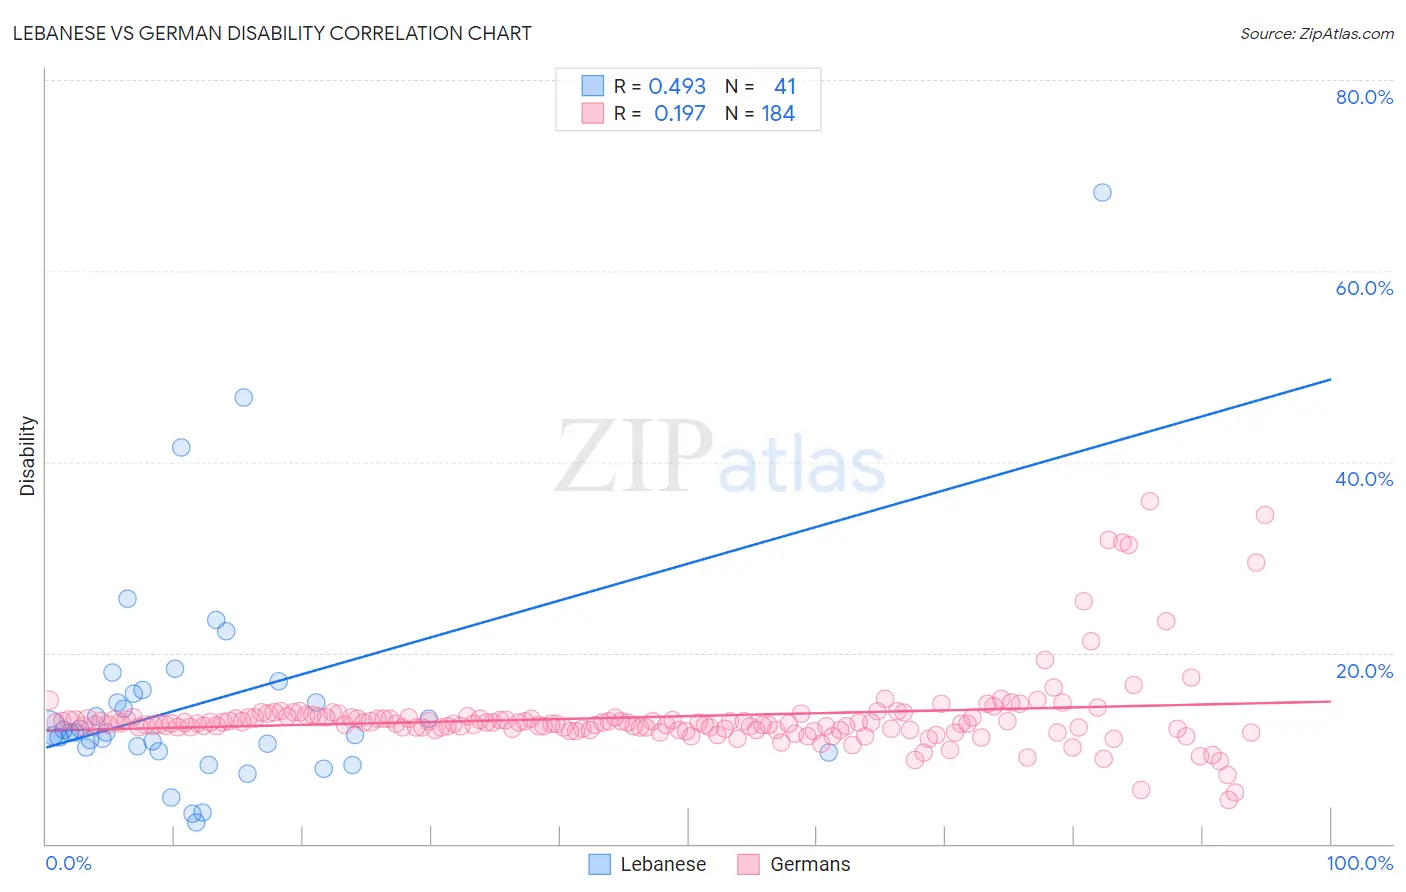
Lebanese vs German Disability Correlation Chart
The statistical analysis conducted on geographies consisting of 401,592,225 people shows a moderate positive correlation between the proportion of Lebanese and percentage of population with a disability in the United States with a correlation coefficient (R) of 0.493 and weighted average of 11.8%. Similarly, the statistical analysis conducted on geographies consisting of 581,054,962 people shows a poor positive correlation between the proportion of Germans and percentage of population with a disability in the United States with a correlation coefficient (R) of 0.197 and weighted average of 12.8%, a difference of 8.5%.
Disability Correlation Summary
| Measurement | Lebanese | German |
| Minimum | 2.2% | 4.5% |
| Maximum | 68.2% | 35.9% |
| Range | 66.0% | 31.4% |
| Mean | 15.0% | 13.3% |
| Median | 11.6% | 12.6% |
| Interquartile 25% (IQ1) | 9.9% | 12.0% |
| Interquartile 75% (IQ3) | 16.0% | 13.2% |
| Interquartile Range (IQR) | 6.0% | 1.2% |
| Standard Deviation (Sample) | 12.1% | 4.2% |
| Standard Deviation (Population) | 11.9% | 4.2% |
Similar Demographics by Disability
Demographics Similar to Lebanese by Disability
In terms of disability, the demographic groups most similar to Lebanese are Immigrants from Scotland (11.8%, a difference of 0.020%), Immigrants from Burma/Myanmar (11.8%, a difference of 0.030%), Iraqi (11.8%, a difference of 0.11%), Honduran (11.8%, a difference of 0.18%), and Immigrants from Mexico (11.9%, a difference of 0.24%).
| Demographics | Rating | Rank | Disability |
| Immigrants | Honduras | 37.8 /100 | #180 | Fair 11.8% |
| Immigrants | Oceania | 34.3 /100 | #181 | Fair 11.8% |
| Icelanders | 34.0 /100 | #182 | Fair 11.8% |
| Hondurans | 31.2 /100 | #183 | Fair 11.8% |
| Iraqis | 30.0 /100 | #184 | Fair 11.8% |
| Immigrants | Burma/Myanmar | 28.5 /100 | #185 | Fair 11.8% |
| Immigrants | Scotland | 28.2 /100 | #186 | Fair 11.8% |
| Lebanese | 27.9 /100 | #187 | Fair 11.8% |
| Immigrants | Mexico | 23.8 /100 | #188 | Fair 11.9% |
| Immigrants | Zaire | 21.8 /100 | #189 | Fair 11.9% |
| Immigrants | West Indies | 21.1 /100 | #190 | Fair 11.9% |
| Ute | 19.5 /100 | #191 | Poor 11.9% |
| Lithuanians | 18.8 /100 | #192 | Poor 11.9% |
| Immigrants | Bosnia and Herzegovina | 18.0 /100 | #193 | Poor 11.9% |
| Somalis | 17.3 /100 | #194 | Poor 11.9% |
Demographics Similar to Germans by Disability
In terms of disability, the demographic groups most similar to Germans are Fijian (12.8%, a difference of 0.090%), Spanish (12.8%, a difference of 0.15%), Dutch (12.8%, a difference of 0.17%), Hmong (12.8%, a difference of 0.22%), and Immigrants from Portugal (12.9%, a difference of 0.29%).
| Demographics | Rating | Rank | Disability |
| Immigrants | Yemen | 0.1 /100 | #271 | Tragic 12.6% |
| Dominicans | 0.0 /100 | #272 | Tragic 12.7% |
| Finns | 0.0 /100 | #273 | Tragic 12.7% |
| Nepalese | 0.0 /100 | #274 | Tragic 12.8% |
| Sioux | 0.0 /100 | #275 | Tragic 12.8% |
| Hmong | 0.0 /100 | #276 | Tragic 12.8% |
| Dutch | 0.0 /100 | #277 | Tragic 12.8% |
| Germans | 0.0 /100 | #278 | Tragic 12.8% |
| Fijians | 0.0 /100 | #279 | Tragic 12.8% |
| Spanish | 0.0 /100 | #280 | Tragic 12.8% |
| Immigrants | Portugal | 0.0 /100 | #281 | Tragic 12.9% |
| Scottish | 0.0 /100 | #282 | Tragic 12.9% |
| Irish | 0.0 /100 | #283 | Tragic 12.9% |
| Welsh | 0.0 /100 | #284 | Tragic 12.9% |
| Crow | 0.0 /100 | #285 | Tragic 12.9% |