Luxembourger vs German Disability
COMPARE
Luxembourger
German
Disability
Disability Comparison
Luxembourgers
Germans
11.3%
DISABILITY
93.9/ 100
METRIC RATING
117th/ 347
METRIC RANK
12.8%
DISABILITY
0.0/ 100
METRIC RATING
278th/ 347
METRIC RANK
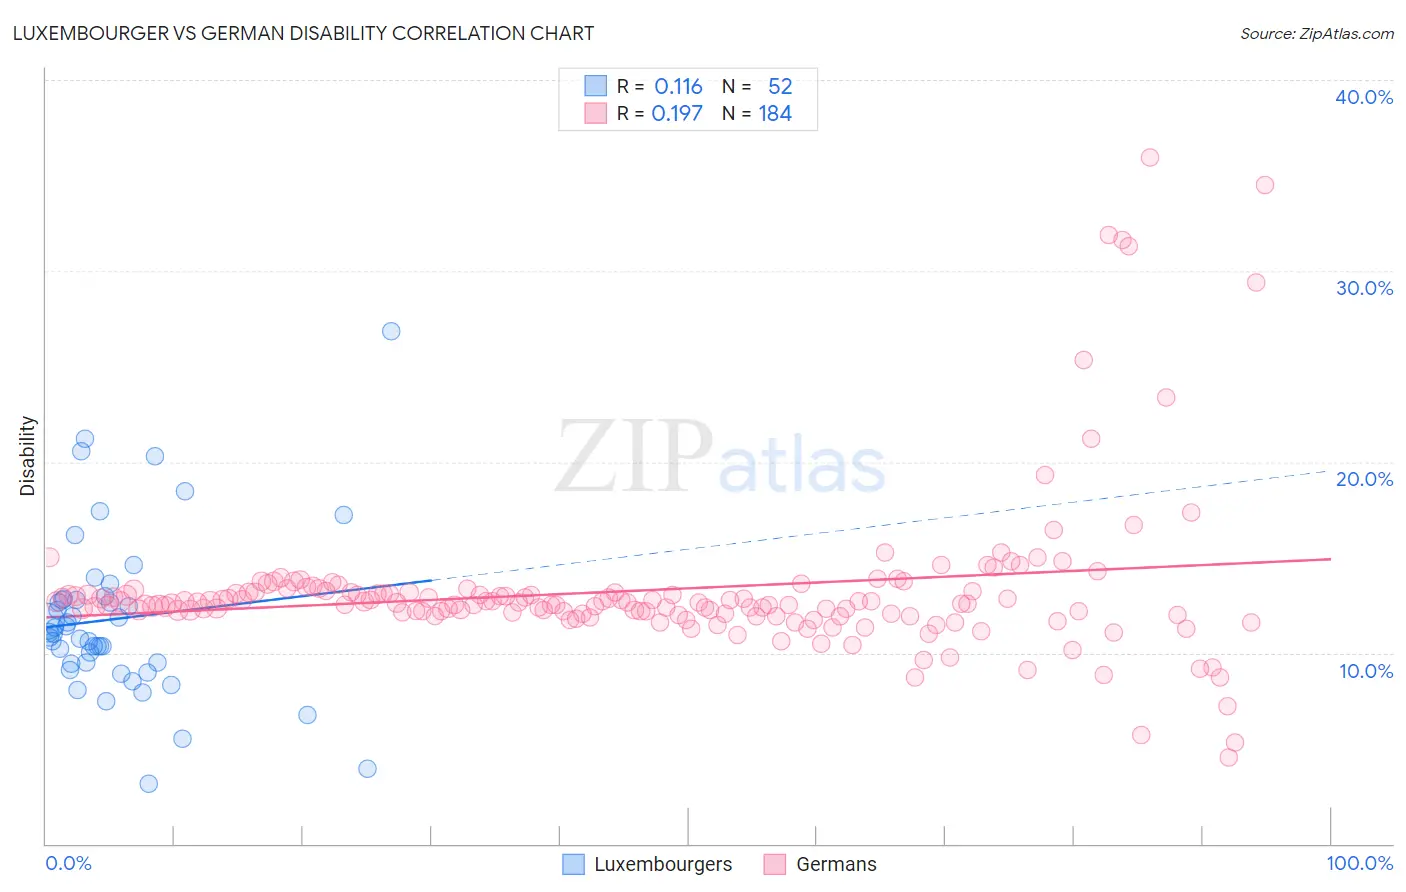
Luxembourger vs German Disability Correlation Chart
The statistical analysis conducted on geographies consisting of 144,681,066 people shows a poor positive correlation between the proportion of Luxembourgers and percentage of population with a disability in the United States with a correlation coefficient (R) of 0.116 and weighted average of 11.3%. Similarly, the statistical analysis conducted on geographies consisting of 581,054,962 people shows a poor positive correlation between the proportion of Germans and percentage of population with a disability in the United States with a correlation coefficient (R) of 0.197 and weighted average of 12.8%, a difference of 13.0%.
Disability Correlation Summary
| Measurement | Luxembourger | German |
| Minimum | 3.1% | 4.5% |
| Maximum | 26.9% | 35.9% |
| Range | 23.7% | 31.4% |
| Mean | 11.8% | 13.3% |
| Median | 11.0% | 12.6% |
| Interquartile 25% (IQ1) | 9.5% | 12.0% |
| Interquartile 75% (IQ3) | 12.8% | 13.2% |
| Interquartile Range (IQR) | 3.3% | 1.2% |
| Standard Deviation (Sample) | 4.3% | 4.2% |
| Standard Deviation (Population) | 4.3% | 4.2% |
Similar Demographics by Disability
Demographics Similar to Luxembourgers by Disability
In terms of disability, the demographic groups most similar to Luxembourgers are Korean (11.3%, a difference of 0.010%), Immigrants from Northern Europe (11.3%, a difference of 0.060%), Central American (11.4%, a difference of 0.070%), Immigrants from North Macedonia (11.4%, a difference of 0.070%), and Immigrants from Costa Rica (11.4%, a difference of 0.080%).
| Demographics | Rating | Rank | Disability |
| Immigrants | Denmark | 95.6 /100 | #110 | Exceptional 11.3% |
| Immigrants | South Eastern Asia | 95.4 /100 | #111 | Exceptional 11.3% |
| Immigrants | Uzbekistan | 94.9 /100 | #112 | Exceptional 11.3% |
| Guyanese | 94.7 /100 | #113 | Exceptional 11.3% |
| Immigrants | Syria | 94.7 /100 | #114 | Exceptional 11.3% |
| Immigrants | Philippines | 94.6 /100 | #115 | Exceptional 11.3% |
| Immigrants | Northern Europe | 94.1 /100 | #116 | Exceptional 11.3% |
| Luxembourgers | 93.9 /100 | #117 | Exceptional 11.3% |
| Koreans | 93.8 /100 | #118 | Exceptional 11.3% |
| Central Americans | 93.5 /100 | #119 | Exceptional 11.4% |
| Immigrants | North Macedonia | 93.5 /100 | #120 | Exceptional 11.4% |
| Immigrants | Costa Rica | 93.4 /100 | #121 | Exceptional 11.4% |
| Brazilians | 93.3 /100 | #122 | Exceptional 11.4% |
| South Africans | 92.3 /100 | #123 | Exceptional 11.4% |
| South American Indians | 92.2 /100 | #124 | Exceptional 11.4% |
Demographics Similar to Germans by Disability
In terms of disability, the demographic groups most similar to Germans are Fijian (12.8%, a difference of 0.090%), Spanish (12.8%, a difference of 0.15%), Dutch (12.8%, a difference of 0.17%), Hmong (12.8%, a difference of 0.22%), and Immigrants from Portugal (12.9%, a difference of 0.29%).
| Demographics | Rating | Rank | Disability |
| Immigrants | Yemen | 0.1 /100 | #271 | Tragic 12.6% |
| Dominicans | 0.0 /100 | #272 | Tragic 12.7% |
| Finns | 0.0 /100 | #273 | Tragic 12.7% |
| Nepalese | 0.0 /100 | #274 | Tragic 12.8% |
| Sioux | 0.0 /100 | #275 | Tragic 12.8% |
| Hmong | 0.0 /100 | #276 | Tragic 12.8% |
| Dutch | 0.0 /100 | #277 | Tragic 12.8% |
| Germans | 0.0 /100 | #278 | Tragic 12.8% |
| Fijians | 0.0 /100 | #279 | Tragic 12.8% |
| Spanish | 0.0 /100 | #280 | Tragic 12.8% |
| Immigrants | Portugal | 0.0 /100 | #281 | Tragic 12.9% |
| Scottish | 0.0 /100 | #282 | Tragic 12.9% |
| Irish | 0.0 /100 | #283 | Tragic 12.9% |
| Welsh | 0.0 /100 | #284 | Tragic 12.9% |
| Crow | 0.0 /100 | #285 | Tragic 12.9% |