Comanche vs German Disability
COMPARE
Comanche
German
Disability
Disability Comparison
Comanche
Germans
14.1%
DISABILITY
0.0/ 100
METRIC RATING
323rd/ 347
METRIC RANK
12.8%
DISABILITY
0.0/ 100
METRIC RATING
278th/ 347
METRIC RANK
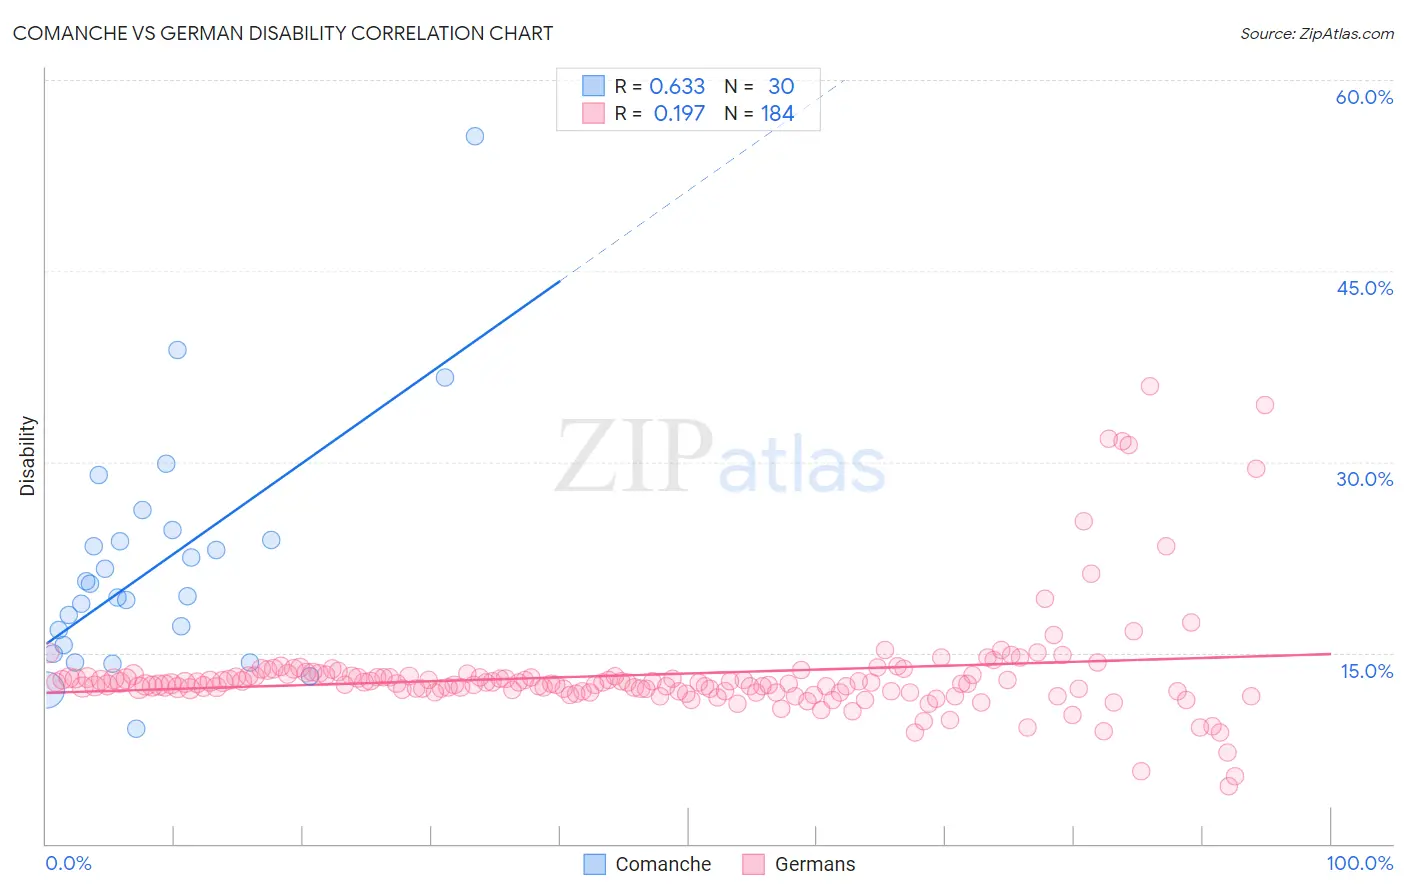
Comanche vs German Disability Correlation Chart
The statistical analysis conducted on geographies consisting of 109,776,757 people shows a significant positive correlation between the proportion of Comanche and percentage of population with a disability in the United States with a correlation coefficient (R) of 0.633 and weighted average of 14.1%. Similarly, the statistical analysis conducted on geographies consisting of 581,054,962 people shows a poor positive correlation between the proportion of Germans and percentage of population with a disability in the United States with a correlation coefficient (R) of 0.197 and weighted average of 12.8%, a difference of 10.1%.
Disability Correlation Summary
| Measurement | Comanche | German |
| Minimum | 9.0% | 4.5% |
| Maximum | 55.6% | 35.9% |
| Range | 46.5% | 31.4% |
| Mean | 21.9% | 13.3% |
| Median | 19.9% | 12.6% |
| Interquartile 25% (IQ1) | 15.6% | 12.0% |
| Interquartile 75% (IQ3) | 23.8% | 13.2% |
| Interquartile Range (IQR) | 8.3% | 1.2% |
| Standard Deviation (Sample) | 9.3% | 4.2% |
| Standard Deviation (Population) | 9.1% | 4.2% |
Similar Demographics by Disability
Demographics Similar to Comanche by Disability
In terms of disability, the demographic groups most similar to Comanche are Chippewa (14.1%, a difference of 0.20%), Native/Alaskan (14.2%, a difference of 0.25%), Osage (14.2%, a difference of 0.28%), Ottawa (14.2%, a difference of 0.30%), and Immigrants from the Azores (14.2%, a difference of 0.30%).
| Demographics | Rating | Rank | Disability |
| Pima | 0.0 /100 | #316 | Tragic 13.7% |
| Immigrants | Cabo Verde | 0.0 /100 | #317 | Tragic 13.7% |
| Menominee | 0.0 /100 | #318 | Tragic 13.8% |
| Iroquois | 0.0 /100 | #319 | Tragic 13.8% |
| Apache | 0.0 /100 | #320 | Tragic 13.9% |
| Paiute | 0.0 /100 | #321 | Tragic 13.9% |
| Americans | 0.0 /100 | #322 | Tragic 13.9% |
| Comanche | 0.0 /100 | #323 | Tragic 14.1% |
| Chippewa | 0.0 /100 | #324 | Tragic 14.1% |
| Natives/Alaskans | 0.0 /100 | #325 | Tragic 14.2% |
| Osage | 0.0 /100 | #326 | Tragic 14.2% |
| Ottawa | 0.0 /100 | #327 | Tragic 14.2% |
| Immigrants | Azores | 0.0 /100 | #328 | Tragic 14.2% |
| Potawatomi | 0.0 /100 | #329 | Tragic 14.2% |
| Navajo | 0.0 /100 | #330 | Tragic 14.3% |
Demographics Similar to Germans by Disability
In terms of disability, the demographic groups most similar to Germans are Fijian (12.8%, a difference of 0.090%), Spanish (12.8%, a difference of 0.15%), Dutch (12.8%, a difference of 0.17%), Hmong (12.8%, a difference of 0.22%), and Immigrants from Portugal (12.9%, a difference of 0.29%).
| Demographics | Rating | Rank | Disability |
| Immigrants | Yemen | 0.1 /100 | #271 | Tragic 12.6% |
| Dominicans | 0.0 /100 | #272 | Tragic 12.7% |
| Finns | 0.0 /100 | #273 | Tragic 12.7% |
| Nepalese | 0.0 /100 | #274 | Tragic 12.8% |
| Sioux | 0.0 /100 | #275 | Tragic 12.8% |
| Hmong | 0.0 /100 | #276 | Tragic 12.8% |
| Dutch | 0.0 /100 | #277 | Tragic 12.8% |
| Germans | 0.0 /100 | #278 | Tragic 12.8% |
| Fijians | 0.0 /100 | #279 | Tragic 12.8% |
| Spanish | 0.0 /100 | #280 | Tragic 12.8% |
| Immigrants | Portugal | 0.0 /100 | #281 | Tragic 12.9% |
| Scottish | 0.0 /100 | #282 | Tragic 12.9% |
| Irish | 0.0 /100 | #283 | Tragic 12.9% |
| Welsh | 0.0 /100 | #284 | Tragic 12.9% |
| Crow | 0.0 /100 | #285 | Tragic 12.9% |