Alaska Native vs Czech 10th Grade
COMPARE
Alaska Native
Czech
10th Grade
10th Grade Comparison
Alaska Natives
Czechs
94.9%
10TH GRADE
99.6/ 100
METRIC RATING
71st/ 347
METRIC RANK
95.5%
10TH GRADE
100.0/ 100
METRIC RATING
23rd/ 347
METRIC RANK
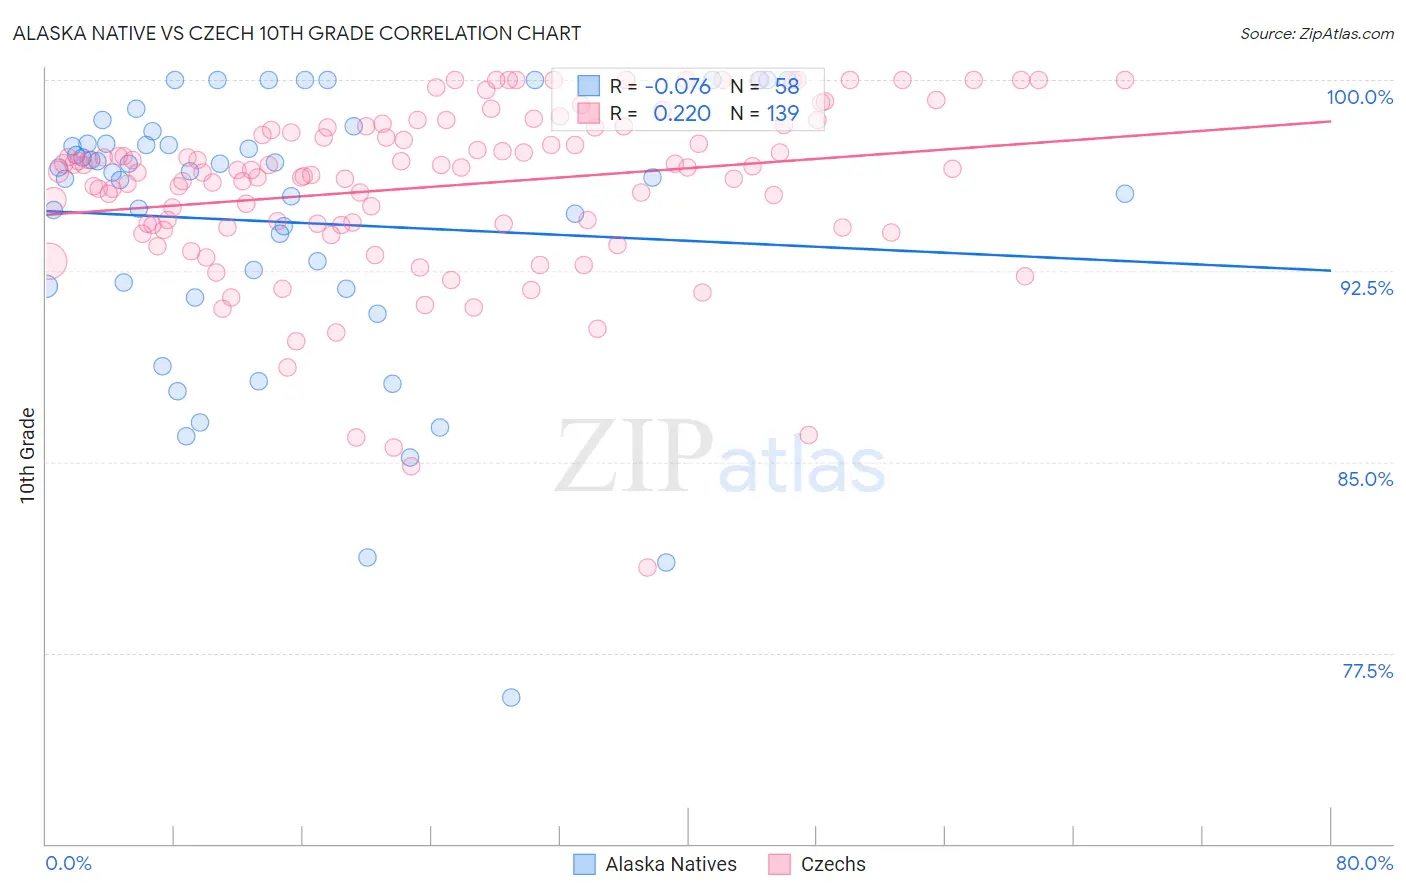
Alaska Native vs Czech 10th Grade Correlation Chart
The statistical analysis conducted on geographies consisting of 76,778,743 people shows a slight negative correlation between the proportion of Alaska Natives and percentage of population with at least 10th grade education in the United States with a correlation coefficient (R) of -0.076 and weighted average of 94.9%. Similarly, the statistical analysis conducted on geographies consisting of 484,813,928 people shows a weak positive correlation between the proportion of Czechs and percentage of population with at least 10th grade education in the United States with a correlation coefficient (R) of 0.220 and weighted average of 95.5%, a difference of 0.62%.
10th Grade Correlation Summary
| Measurement | Alaska Native | Czech |
| Minimum | 75.7% | 80.9% |
| Maximum | 100.0% | 100.0% |
| Range | 24.3% | 19.1% |
| Mean | 94.4% | 95.8% |
| Median | 96.4% | 96.5% |
| Interquartile 25% (IQ1) | 91.9% | 94.3% |
| Interquartile 75% (IQ3) | 97.5% | 98.1% |
| Interquartile Range (IQR) | 5.6% | 3.9% |
| Standard Deviation (Sample) | 5.4% | 3.4% |
| Standard Deviation (Population) | 5.4% | 3.4% |
Similar Demographics by 10th Grade
Demographics Similar to Alaska Natives by 10th Grade
In terms of 10th grade, the demographic groups most similar to Alaska Natives are Zimbabwean (94.9%, a difference of 0.0%), Immigrants from England (94.9%, a difference of 0.010%), Immigrants from Sweden (94.9%, a difference of 0.020%), Bhutanese (94.9%, a difference of 0.020%), and Canadian (94.9%, a difference of 0.020%).
| Demographics | Rating | Rank | 10th Grade |
| Native Hawaiians | 99.7 /100 | #64 | Exceptional 95.0% |
| Turks | 99.7 /100 | #65 | Exceptional 95.0% |
| Immigrants | Australia | 99.7 /100 | #66 | Exceptional 94.9% |
| Immigrants | Netherlands | 99.7 /100 | #67 | Exceptional 94.9% |
| Immigrants | Belgium | 99.7 /100 | #68 | Exceptional 94.9% |
| Immigrants | England | 99.6 /100 | #69 | Exceptional 94.9% |
| Zimbabweans | 99.6 /100 | #70 | Exceptional 94.9% |
| Alaska Natives | 99.6 /100 | #71 | Exceptional 94.9% |
| Immigrants | Sweden | 99.6 /100 | #72 | Exceptional 94.9% |
| Bhutanese | 99.6 /100 | #73 | Exceptional 94.9% |
| Canadians | 99.6 /100 | #74 | Exceptional 94.9% |
| Okinawans | 99.5 /100 | #75 | Exceptional 94.8% |
| Romanians | 99.5 /100 | #76 | Exceptional 94.8% |
| Immigrants | South Africa | 99.5 /100 | #77 | Exceptional 94.8% |
| Filipinos | 99.3 /100 | #78 | Exceptional 94.8% |
Demographics Similar to Czechs by 10th Grade
In terms of 10th grade, the demographic groups most similar to Czechs are Eastern European (95.5%, a difference of 0.010%), European (95.5%, a difference of 0.010%), Maltese (95.5%, a difference of 0.020%), Welsh (95.5%, a difference of 0.030%), and Dutch (95.5%, a difference of 0.050%).
| Demographics | Rating | Rank | 10th Grade |
| Scottish | 100.0 /100 | #16 | Exceptional 95.6% |
| Latvians | 100.0 /100 | #17 | Exceptional 95.6% |
| Italians | 100.0 /100 | #18 | Exceptional 95.6% |
| Scandinavians | 100.0 /100 | #19 | Exceptional 95.6% |
| Chinese | 100.0 /100 | #20 | Exceptional 95.5% |
| Dutch | 100.0 /100 | #21 | Exceptional 95.5% |
| Eastern Europeans | 100.0 /100 | #22 | Exceptional 95.5% |
| Czechs | 100.0 /100 | #23 | Exceptional 95.5% |
| Europeans | 100.0 /100 | #24 | Exceptional 95.5% |
| Maltese | 100.0 /100 | #25 | Exceptional 95.5% |
| Welsh | 100.0 /100 | #26 | Exceptional 95.5% |
| Alaskan Athabascans | 100.0 /100 | #27 | Exceptional 95.4% |
| Luxembourgers | 100.0 /100 | #28 | Exceptional 95.4% |
| Bulgarians | 100.0 /100 | #29 | Exceptional 95.4% |
| Belgians | 100.0 /100 | #30 | Exceptional 95.4% |