Alaska Native vs Czech Family Households with Children
COMPARE
Alaska Native
Czech
Family Households with Children
Family Households with Children Comparison
Alaska Natives
Czechs
29.9%
FAMILY HOUSEHOLDS WITH CHILDREN
100.0/ 100
METRIC RATING
19th/ 347
METRIC RANK
27.5%
FAMILY HOUSEHOLDS WITH CHILDREN
65.3/ 100
METRIC RATING
163rd/ 347
METRIC RANK
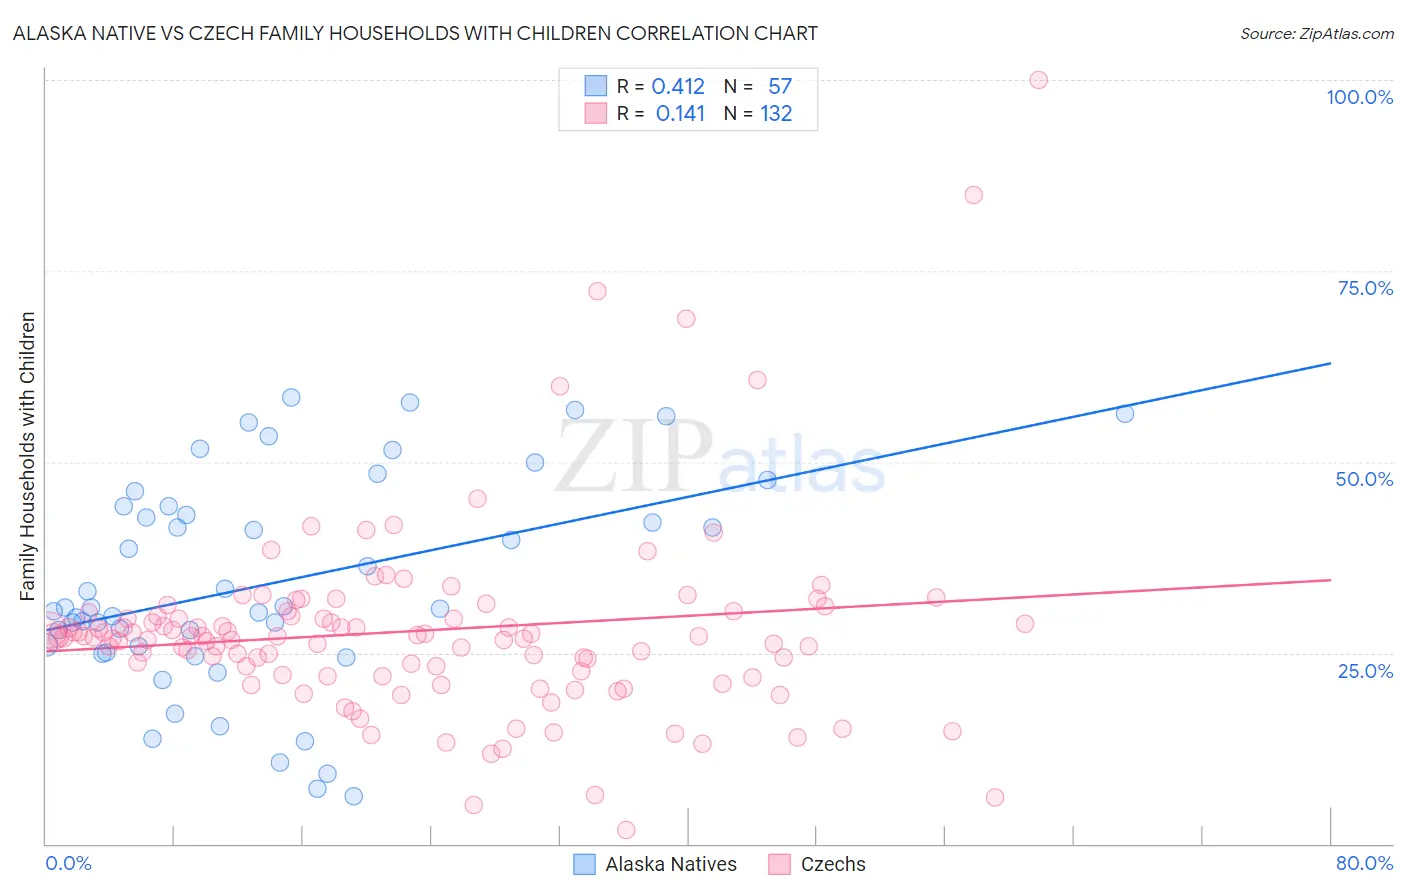
Alaska Native vs Czech Family Households with Children Correlation Chart
The statistical analysis conducted on geographies consisting of 76,746,516 people shows a moderate positive correlation between the proportion of Alaska Natives and percentage of family households with children in the United States with a correlation coefficient (R) of 0.412 and weighted average of 29.9%. Similarly, the statistical analysis conducted on geographies consisting of 484,223,997 people shows a poor positive correlation between the proportion of Czechs and percentage of family households with children in the United States with a correlation coefficient (R) of 0.141 and weighted average of 27.5%, a difference of 8.4%.
Family Households with Children Correlation Summary
| Measurement | Alaska Native | Czech |
| Minimum | 6.2% | 1.9% |
| Maximum | 58.5% | 100.0% |
| Range | 52.2% | 98.1% |
| Mean | 34.1% | 27.9% |
| Median | 30.9% | 27.1% |
| Interquartile 25% (IQ1) | 25.5% | 22.3% |
| Interquartile 75% (IQ3) | 44.2% | 29.8% |
| Interquartile Range (IQR) | 18.7% | 7.4% |
| Standard Deviation (Sample) | 13.9% | 12.9% |
| Standard Deviation (Population) | 13.7% | 12.8% |
Similar Demographics by Family Households with Children
Demographics Similar to Alaska Natives by Family Households with Children
In terms of family households with children, the demographic groups most similar to Alaska Natives are Immigrants from El Salvador (29.8%, a difference of 0.030%), Salvadoran (29.9%, a difference of 0.040%), Immigrants from Laos (29.8%, a difference of 0.070%), Malaysian (29.8%, a difference of 0.11%), and Hispanic or Latino (29.9%, a difference of 0.22%).
| Demographics | Rating | Rank | Family Households with Children |
| Immigrants | Pakistan | 100.0 /100 | #12 | Exceptional 30.2% |
| Afghans | 100.0 /100 | #13 | Exceptional 30.2% |
| Bangladeshis | 100.0 /100 | #14 | Exceptional 30.1% |
| Immigrants | South Central Asia | 100.0 /100 | #15 | Exceptional 30.0% |
| Immigrants | Afghanistan | 100.0 /100 | #16 | Exceptional 30.0% |
| Hispanics or Latinos | 100.0 /100 | #17 | Exceptional 29.9% |
| Salvadorans | 100.0 /100 | #18 | Exceptional 29.9% |
| Alaska Natives | 100.0 /100 | #19 | Exceptional 29.9% |
| Immigrants | El Salvador | 100.0 /100 | #20 | Exceptional 29.8% |
| Immigrants | Laos | 100.0 /100 | #21 | Exceptional 29.8% |
| Malaysians | 100.0 /100 | #22 | Exceptional 29.8% |
| Mexican American Indians | 100.0 /100 | #23 | Exceptional 29.7% |
| Guamanians/Chamorros | 100.0 /100 | #24 | Exceptional 29.7% |
| Immigrants | Latin America | 100.0 /100 | #25 | Exceptional 29.7% |
| Sri Lankans | 100.0 /100 | #26 | Exceptional 29.5% |
Demographics Similar to Czechs by Family Households with Children
In terms of family households with children, the demographic groups most similar to Czechs are Immigrants from Hong Kong (27.5%, a difference of 0.010%), Alaskan Athabascan (27.6%, a difference of 0.040%), Immigrants from Bangladesh (27.6%, a difference of 0.040%), Subsaharan African (27.6%, a difference of 0.050%), and Immigrants from South Africa (27.5%, a difference of 0.090%).
| Demographics | Rating | Rank | Family Households with Children |
| Hungarians | 74.6 /100 | #156 | Good 27.6% |
| Indians (Asian) | 71.6 /100 | #157 | Good 27.6% |
| Romanians | 70.8 /100 | #158 | Good 27.6% |
| Mongolians | 70.7 /100 | #159 | Good 27.6% |
| Sub-Saharan Africans | 67.5 /100 | #160 | Good 27.6% |
| Alaskan Athabascans | 67.1 /100 | #161 | Good 27.6% |
| Immigrants | Bangladesh | 67.0 /100 | #162 | Good 27.6% |
| Czechs | 65.3 /100 | #163 | Good 27.5% |
| Immigrants | Hong Kong | 64.9 /100 | #164 | Good 27.5% |
| Immigrants | South Africa | 61.3 /100 | #165 | Good 27.5% |
| Immigrants | Nonimmigrants | 61.2 /100 | #166 | Good 27.5% |
| Dominicans | 61.1 /100 | #167 | Good 27.5% |
| Immigrants | Kuwait | 60.9 /100 | #168 | Good 27.5% |
| Seminole | 56.9 /100 | #169 | Average 27.5% |
| Cherokee | 56.7 /100 | #170 | Average 27.5% |