African vs Immigrants from Czechoslovakia Associate's Degree
COMPARE
African
Immigrants from Czechoslovakia
Associate's Degree
Associate's Degree Comparison
Africans
Immigrants from Czechoslovakia
41.1%
ASSOCIATE'S DEGREE
0.2/ 100
METRIC RATING
265th/ 347
METRIC RANK
51.9%
ASSOCIATE'S DEGREE
99.8/ 100
METRIC RATING
56th/ 347
METRIC RANK
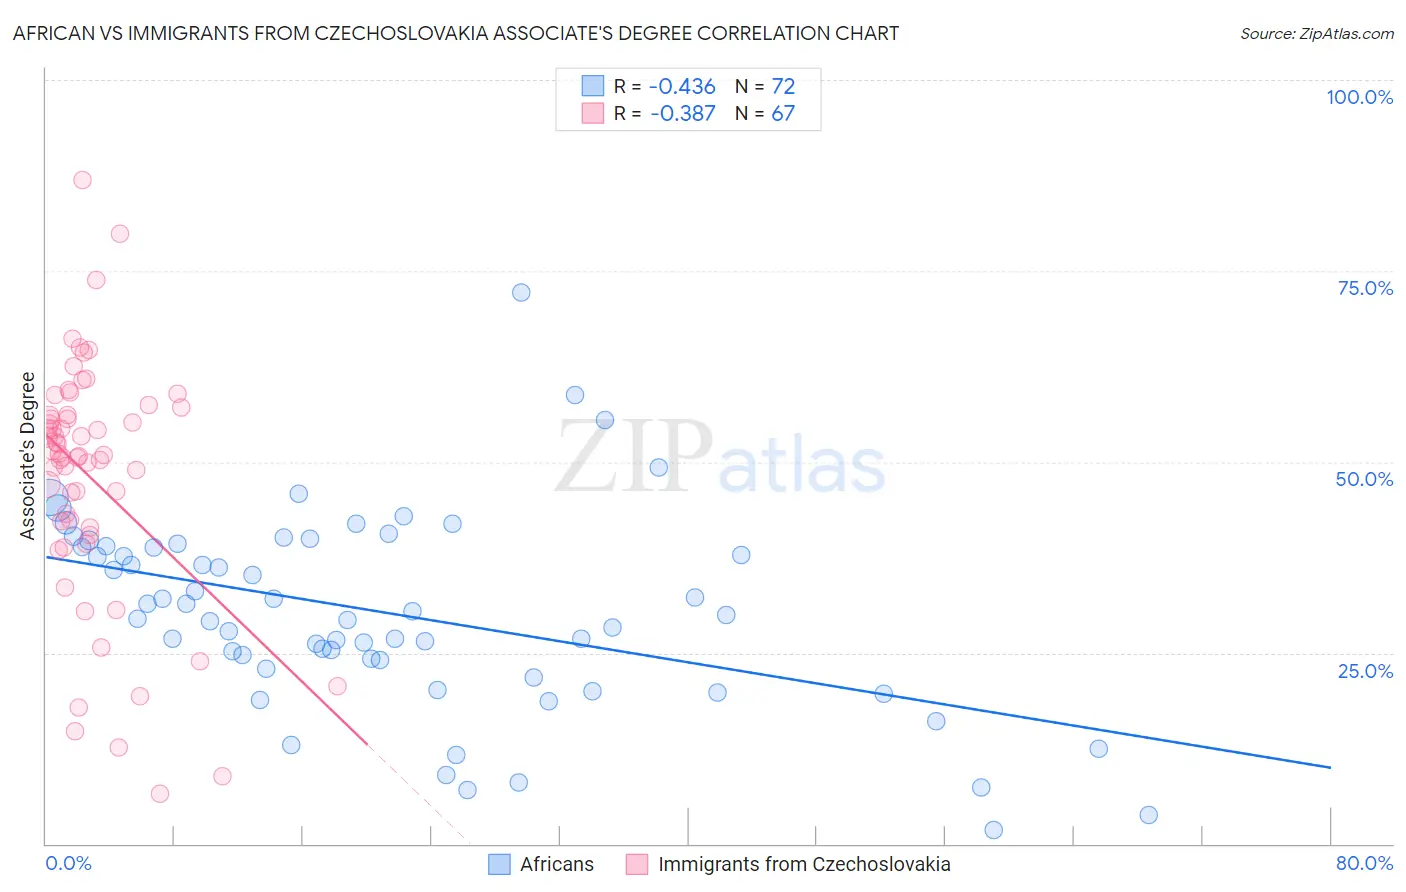
African vs Immigrants from Czechoslovakia Associate's Degree Correlation Chart
The statistical analysis conducted on geographies consisting of 470,057,267 people shows a moderate negative correlation between the proportion of Africans and percentage of population with at least associate's degree education in the United States with a correlation coefficient (R) of -0.436 and weighted average of 41.1%. Similarly, the statistical analysis conducted on geographies consisting of 195,448,477 people shows a mild negative correlation between the proportion of Immigrants from Czechoslovakia and percentage of population with at least associate's degree education in the United States with a correlation coefficient (R) of -0.387 and weighted average of 51.9%, a difference of 26.1%.
Associate's Degree Correlation Summary
| Measurement | African | Immigrants from Czechoslovakia |
| Minimum | 1.7% | 6.6% |
| Maximum | 72.2% | 86.9% |
| Range | 70.5% | 80.3% |
| Mean | 30.2% | 47.9% |
| Median | 29.7% | 50.9% |
| Interquartile 25% (IQ1) | 23.5% | 41.4% |
| Interquartile 75% (IQ3) | 38.9% | 56.2% |
| Interquartile Range (IQR) | 15.4% | 14.7% |
| Standard Deviation (Sample) | 12.9% | 15.9% |
| Standard Deviation (Population) | 12.8% | 15.8% |
Similar Demographics by Associate's Degree
Demographics Similar to Africans by Associate's Degree
In terms of associate's degree, the demographic groups most similar to Africans are Samoan (41.1%, a difference of 0.0%), Hawaiian (40.9%, a difference of 0.56%), Osage (41.5%, a difference of 0.76%), Central American Indian (40.8%, a difference of 0.76%), and Immigrants from Jamaica (41.5%, a difference of 0.77%).
| Demographics | Rating | Rank | Associate's Degree |
| Japanese | 0.5 /100 | #258 | Tragic 41.7% |
| Malaysians | 0.4 /100 | #259 | Tragic 41.6% |
| Marshallese | 0.4 /100 | #260 | Tragic 41.6% |
| Nicaraguans | 0.4 /100 | #261 | Tragic 41.5% |
| Bahamians | 0.4 /100 | #262 | Tragic 41.5% |
| Immigrants | Jamaica | 0.3 /100 | #263 | Tragic 41.5% |
| Osage | 0.3 /100 | #264 | Tragic 41.5% |
| Africans | 0.2 /100 | #265 | Tragic 41.1% |
| Samoans | 0.2 /100 | #266 | Tragic 41.1% |
| Hawaiians | 0.2 /100 | #267 | Tragic 40.9% |
| Central American Indians | 0.2 /100 | #268 | Tragic 40.8% |
| Americans | 0.2 /100 | #269 | Tragic 40.8% |
| Chippewa | 0.2 /100 | #270 | Tragic 40.7% |
| Immigrants | Laos | 0.1 /100 | #271 | Tragic 40.7% |
| Belizeans | 0.1 /100 | #272 | Tragic 40.6% |
Demographics Similar to Immigrants from Czechoslovakia by Associate's Degree
In terms of associate's degree, the demographic groups most similar to Immigrants from Czechoslovakia are Australian (51.9%, a difference of 0.020%), Immigrants from Spain (51.9%, a difference of 0.050%), Paraguayan (51.8%, a difference of 0.12%), Immigrants from Asia (52.0%, a difference of 0.15%), and New Zealander (51.8%, a difference of 0.15%).
| Demographics | Rating | Rank | Associate's Degree |
| Immigrants | Austria | 99.9 /100 | #49 | Exceptional 52.1% |
| Asians | 99.9 /100 | #50 | Exceptional 52.1% |
| Immigrants | Greece | 99.9 /100 | #51 | Exceptional 52.1% |
| Bolivians | 99.8 /100 | #52 | Exceptional 52.0% |
| Immigrants | Asia | 99.8 /100 | #53 | Exceptional 52.0% |
| Immigrants | Spain | 99.8 /100 | #54 | Exceptional 51.9% |
| Australians | 99.8 /100 | #55 | Exceptional 51.9% |
| Immigrants | Czechoslovakia | 99.8 /100 | #56 | Exceptional 51.9% |
| Paraguayans | 99.8 /100 | #57 | Exceptional 51.8% |
| New Zealanders | 99.8 /100 | #58 | Exceptional 51.8% |
| Immigrants | Serbia | 99.8 /100 | #59 | Exceptional 51.7% |
| Immigrants | Bolivia | 99.7 /100 | #60 | Exceptional 51.5% |
| Immigrants | Kazakhstan | 99.7 /100 | #61 | Exceptional 51.4% |
| Bhutanese | 99.7 /100 | #62 | Exceptional 51.4% |
| South Africans | 99.7 /100 | #63 | Exceptional 51.4% |