African vs Immigrants from Belize 9th Grade
COMPARE
African
Immigrants from Belize
9th Grade
9th Grade Comparison
Africans
Immigrants from Belize
94.5%
9TH GRADE
9.0/ 100
METRIC RATING
219th/ 347
METRIC RANK
91.8%
9TH GRADE
0.0/ 100
METRIC RATING
324th/ 347
METRIC RANK
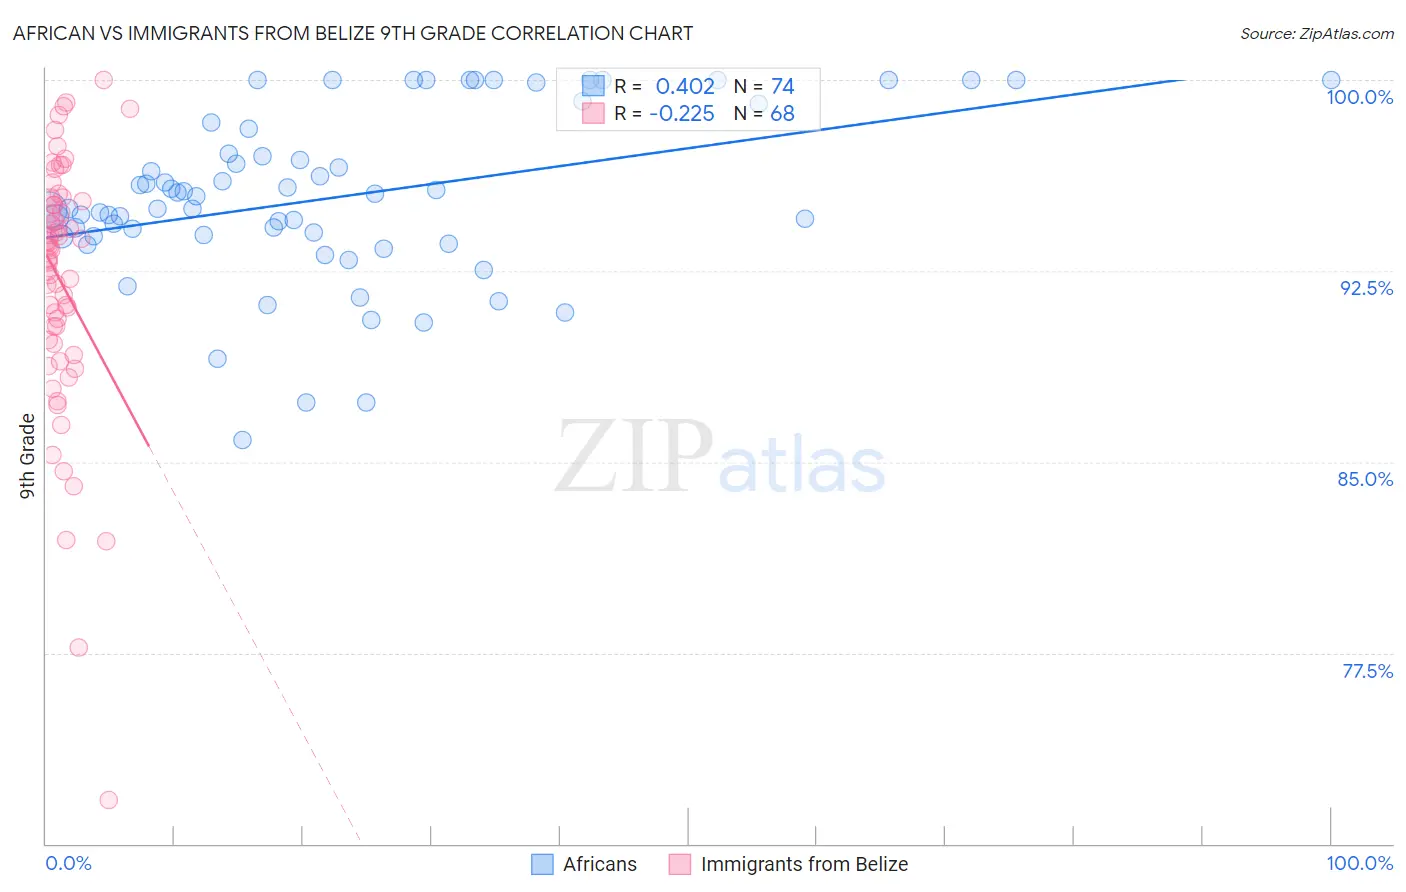
African vs Immigrants from Belize 9th Grade Correlation Chart
The statistical analysis conducted on geographies consisting of 470,094,658 people shows a moderate positive correlation between the proportion of Africans and percentage of population with at least 9th grade education in the United States with a correlation coefficient (R) of 0.402 and weighted average of 94.5%. Similarly, the statistical analysis conducted on geographies consisting of 130,181,087 people shows a weak negative correlation between the proportion of Immigrants from Belize and percentage of population with at least 9th grade education in the United States with a correlation coefficient (R) of -0.225 and weighted average of 91.8%, a difference of 2.9%.
9th Grade Correlation Summary
| Measurement | African | Immigrants from Belize |
| Minimum | 85.8% | 71.7% |
| Maximum | 100.0% | 100.0% |
| Range | 14.2% | 28.3% |
| Mean | 95.4% | 92.0% |
| Median | 95.2% | 93.2% |
| Interquartile 25% (IQ1) | 93.9% | 89.7% |
| Interquartile 75% (IQ3) | 98.1% | 95.2% |
| Interquartile Range (IQR) | 4.2% | 5.5% |
| Standard Deviation (Sample) | 3.3% | 5.1% |
| Standard Deviation (Population) | 3.3% | 5.0% |
Similar Demographics by 9th Grade
Demographics Similar to Africans by 9th Grade
In terms of 9th grade, the demographic groups most similar to Africans are Portuguese (94.5%, a difference of 0.0%), Indian (Asian) (94.5%, a difference of 0.010%), Asian (94.5%, a difference of 0.020%), Immigrants from Eastern Africa (94.5%, a difference of 0.020%), and Immigrants from Asia (94.4%, a difference of 0.030%).
| Demographics | Rating | Rank | 9th Grade |
| Immigrants | Malaysia | 12.2 /100 | #212 | Poor 94.5% |
| Immigrants | Oceania | 12.1 /100 | #213 | Poor 94.5% |
| Immigrants | Liberia | 11.8 /100 | #214 | Poor 94.5% |
| Immigrants | Syria | 11.0 /100 | #215 | Poor 94.5% |
| Immigrants | Western Asia | 10.7 /100 | #216 | Poor 94.5% |
| Asians | 9.9 /100 | #217 | Tragic 94.5% |
| Portuguese | 9.2 /100 | #218 | Tragic 94.5% |
| Africans | 9.0 /100 | #219 | Tragic 94.5% |
| Indians (Asian) | 8.6 /100 | #220 | Tragic 94.5% |
| Immigrants | Eastern Africa | 8.2 /100 | #221 | Tragic 94.5% |
| Immigrants | Asia | 7.7 /100 | #222 | Tragic 94.4% |
| Bahamians | 7.0 /100 | #223 | Tragic 94.4% |
| Tongans | 6.0 /100 | #224 | Tragic 94.4% |
| Ethiopians | 5.4 /100 | #225 | Tragic 94.4% |
| Sub-Saharan Africans | 5.4 /100 | #226 | Tragic 94.4% |
Demographics Similar to Immigrants from Belize by 9th Grade
In terms of 9th grade, the demographic groups most similar to Immigrants from Belize are Belizean (91.8%, a difference of 0.060%), Puerto Rican (91.8%, a difference of 0.060%), Immigrants from Ecuador (91.8%, a difference of 0.090%), Nicaraguan (91.9%, a difference of 0.16%), and Ecuadorian (91.9%, a difference of 0.20%).
| Demographics | Rating | Rank | 9th Grade |
| Immigrants | Cuba | 0.0 /100 | #317 | Tragic 92.2% |
| Nepalese | 0.0 /100 | #318 | Tragic 92.0% |
| Ecuadorians | 0.0 /100 | #319 | Tragic 91.9% |
| Nicaraguans | 0.0 /100 | #320 | Tragic 91.9% |
| Immigrants | Ecuador | 0.0 /100 | #321 | Tragic 91.8% |
| Belizeans | 0.0 /100 | #322 | Tragic 91.8% |
| Puerto Ricans | 0.0 /100 | #323 | Tragic 91.8% |
| Immigrants | Belize | 0.0 /100 | #324 | Tragic 91.8% |
| Central American Indians | 0.0 /100 | #325 | Tragic 91.5% |
| Immigrants | Armenia | 0.0 /100 | #326 | Tragic 91.4% |
| Immigrants | Nicaragua | 0.0 /100 | #327 | Tragic 91.3% |
| Dominicans | 0.0 /100 | #328 | Tragic 91.1% |
| Hondurans | 0.0 /100 | #329 | Tragic 91.0% |
| Immigrants | Cabo Verde | 0.0 /100 | #330 | Tragic 90.9% |
| Mexican American Indians | 0.0 /100 | #331 | Tragic 90.9% |