African vs Immigrants from Belize 1st Grade
COMPARE
African
Immigrants from Belize
1st Grade
1st Grade Comparison
Africans
Immigrants from Belize
97.8%
1ST GRADE
16.5/ 100
METRIC RATING
207th/ 347
METRIC RANK
96.9%
1ST GRADE
0.0/ 100
METRIC RATING
315th/ 347
METRIC RANK
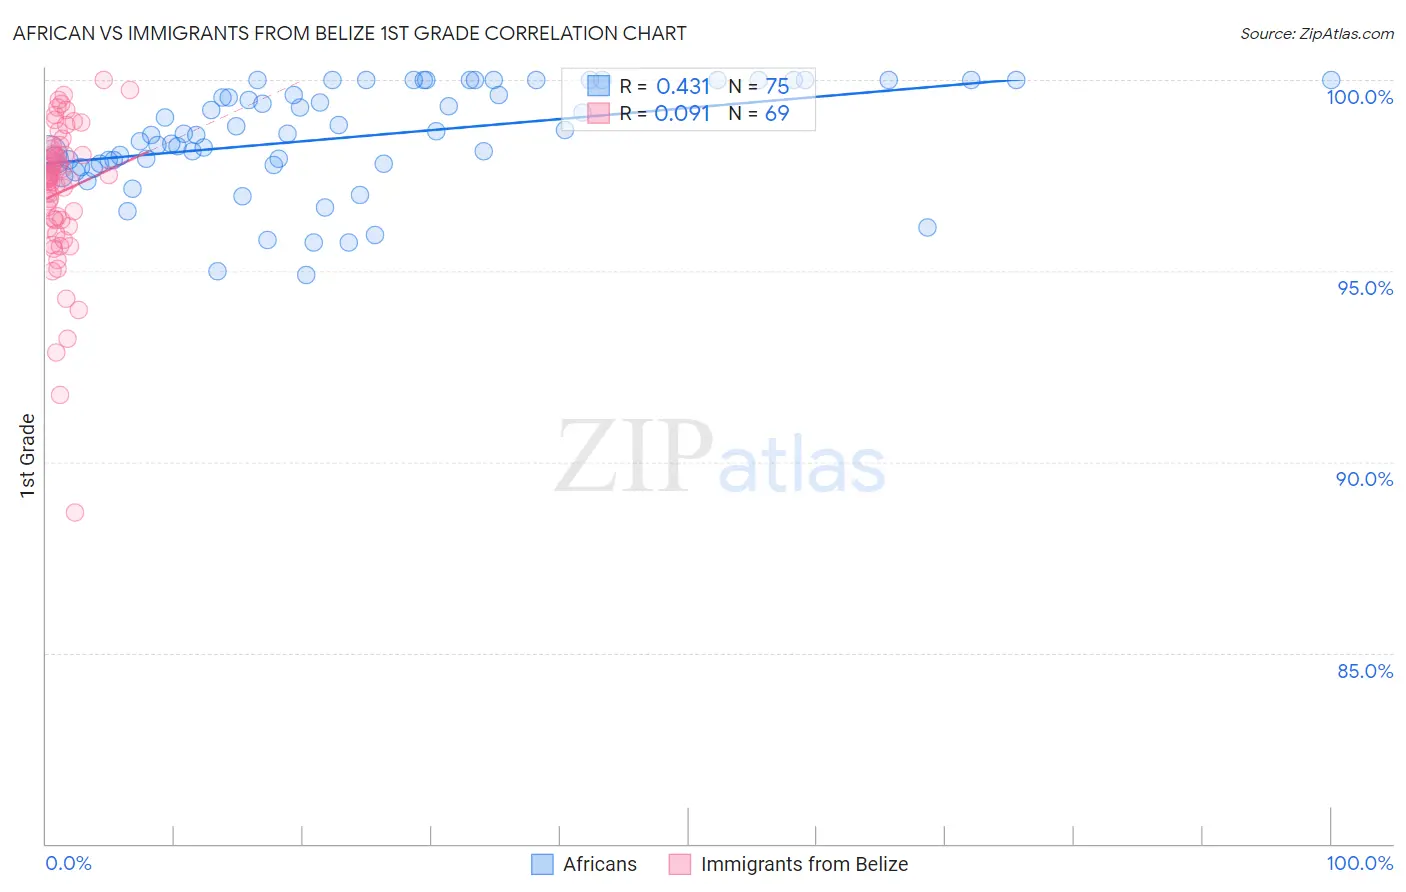
African vs Immigrants from Belize 1st Grade Correlation Chart
The statistical analysis conducted on geographies consisting of 470,094,148 people shows a moderate positive correlation between the proportion of Africans and percentage of population with at least 1st grade education in the United States with a correlation coefficient (R) of 0.431 and weighted average of 97.8%. Similarly, the statistical analysis conducted on geographies consisting of 130,328,311 people shows a slight positive correlation between the proportion of Immigrants from Belize and percentage of population with at least 1st grade education in the United States with a correlation coefficient (R) of 0.091 and weighted average of 96.9%, a difference of 0.96%.
1st Grade Correlation Summary
| Measurement | African | Immigrants from Belize |
| Minimum | 94.9% | 88.7% |
| Maximum | 100.0% | 100.0% |
| Range | 5.1% | 11.3% |
| Mean | 98.5% | 97.1% |
| Median | 98.6% | 97.5% |
| Interquartile 25% (IQ1) | 97.8% | 96.2% |
| Interquartile 75% (IQ3) | 100.0% | 98.1% |
| Interquartile Range (IQR) | 2.2% | 1.9% |
| Standard Deviation (Sample) | 1.4% | 1.9% |
| Standard Deviation (Population) | 1.4% | 1.9% |
Similar Demographics by 1st Grade
Demographics Similar to Africans by 1st Grade
In terms of 1st grade, the demographic groups most similar to Africans are Immigrants from Albania (97.8%, a difference of 0.0%), Immigrants from Ukraine (97.8%, a difference of 0.010%), Immigrants from Southern Europe (97.8%, a difference of 0.010%), Immigrants from Uganda (97.8%, a difference of 0.010%), and Immigrants from Chile (97.8%, a difference of 0.010%).
| Demographics | Rating | Rank | 1st Grade |
| Immigrants | Egypt | 22.6 /100 | #200 | Fair 97.8% |
| Immigrants | Lebanon | 20.1 /100 | #201 | Fair 97.8% |
| Immigrants | Ukraine | 19.2 /100 | #202 | Poor 97.8% |
| Immigrants | Southern Europe | 18.2 /100 | #203 | Poor 97.8% |
| Immigrants | Uganda | 18.2 /100 | #204 | Poor 97.8% |
| Immigrants | Chile | 17.7 /100 | #205 | Poor 97.8% |
| Immigrants | Albania | 17.3 /100 | #206 | Poor 97.8% |
| Africans | 16.5 /100 | #207 | Poor 97.8% |
| Immigrants | Northern Africa | 12.0 /100 | #208 | Poor 97.8% |
| Costa Ricans | 11.6 /100 | #209 | Poor 97.8% |
| Immigrants | Oceania | 11.0 /100 | #210 | Poor 97.8% |
| Laotians | 10.3 /100 | #211 | Poor 97.8% |
| Moroccans | 8.7 /100 | #212 | Tragic 97.7% |
| Immigrants | Bahamas | 8.1 /100 | #213 | Tragic 97.7% |
| South American Indians | 7.6 /100 | #214 | Tragic 97.7% |
Demographics Similar to Immigrants from Belize by 1st Grade
In terms of 1st grade, the demographic groups most similar to Immigrants from Belize are Honduran (96.9%, a difference of 0.010%), Immigrants from Ecuador (96.9%, a difference of 0.010%), Immigrants from Nicaragua (96.9%, a difference of 0.010%), Cape Verdean (96.9%, a difference of 0.030%), and Guyanese (96.9%, a difference of 0.030%).
| Demographics | Rating | Rank | 1st Grade |
| Hispanics or Latinos | 0.0 /100 | #308 | Tragic 96.9% |
| Immigrants | Haiti | 0.0 /100 | #309 | Tragic 96.9% |
| Immigrants | Azores | 0.0 /100 | #310 | Tragic 96.9% |
| Sri Lankans | 0.0 /100 | #311 | Tragic 96.9% |
| Cape Verdeans | 0.0 /100 | #312 | Tragic 96.9% |
| Guyanese | 0.0 /100 | #313 | Tragic 96.9% |
| Hondurans | 0.0 /100 | #314 | Tragic 96.9% |
| Immigrants | Belize | 0.0 /100 | #315 | Tragic 96.9% |
| Immigrants | Ecuador | 0.0 /100 | #316 | Tragic 96.9% |
| Immigrants | Nicaragua | 0.0 /100 | #317 | Tragic 96.9% |
| Immigrants | Laos | 0.0 /100 | #318 | Tragic 96.8% |
| Immigrants | Guyana | 0.0 /100 | #319 | Tragic 96.8% |
| Immigrants | Burma/Myanmar | 0.0 /100 | #320 | Tragic 96.8% |
| Immigrants | Bangladesh | 0.0 /100 | #321 | Tragic 96.8% |
| Mexican American Indians | 0.0 /100 | #322 | Tragic 96.8% |