Twisp, WA Map & Demographics
Twisp Map
Twisp Overview
$37,779
PER CAPITA INCOME
$67,188
AVG FAMILY INCOME
$52,054
AVG HOUSEHOLD INCOME
69.4%
WAGE / INCOME GAP [ % ]
30.6¢/ $1
WAGE / INCOME GAP [ $ ]
0.50
INEQUALITY / GINI INDEX
1,095
TOTAL POPULATION
537
MALE POPULATION
558
FEMALE POPULATION
96.24
MALES / 100 FEMALES
103.91
FEMALES / 100 MALES
45.4
MEDIAN AGE
2.5
AVG FAMILY SIZE
2.0
AVG HOUSEHOLD SIZE
543
LABOR FORCE [ PEOPLE ]
59.5%
PERCENT IN LABOR FORCE
10.3%
UNEMPLOYMENT RATE
Twisp Zip Codes
Twisp Area Codes
Income in Twisp
Income Overview in Twisp
Per Capita Income in Twisp is $37,779, while median incomes of families and households are $67,188 and $52,054 respectively.
| Characteristic | Number | Measure |
| Per Capita Income | 1,095 | $37,779 |
| Median Family Income | 315 | $67,188 |
| Mean Family Income | 315 | $103,374 |
| Median Household Income | 535 | $52,054 |
| Mean Household Income | 535 | $80,044 |
| Income Deficit | 315 | $0 |
| Wage / Income Gap (%) | 1,095 | 69.43% |
| Wage / Income Gap ($) | 1,095 | 30.57¢ per $1 |
| Gini / Inequality Index | 1,095 | 0.50 |
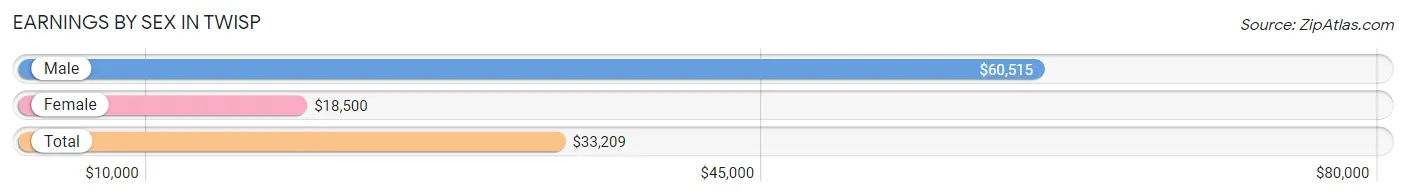
Earnings by Sex in Twisp
Average Earnings in Twisp are $33,209, $60,515 for men and $18,500 for women, a difference of 69.4%.
| Sex | Number | Average Earnings |
| Male | 287 (50.4%) | $60,515 |
| Female | 282 (49.6%) | $18,500 |
| Total | 569 (100.0%) | $33,209 |
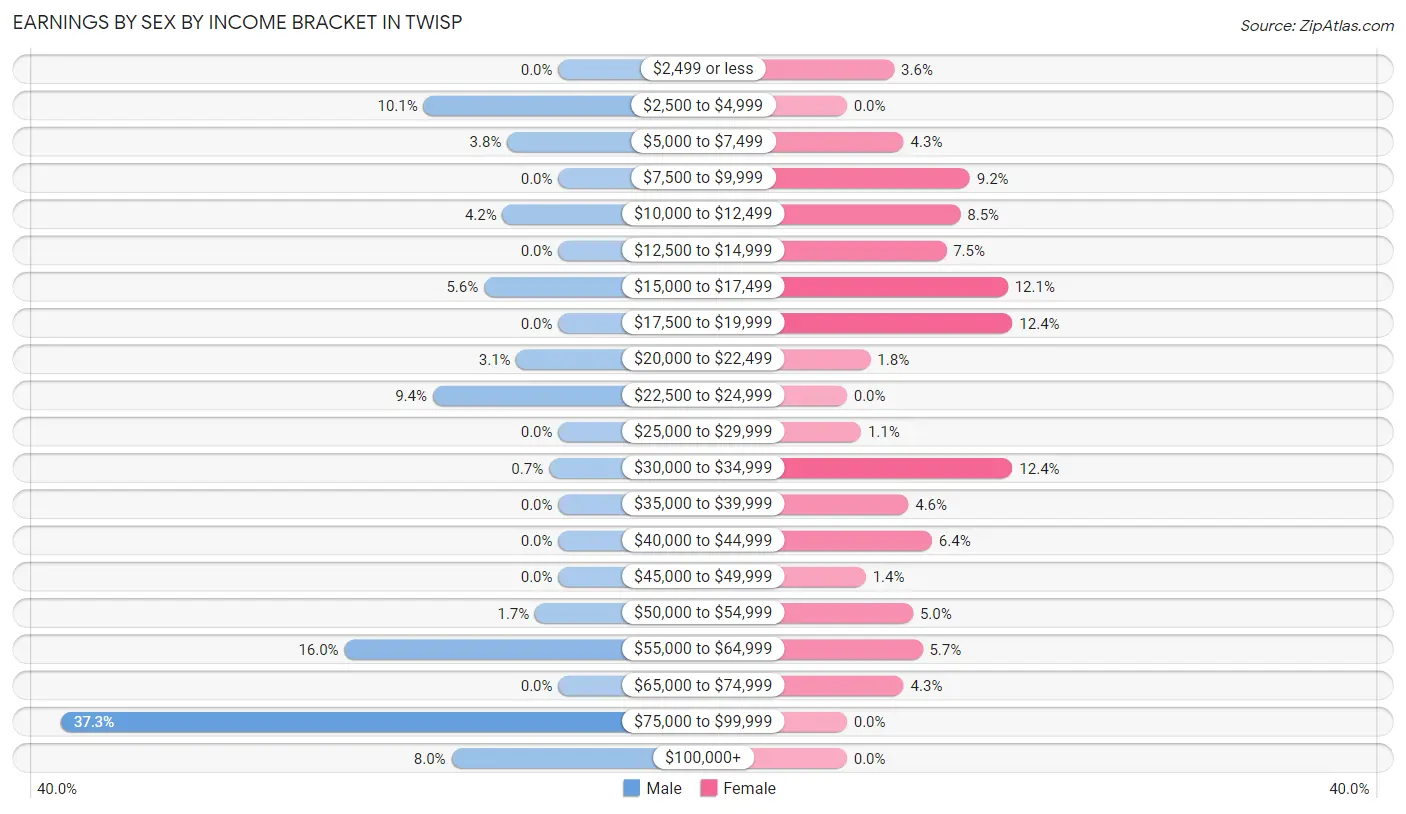
Earnings by Sex by Income Bracket in Twisp
The most common earnings brackets in Twisp are $75,000 to $99,999 for men (107 | 37.3%) and $17,500 to $19,999 for women (35 | 12.4%).
| Income | Male | Female |
| $2,499 or less | 0 (0.0%) | 10 (3.5%) |
| $2,500 to $4,999 | 29 (10.1%) | 0 (0.0%) |
| $5,000 to $7,499 | 11 (3.8%) | 12 (4.3%) |
| $7,500 to $9,999 | 0 (0.0%) | 26 (9.2%) |
| $10,000 to $12,499 | 12 (4.2%) | 24 (8.5%) |
| $12,500 to $14,999 | 0 (0.0%) | 21 (7.4%) |
| $15,000 to $17,499 | 16 (5.6%) | 34 (12.1%) |
| $17,500 to $19,999 | 0 (0.0%) | 35 (12.4%) |
| $20,000 to $22,499 | 9 (3.1%) | 5 (1.8%) |
| $22,500 to $24,999 | 27 (9.4%) | 0 (0.0%) |
| $25,000 to $29,999 | 0 (0.0%) | 3 (1.1%) |
| $30,000 to $34,999 | 2 (0.7%) | 35 (12.4%) |
| $35,000 to $39,999 | 0 (0.0%) | 13 (4.6%) |
| $40,000 to $44,999 | 0 (0.0%) | 18 (6.4%) |
| $45,000 to $49,999 | 0 (0.0%) | 4 (1.4%) |
| $50,000 to $54,999 | 5 (1.7%) | 14 (5.0%) |
| $55,000 to $64,999 | 46 (16.0%) | 16 (5.7%) |
| $65,000 to $74,999 | 0 (0.0%) | 12 (4.3%) |
| $75,000 to $99,999 | 107 (37.3%) | 0 (0.0%) |
| $100,000+ | 23 (8.0%) | 0 (0.0%) |
| Total | 287 (100.0%) | 282 (100.0%) |
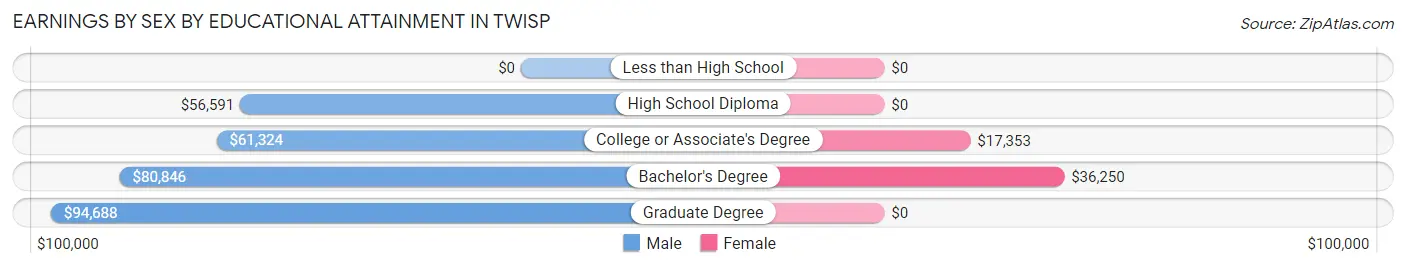
Earnings by Sex by Educational Attainment in Twisp
Average earnings in Twisp are $80,327 for men and $18,464 for women, a difference of 77.0%. Men with an educational attainment of graduate degree enjoy the highest average annual earnings of $94,688, while those with high school diploma education earn the least with $56,591. Women with an educational attainment of bachelor's degree earn the most with the average annual earnings of $36,250, while those with college or associate's degree education have the smallest earnings of $17,353.
| Educational Attainment | Male Income | Female Income |
| Less than High School | - | - |
| High School Diploma | $56,591 | $0 |
| College or Associate's Degree | $61,324 | $17,353 |
| Bachelor's Degree | $80,846 | $36,250 |
| Graduate Degree | $94,688 | $0 |
| Total | $80,327 | $18,464 |
Family Income in Twisp
Family Income Brackets in Twisp
According to the Twisp family income data, there are 89 families falling into the $50,000 to $74,999 income range, which is the most common income bracket and makes up 28.2% of all families.
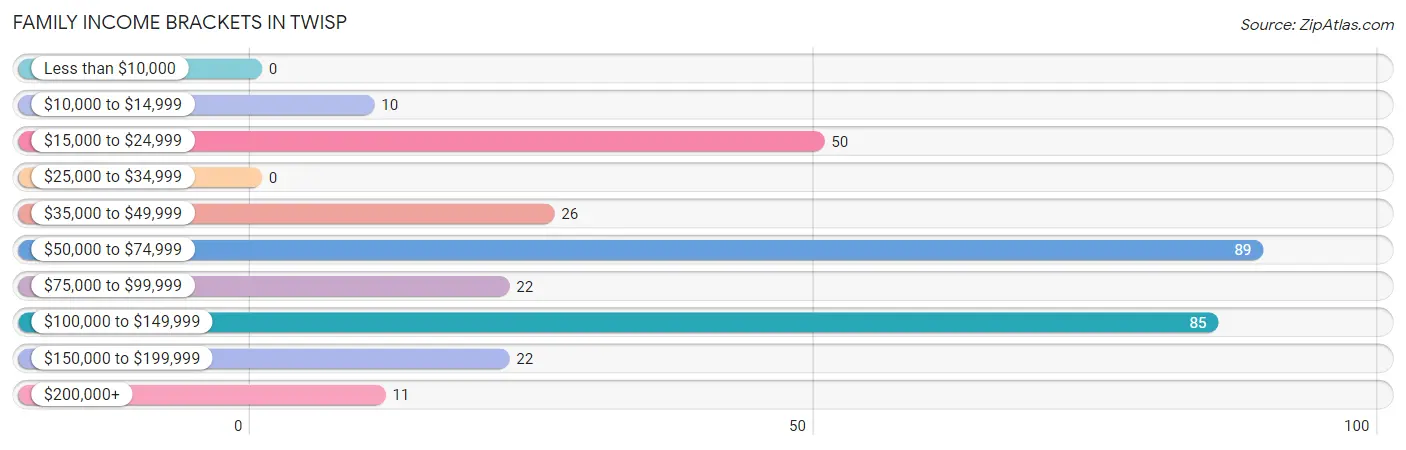
| Income Bracket | # Families | % Families |
| Less than $10,000 | 0 | 0.0% |
| $10,000 to $14,999 | 10 | 3.2% |
| $15,000 to $24,999 | 50 | 15.9% |
| $25,000 to $34,999 | 0 | 0.0% |
| $35,000 to $49,999 | 26 | 8.3% |
| $50,000 to $74,999 | 89 | 28.3% |
| $75,000 to $99,999 | 22 | 7.0% |
| $100,000 to $149,999 | 85 | 27.0% |
| $150,000 to $199,999 | 22 | 7.0% |
| $200,000+ | 11 | 3.5% |
Family Income by Famaliy Size in Twisp
4-person families (78 | 24.8%) account for the highest median family income in Twisp with $128,731 per family, while 4-person families (78 | 24.8%) have the highest median income of $32,183 per family member.
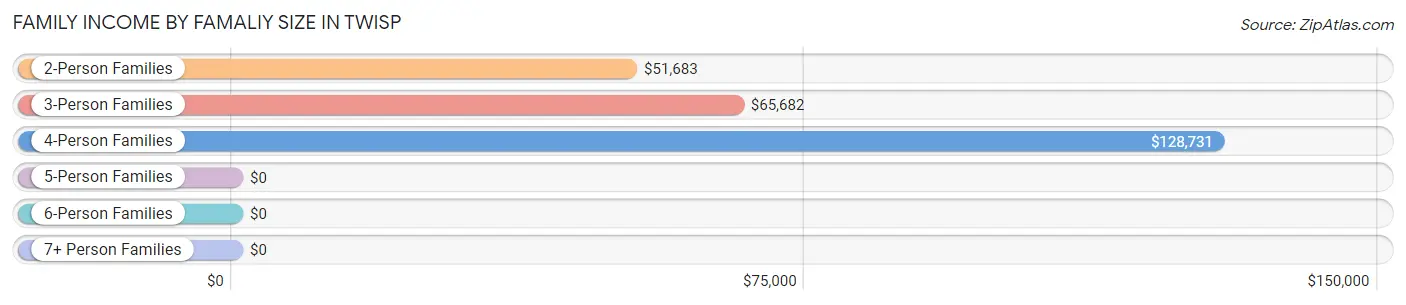
| Income Bracket | # Families | Median Income |
| 2-Person Families | 183 (58.1%) | $51,683 |
| 3-Person Families | 30 (9.5%) | $65,682 |
| 4-Person Families | 78 (24.8%) | $128,731 |
| 5-Person Families | 24 (7.6%) | $0 |
| 6-Person Families | 0 (0.0%) | $0 |
| 7+ Person Families | 0 (0.0%) | $0 |
| Total | 315 (100.0%) | $67,188 |
Family Income by Number of Earners in Twisp
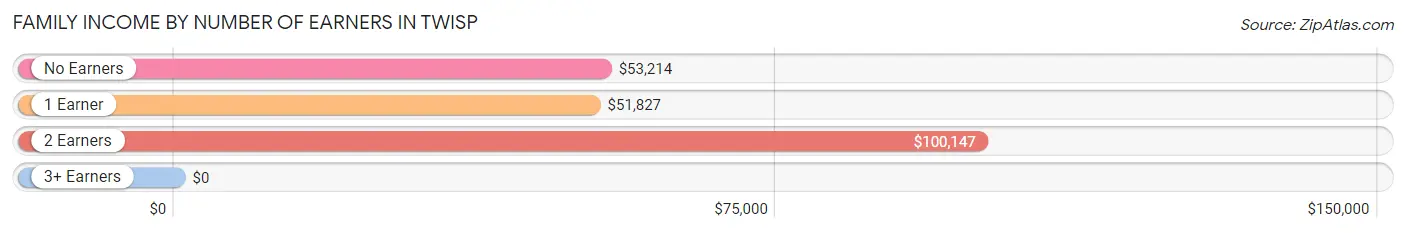
| Number of Earners | # Families | Median Income |
| No Earners | 86 (27.3%) | $53,214 |
| 1 Earner | 82 (26.0%) | $51,827 |
| 2 Earners | 82 (26.0%) | $100,147 |
| 3+ Earners | 65 (20.6%) | $0 |
| Total | 315 (100.0%) | $67,188 |
Household Income in Twisp
Household Income Brackets in Twisp
With 134 households falling in the category, the $15,000 to $24,999 income range is the most frequent in Twisp, accounting for 25.1% of all households.
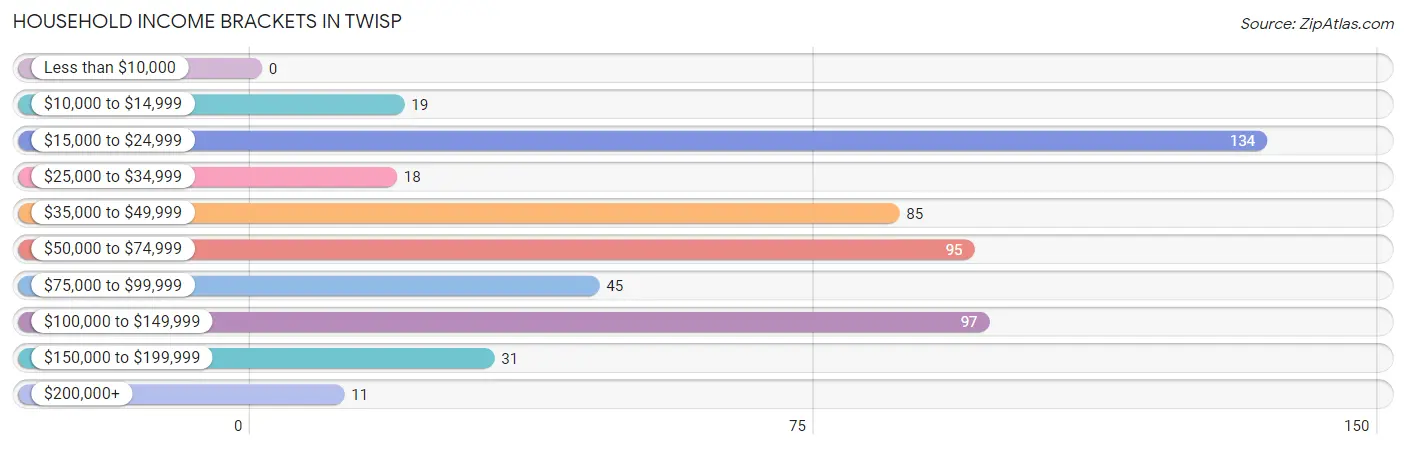
| Income Bracket | # Households | % Households |
| Less than $10,000 | 0 | 0.0% |
| $10,000 to $14,999 | 19 | 3.6% |
| $15,000 to $24,999 | 134 | 25.0% |
| $25,000 to $34,999 | 18 | 3.4% |
| $35,000 to $49,999 | 85 | 15.9% |
| $50,000 to $74,999 | 95 | 17.8% |
| $75,000 to $99,999 | 45 | 8.4% |
| $100,000 to $149,999 | 97 | 18.1% |
| $150,000 to $199,999 | 31 | 5.8% |
| $200,000+ | 11 | 2.1% |
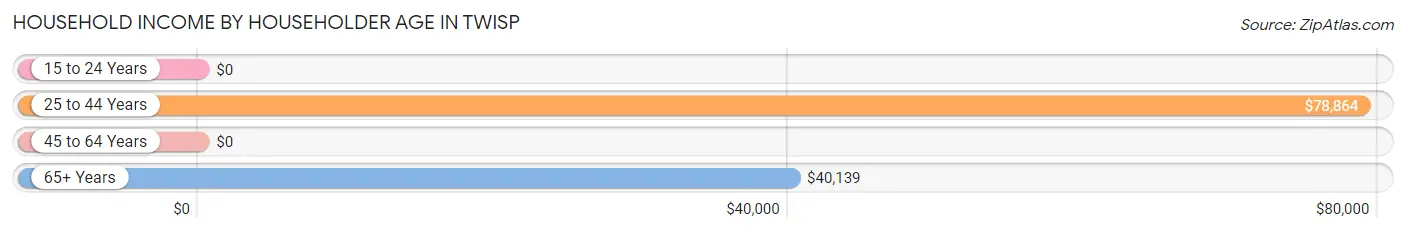
Household Income by Householder Age in Twisp
The median household income in Twisp is $52,054, with the highest median household income of $78,864 found in the 25 to 44 years age bracket for the primary householder. A total of 144 households (26.9%) fall into this category. Meanwhile, the 15 to 24 years age bracket for the primary householder has the lowest median household income of $0, with 7 households (1.3%) in this group.
| Income Bracket | # Households | Median Income |
| 15 to 24 Years | 7 (1.3%) | $0 |
| 25 to 44 Years | 144 (26.9%) | $78,864 |
| 45 to 64 Years | 167 (31.2%) | $0 |
| 65+ Years | 217 (40.6%) | $40,139 |
| Total | 535 (100.0%) | $52,054 |
Poverty in Twisp
Income Below Poverty by Sex and Age in Twisp
With 11.4% poverty level for males and 10.0% for females among the residents of Twisp, 6 to 11 year old males and under 5 year old females are the most vulnerable to poverty, with 24 males (47.1%) and 15 females (100.0%) in their respective age groups living below the poverty level.
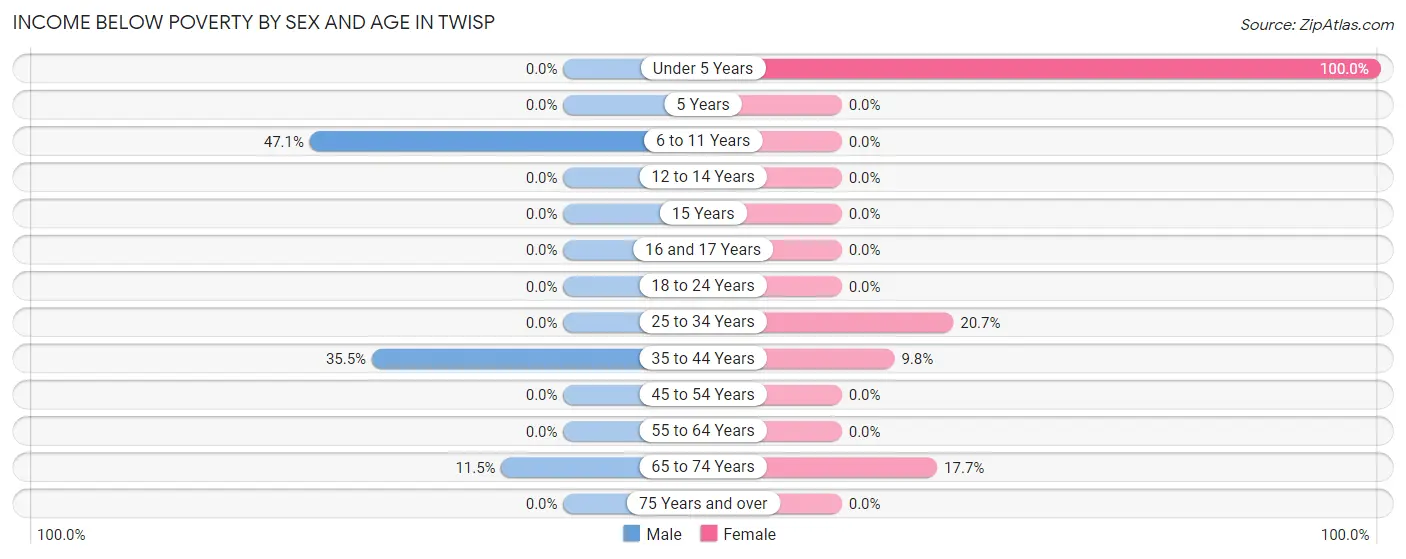
| Age Bracket | Male | Female |
| Under 5 Years | 0 (0.0%) | 15 (100.0%) |
| 5 Years | 0 (0.0%) | 0 (0.0%) |
| 6 to 11 Years | 24 (47.1%) | 0 (0.0%) |
| 12 to 14 Years | 0 (0.0%) | 0 (0.0%) |
| 15 Years | 0 (0.0%) | 0 (0.0%) |
| 16 and 17 Years | 0 (0.0%) | 0 (0.0%) |
| 18 to 24 Years | 0 (0.0%) | 0 (0.0%) |
| 25 to 34 Years | 0 (0.0%) | 12 (20.7%) |
| 35 to 44 Years | 27 (35.5%) | 9 (9.8%) |
| 45 to 54 Years | 0 (0.0%) | 0 (0.0%) |
| 55 to 64 Years | 0 (0.0%) | 0 (0.0%) |
| 65 to 74 Years | 10 (11.5%) | 20 (17.7%) |
| 75 Years and over | 0 (0.0%) | 0 (0.0%) |
| Total | 61 (11.4%) | 56 (10.0%) |
Income Above Poverty by Sex and Age in Twisp
According to the poverty statistics in Twisp, males aged under 5 years and females aged 5 years are the age groups that are most secure financially, with 100.0% of males and 100.0% of females in these age groups living above the poverty line.
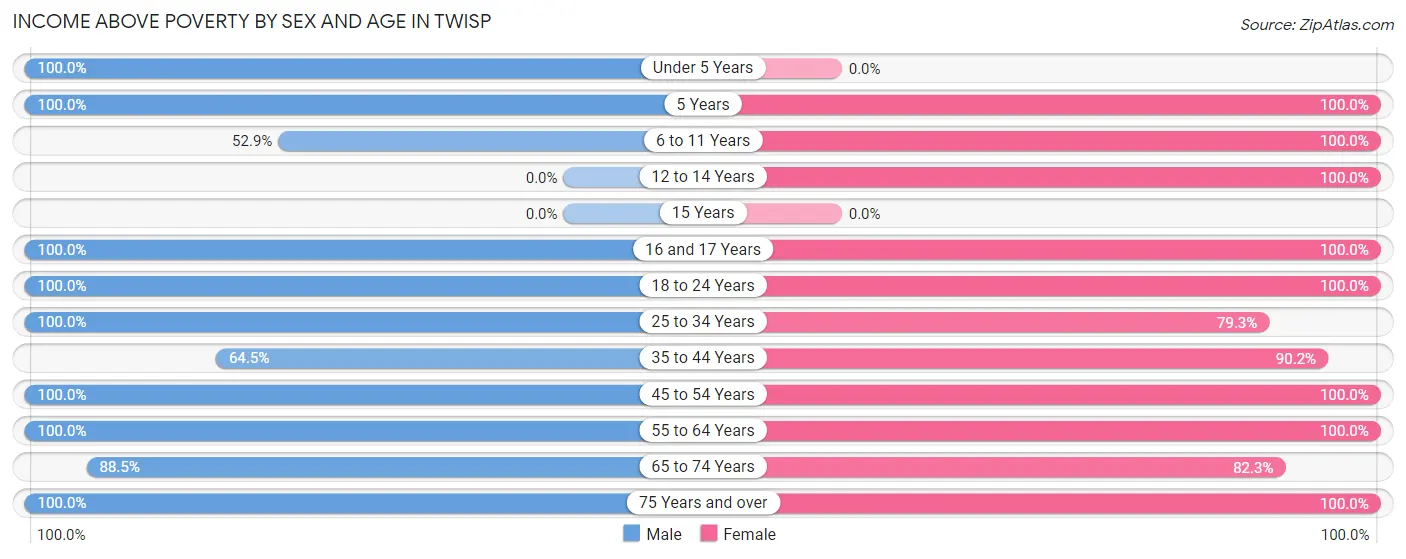
| Age Bracket | Male | Female |
| Under 5 Years | 6 (100.0%) | 0 (0.0%) |
| 5 Years | 18 (100.0%) | 10 (100.0%) |
| 6 to 11 Years | 27 (52.9%) | 70 (100.0%) |
| 12 to 14 Years | 0 (0.0%) | 12 (100.0%) |
| 15 Years | 0 (0.0%) | 0 (0.0%) |
| 16 and 17 Years | 12 (100.0%) | 4 (100.0%) |
| 18 to 24 Years | 56 (100.0%) | 5 (100.0%) |
| 25 to 34 Years | 37 (100.0%) | 46 (79.3%) |
| 35 to 44 Years | 49 (64.5%) | 83 (90.2%) |
| 45 to 54 Years | 76 (100.0%) | 41 (100.0%) |
| 55 to 64 Years | 45 (100.0%) | 79 (100.0%) |
| 65 to 74 Years | 77 (88.5%) | 93 (82.3%) |
| 75 Years and over | 73 (100.0%) | 59 (100.0%) |
| Total | 476 (88.6%) | 502 (90.0%) |
Income Below Poverty Among Married-Couple Families in Twisp
The poverty statistics for married-couple families in Twisp show that 4.0% or 10 of the total 252 families live below the poverty line. Families with no children have the highest poverty rate of 6.7%, comprising of 10 families. On the other hand, families with 1 or 2 children have the lowest poverty rate of 0.0%, which includes 0 families.
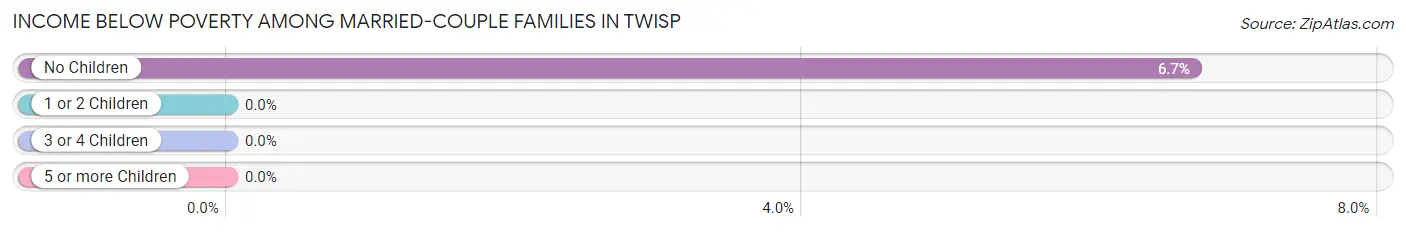
| Children | Above Poverty | Below Poverty |
| No Children | 139 (93.3%) | 10 (6.7%) |
| 1 or 2 Children | 91 (100.0%) | 0 (0.0%) |
| 3 or 4 Children | 12 (100.0%) | 0 (0.0%) |
| 5 or more Children | 0 (0.0%) | 0 (0.0%) |
| Total | 242 (96.0%) | 10 (4.0%) |
Income Below Poverty Among Single-Parent Households in Twisp
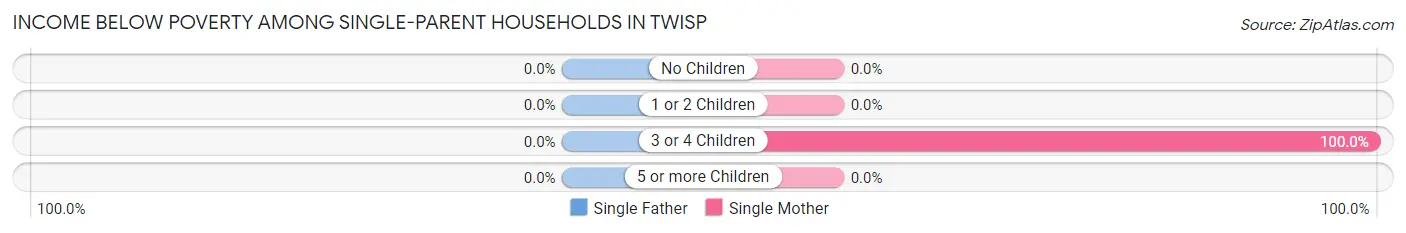
| Children | Single Father | Single Mother |
| No Children | 0 (0.0%) | 0 (0.0%) |
| 1 or 2 Children | 0 (0.0%) | 0 (0.0%) |
| 3 or 4 Children | 0 (0.0%) | 12 (100.0%) |
| 5 or more Children | 0 (0.0%) | 0 (0.0%) |
| Total | 0 (0.0%) | 12 (30.0%) |
Income Below Poverty Among Married-Couple vs Single-Parent Households in Twisp
The poverty data for Twisp shows that 10 of the married-couple family households (4.0%) and 12 of the single-parent households (19.1%) are living below the poverty level. Within the married-couple family households, those with no children have the highest poverty rate, with 10 households (6.7%) falling below the poverty line. Among the single-parent households, those with 3 or 4 children have the highest poverty rate, with 12 household (100.0%) living below poverty.
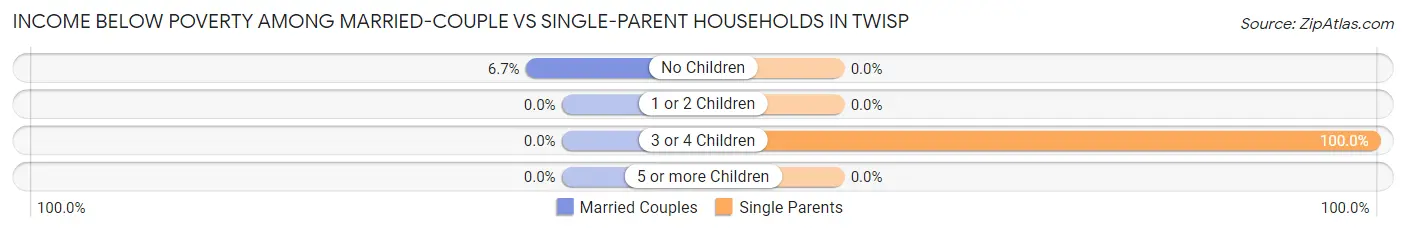
| Children | Married-Couple Families | Single-Parent Households |
| No Children | 10 (6.7%) | 0 (0.0%) |
| 1 or 2 Children | 0 (0.0%) | 0 (0.0%) |
| 3 or 4 Children | 0 (0.0%) | 12 (100.0%) |
| 5 or more Children | 0 (0.0%) | 0 (0.0%) |
| Total | 10 (4.0%) | 12 (19.1%) |
Race in Twisp
The most populous races in Twisp are White / Caucasian (812 | 74.2%), Hispanic or Latino (241 | 22.0%), and Some other Race (238 | 21.7%).
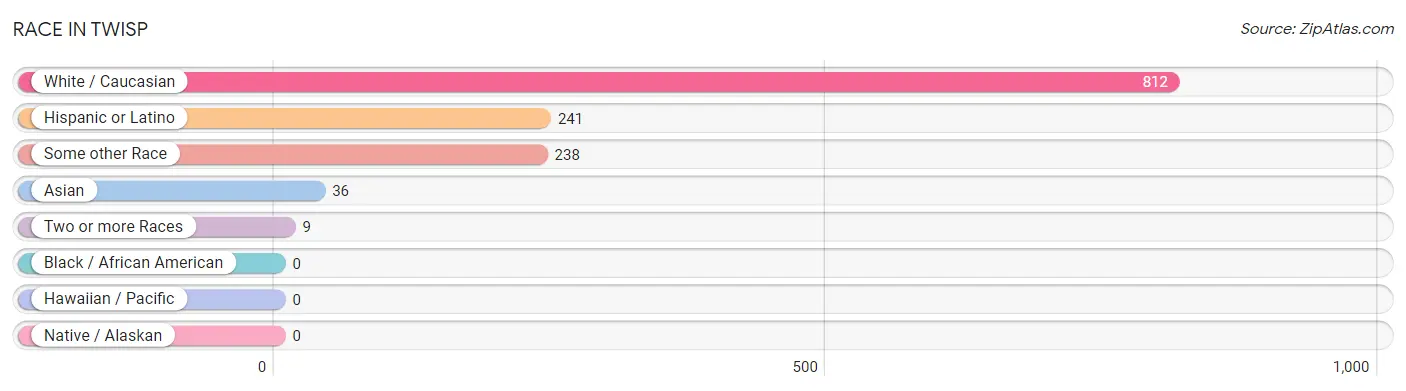
| Race | # Population | % Population |
| Asian | 36 | 3.3% |
| Black / African American | 0 | 0.0% |
| Hawaiian / Pacific | 0 | 0.0% |
| Hispanic or Latino | 241 | 22.0% |
| Native / Alaskan | 0 | 0.0% |
| White / Caucasian | 812 | 74.2% |
| Two or more Races | 9 | 0.8% |
| Some other Race | 238 | 21.7% |
| Total | 1,095 | 100.0% |
Ancestry in Twisp
The most populous ancestries reported in Twisp are Mexican (241 | 22.0%), German (211 | 19.3%), Irish (102 | 9.3%), Norwegian (93 | 8.5%), and Swedish (67 | 6.1%), together accounting for 65.2% of all Twisp residents.
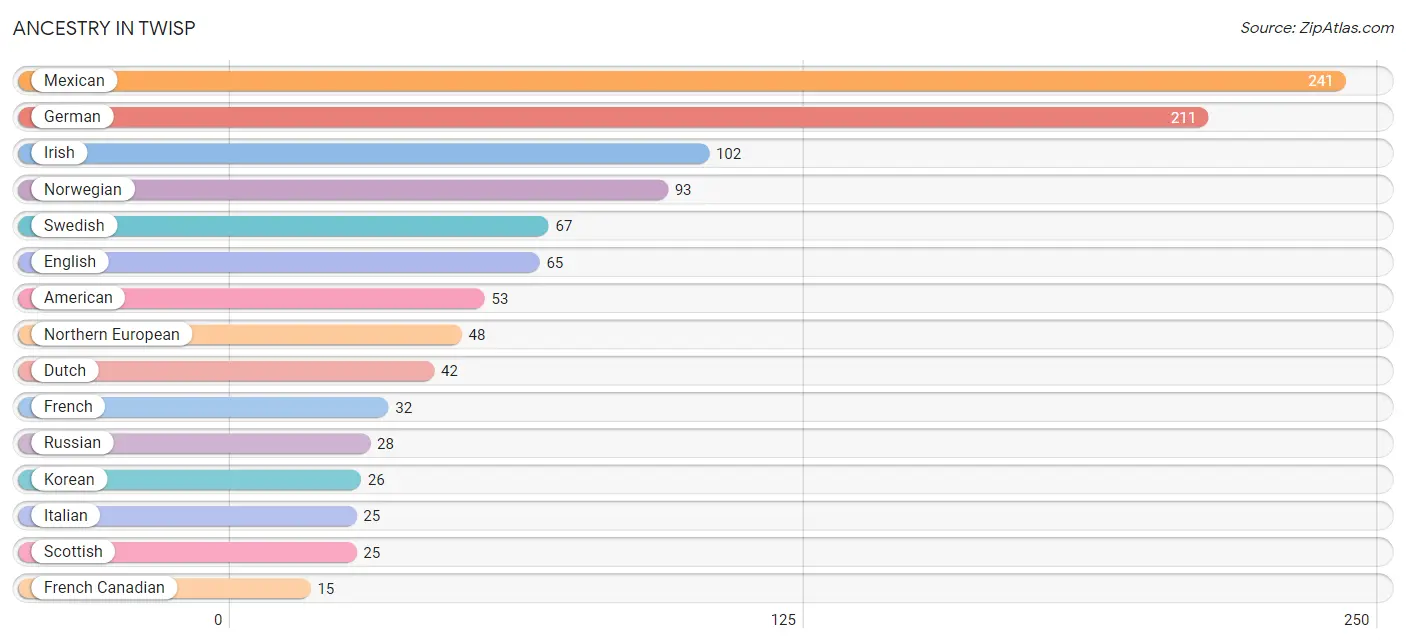
| Ancestry | # Population | % Population |
| American | 53 | 4.8% |
| Basque | 11 | 1.0% |
| Bhutanese | 10 | 0.9% |
| British | 4 | 0.4% |
| Colville | 4 | 0.4% |
| Dutch | 42 | 3.8% |
| Eastern European | 12 | 1.1% |
| English | 65 | 5.9% |
| French | 32 | 2.9% |
| French Canadian | 15 | 1.4% |
| German | 211 | 19.3% |
| Irish | 102 | 9.3% |
| Italian | 25 | 2.3% |
| Korean | 26 | 2.4% |
| Mexican | 241 | 22.0% |
| Northern European | 48 | 4.4% |
| Norwegian | 93 | 8.5% |
| Portuguese | 13 | 1.2% |
| Russian | 28 | 2.6% |
| Scotch-Irish | 8 | 0.7% |
| Scottish | 25 | 2.3% |
| Swedish | 67 | 6.1% |
| Ukrainian | 6 | 0.5% |
| Welsh | 9 | 0.8% | View All 24 Rows |
Immigrants in Twisp
The most numerous immigrant groups reported in Twisp came from Central America (85 | 7.8%), Latin America (85 | 7.8%), Mexico (85 | 7.8%), Asia (4 | 0.4%), and Eastern Asia (4 | 0.4%), together accounting for 24.0% of all Twisp residents.
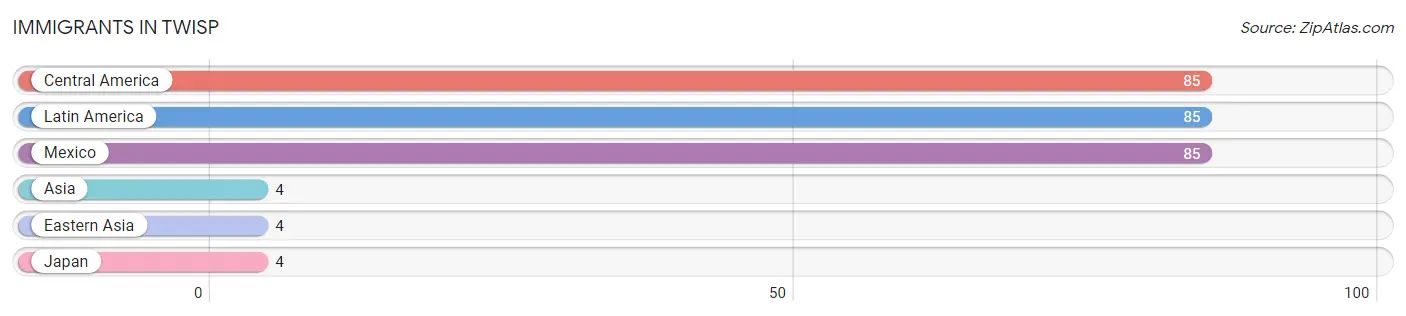
| Immigration Origin | # Population | % Population |
| Asia | 4 | 0.4% |
| Central America | 85 | 7.8% |
| Eastern Asia | 4 | 0.4% |
| Japan | 4 | 0.4% |
| Latin America | 85 | 7.8% |
| Mexico | 85 | 7.8% | View All 6 Rows |
Sex and Age in Twisp
Sex and Age in Twisp
The most populous age groups in Twisp are 45 to 49 Years (76 | 14.1%) for men and 70 to 74 Years (76 | 13.6%) for women.
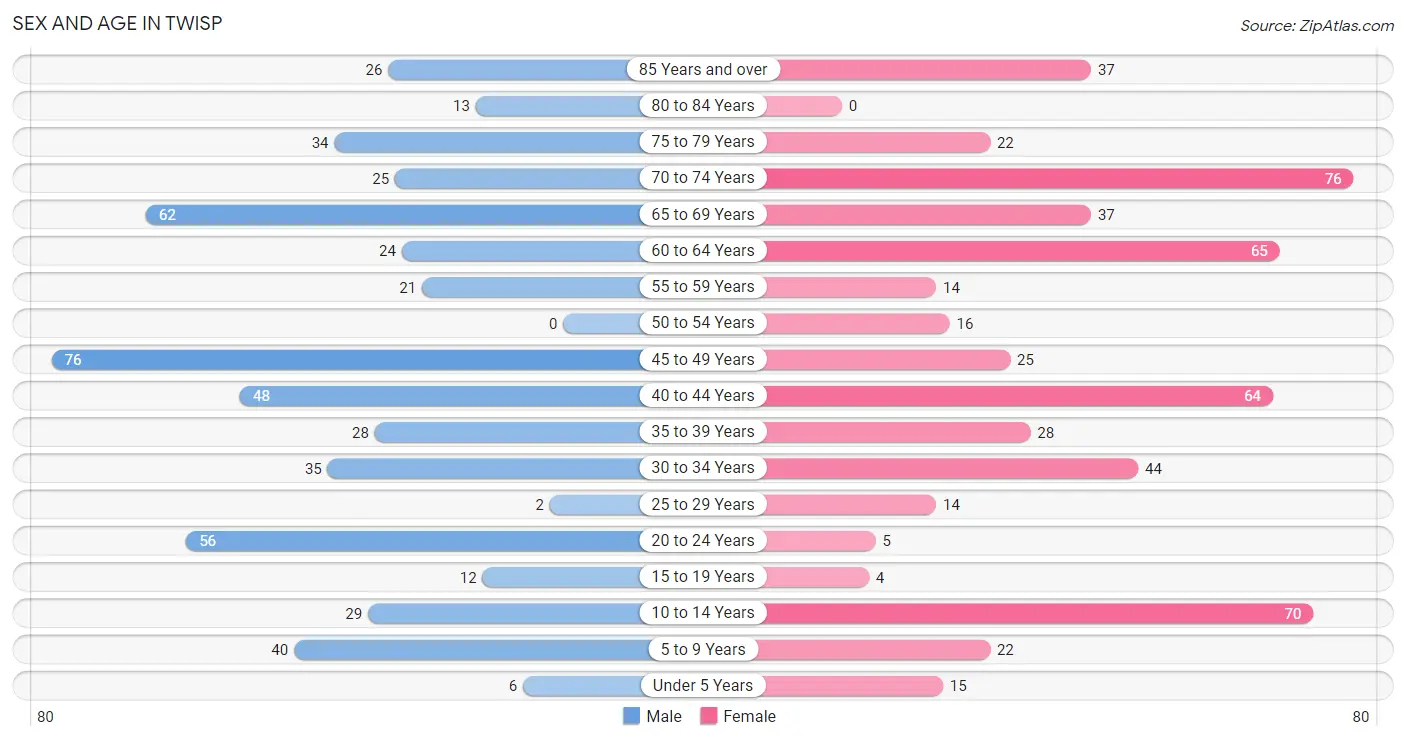
| Age Bracket | Male | Female |
| Under 5 Years | 6 (1.1%) | 15 (2.7%) |
| 5 to 9 Years | 40 (7.4%) | 22 (3.9%) |
| 10 to 14 Years | 29 (5.4%) | 70 (12.5%) |
| 15 to 19 Years | 12 (2.2%) | 4 (0.7%) |
| 20 to 24 Years | 56 (10.4%) | 5 (0.9%) |
| 25 to 29 Years | 2 (0.4%) | 14 (2.5%) |
| 30 to 34 Years | 35 (6.5%) | 44 (7.9%) |
| 35 to 39 Years | 28 (5.2%) | 28 (5.0%) |
| 40 to 44 Years | 48 (8.9%) | 64 (11.5%) |
| 45 to 49 Years | 76 (14.1%) | 25 (4.5%) |
| 50 to 54 Years | 0 (0.0%) | 16 (2.9%) |
| 55 to 59 Years | 21 (3.9%) | 14 (2.5%) |
| 60 to 64 Years | 24 (4.5%) | 65 (11.7%) |
| 65 to 69 Years | 62 (11.6%) | 37 (6.6%) |
| 70 to 74 Years | 25 (4.7%) | 76 (13.6%) |
| 75 to 79 Years | 34 (6.3%) | 22 (3.9%) |
| 80 to 84 Years | 13 (2.4%) | 0 (0.0%) |
| 85 Years and over | 26 (4.8%) | 37 (6.6%) |
| Total | 537 (100.0%) | 558 (100.0%) |
Families and Households in Twisp
Median Family Size in Twisp
The median family size in Twisp is 2.52 persons per family, with single male/father families (23 | 7.3%) accounting for the largest median family size of 2.78 persons per family. On the other hand, married-couple families (252 | 80.0%) represent the smallest median family size with 2.46 persons per family.
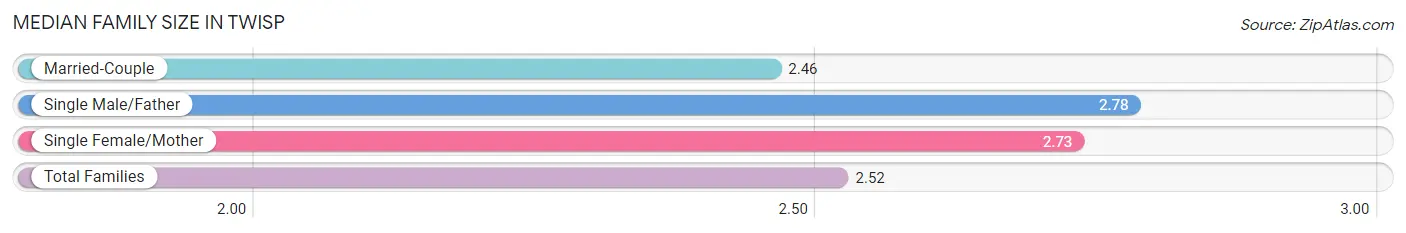
| Family Type | # Families | Family Size |
| Married-Couple | 252 (80.0%) | 2.46 |
| Single Male/Father | 23 (7.3%) | 2.78 |
| Single Female/Mother | 40 (12.7%) | 2.73 |
| Total Families | 315 (100.0%) | 2.52 |
Median Household Size in Twisp
The median household size in Twisp is 2.05 persons per household, with single male/father households (23 | 4.3%) accounting for the largest median household size of 3.17 persons per household. non-family households (220 | 41.1%) represent the smallest median household size with 1.19 persons per household.
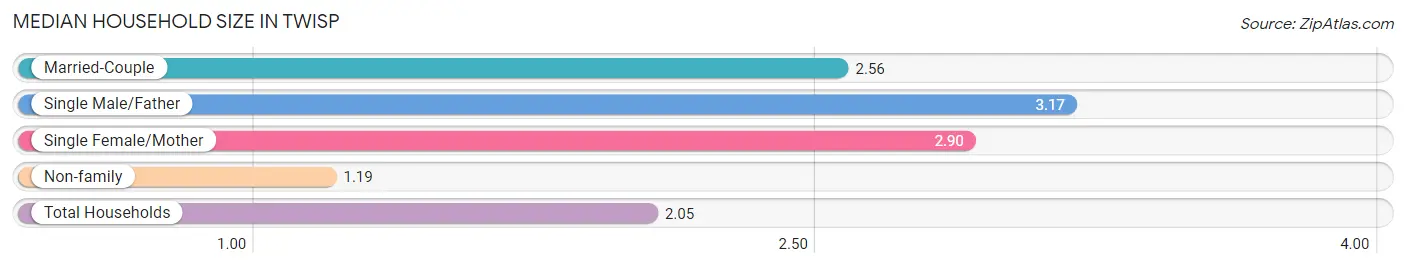
| Household Type | # Households | Household Size |
| Married-Couple | 252 (47.1%) | 2.56 |
| Single Male/Father | 23 (4.3%) | 3.17 |
| Single Female/Mother | 40 (7.5%) | 2.90 |
| Non-family | 220 (41.1%) | 1.19 |
| Total Households | 535 (100.0%) | 2.05 |
Household Size by Marriage Status in Twisp
Out of a total of 535 households in Twisp, 315 (58.9%) are family households, while 220 (41.1%) are nonfamily households. The most numerous type of family households are 2-person households, comprising 148, and the most common type of nonfamily households are 1-person households, comprising 176.
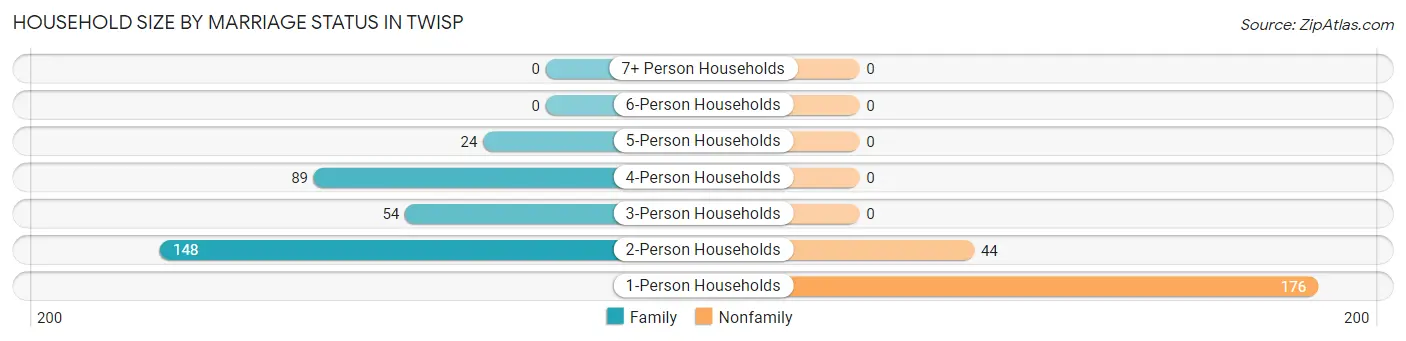
| Household Size | Family Households | Nonfamily Households |
| 1-Person Households | - | 176 (32.9%) |
| 2-Person Households | 148 (27.7%) | 44 (8.2%) |
| 3-Person Households | 54 (10.1%) | 0 (0.0%) |
| 4-Person Households | 89 (16.6%) | 0 (0.0%) |
| 5-Person Households | 24 (4.5%) | 0 (0.0%) |
| 6-Person Households | 0 (0.0%) | 0 (0.0%) |
| 7+ Person Households | 0 (0.0%) | 0 (0.0%) |
| Total | 315 (58.9%) | 220 (41.1%) |
Female Fertility in Twisp
Fertility by Age in Twisp
Average fertility rate in Twisp is 65.0 births per 1,000 women. Women in the age bracket of 20 to 34 years have the highest fertility rate with 190.0 births per 1,000 women. Women in the age bracket of 20 to 34 years acount for 100.0% of all women with births.
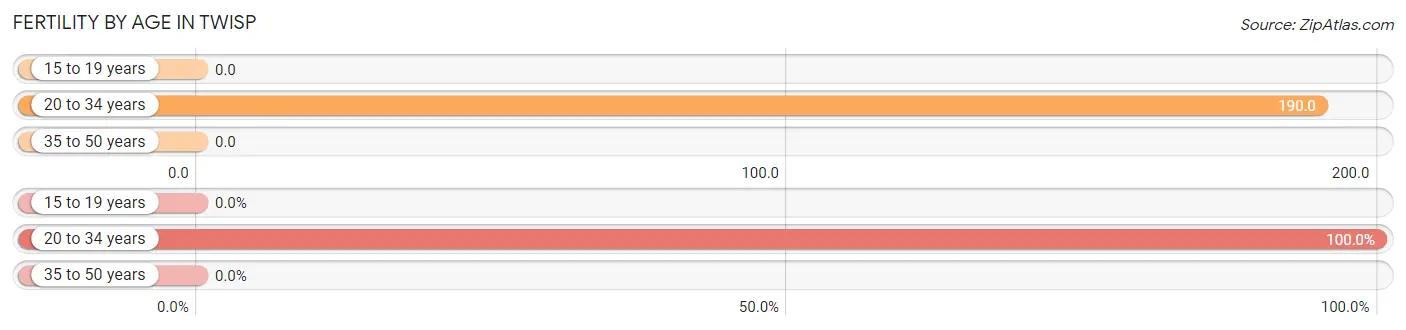
| Age Bracket | Women with Births | Births / 1,000 Women |
| 15 to 19 years | 0 (0.0%) | 0.0 |
| 20 to 34 years | 12 (100.0%) | 190.0 |
| 35 to 50 years | 0 (0.0%) | 0.0 |
| Total | 12 (100.0%) | 65.0 |
Fertility by Age by Marriage Status in Twisp
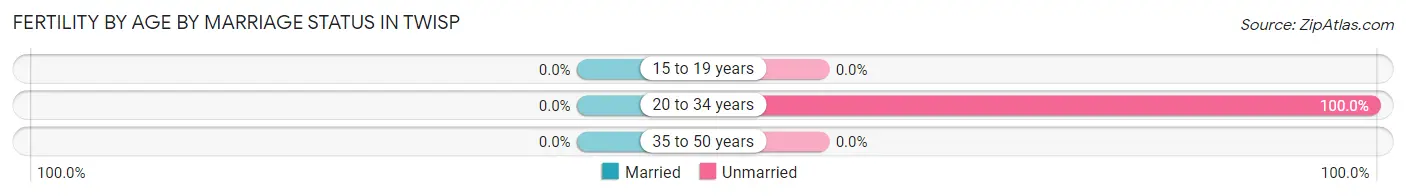
| Age Bracket | Married | Unmarried |
| 15 to 19 years | 0 (0.0%) | 0 (0.0%) |
| 20 to 34 years | 0 (0.0%) | 12 (100.0%) |
| 35 to 50 years | 0 (0.0%) | 0 (0.0%) |
| Total | 0 (0.0%) | 12 (100.0%) |
Fertility by Education in Twisp
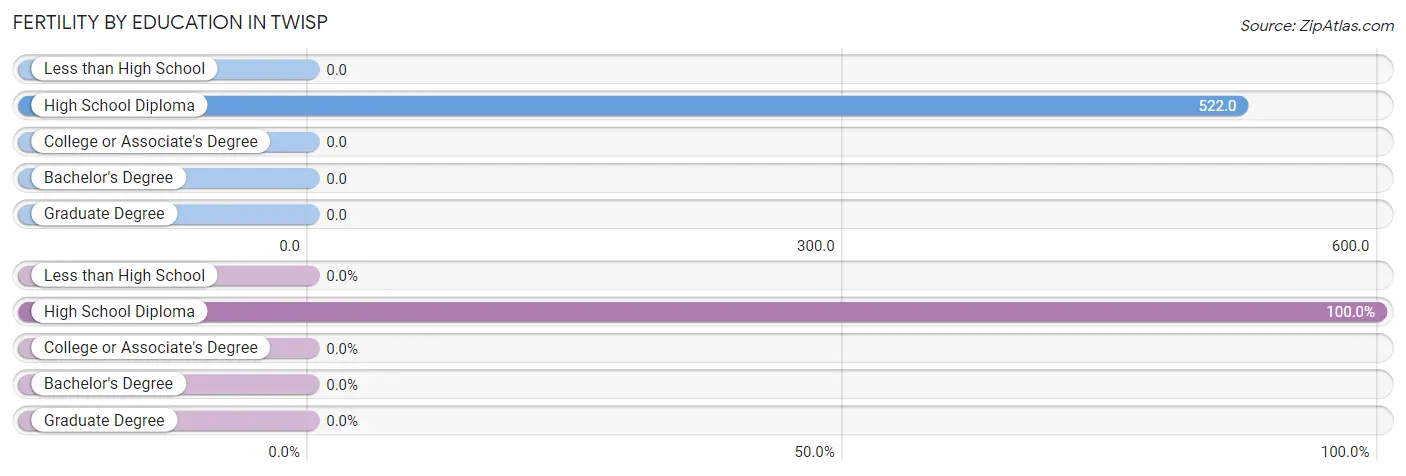
| Educational Attainment | Women with Births | Births / 1,000 Women |
| Less than High School | 0 (0.0%) | 0.0 |
| High School Diploma | 12 (100.0%) | 522.0 |
| College or Associate's Degree | 0 (0.0%) | 0.0 |
| Bachelor's Degree | 0 (0.0%) | 0.0 |
| Graduate Degree | 0 (0.0%) | 0.0 |
| Total | 12 (100.0%) | 65.0 |
Fertility by Education by Marriage Status in Twisp
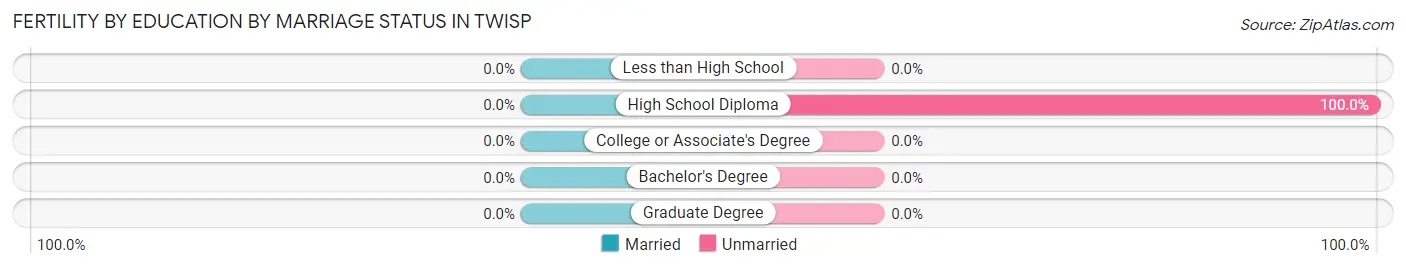
| Educational Attainment | Married | Unmarried |
| Less than High School | 0 (0.0%) | 0 (0.0%) |
| High School Diploma | 0 (0.0%) | 12 (100.0%) |
| College or Associate's Degree | 0 (0.0%) | 0 (0.0%) |
| Bachelor's Degree | 0 (0.0%) | 0 (0.0%) |
| Graduate Degree | 0 (0.0%) | 0 (0.0%) |
| Total | 0 (0.0%) | 12 (100.0%) |
Employment Characteristics in Twisp
Employment by Class of Employer in Twisp
Among the 494 employed individuals in Twisp, private company employees (250 | 50.6%), federal government employees (118 | 23.9%), and local government employees (35 | 7.1%) make up the most common classes of employment.
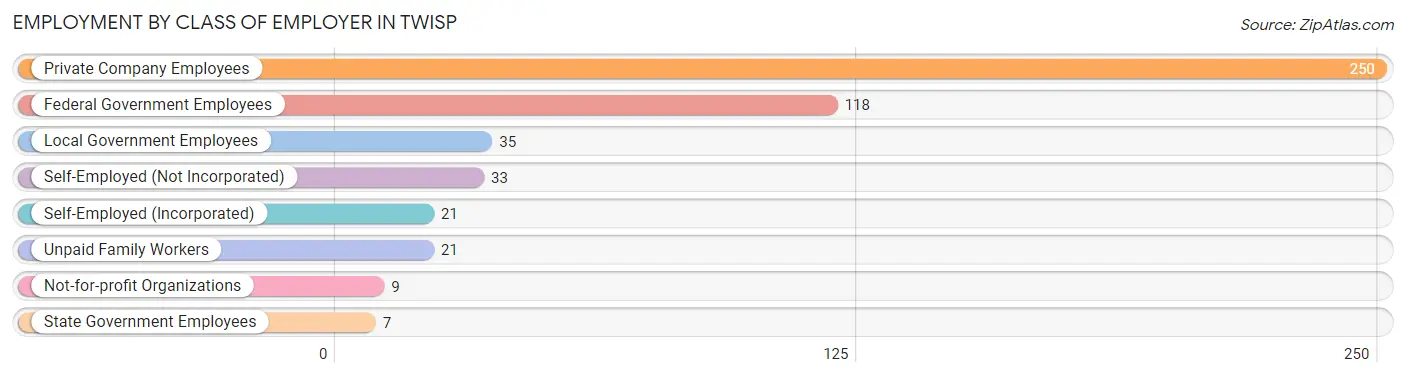
| Employer Class | # Employees | % Employees |
| Private Company Employees | 250 | 50.6% |
| Self-Employed (Incorporated) | 21 | 4.3% |
| Self-Employed (Not Incorporated) | 33 | 6.7% |
| Not-for-profit Organizations | 9 | 1.8% |
| Local Government Employees | 35 | 7.1% |
| State Government Employees | 7 | 1.4% |
| Federal Government Employees | 118 | 23.9% |
| Unpaid Family Workers | 21 | 4.3% |
| Total | 494 | 100.0% |
Employment Status by Age in Twisp
According to the labor force statistics for Twisp, out of the total population over 16 years of age (913), 59.5% or 543 individuals are in the labor force, with 10.3% or 56 of them unemployed. The age group with the highest labor force participation rate is 16 to 19 years, with 100.0% or 16 individuals in the labor force. Within the labor force, the 35 to 44 years age range has the highest percentage of unemployed individuals, with 30.8% or 49 of them being unemployed.
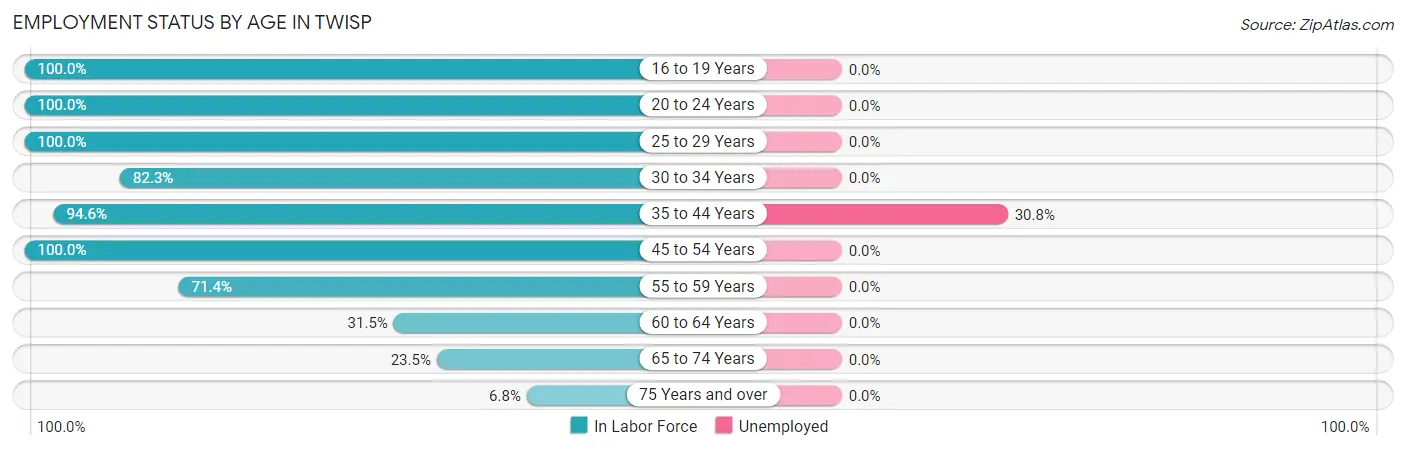
| Age Bracket | In Labor Force | Unemployed |
| 16 to 19 Years | 16 (100.0%) | 0 (0.0%) |
| 20 to 24 Years | 61 (100.0%) | 0 (0.0%) |
| 25 to 29 Years | 16 (100.0%) | 0 (0.0%) |
| 30 to 34 Years | 65 (82.3%) | 0 (0.0%) |
| 35 to 44 Years | 159 (94.6%) | 49 (30.8%) |
| 45 to 54 Years | 117 (100.0%) | 0 (0.0%) |
| 55 to 59 Years | 25 (71.4%) | 0 (0.0%) |
| 60 to 64 Years | 28 (31.5%) | 0 (0.0%) |
| 65 to 74 Years | 47 (23.5%) | 0 (0.0%) |
| 75 Years and over | 9 (6.8%) | 0 (0.0%) |
| Total | 543 (59.5%) | 56 (10.3%) |
Employment Status by Educational Attainment in Twisp
According to labor force statistics for Twisp, 81.3% of individuals (410) out of the total population between 25 and 64 years of age (504) are in the labor force, with 14.2% or 58 of them being unemployed. The group with the highest labor force participation rate are those with the educational attainment of less than high school, with 100.0% or 20 individuals in the labor force. Within the labor force, individuals with less than high school education have the highest percentage of unemployment, with 100.0% or 20 of them being unemployed.
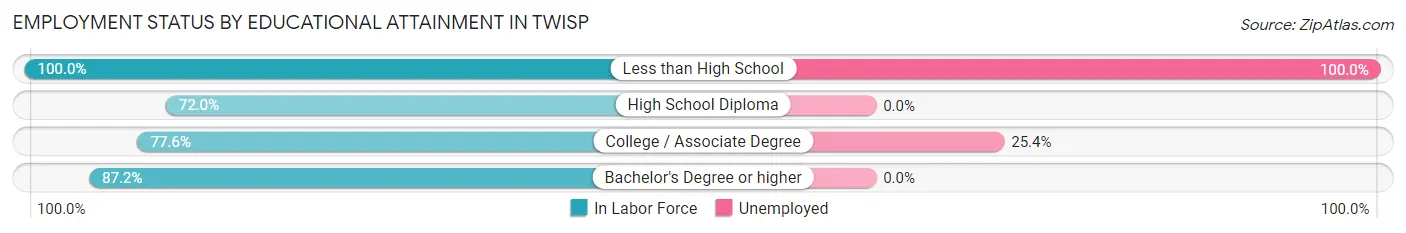
| Educational Attainment | In Labor Force | Unemployed |
| Less than High School | 20 (100.0%) | 20 (100.0%) |
| High School Diploma | 85 (72.0%) | 0 (0.0%) |
| College / Associate Degree | 114 (77.6%) | 37 (25.4%) |
| Bachelor's Degree or higher | 191 (87.2%) | 0 (0.0%) |
| Total | 410 (81.3%) | 72 (14.2%) |
Employment Occupations by Sex in Twisp
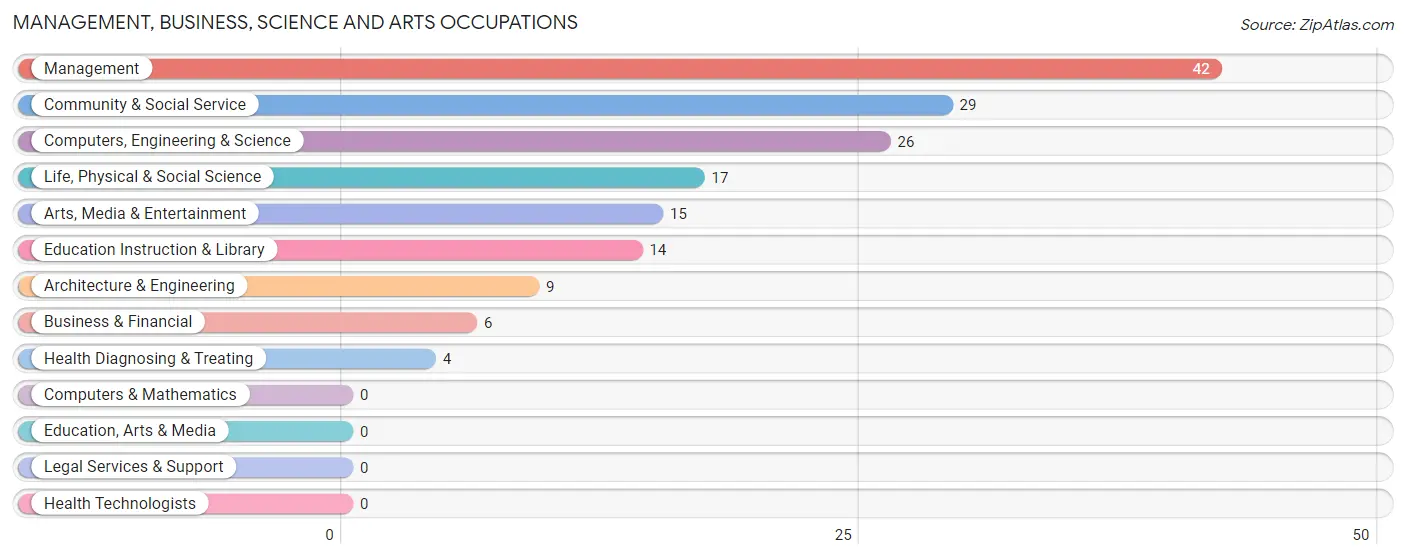
Management, Business, Science and Arts Occupations
The most common Management, Business, Science and Arts occupations in Twisp are Management (42 | 9.8%), Community & Social Service (29 | 6.8%), Computers, Engineering & Science (26 | 6.1%), Life, Physical & Social Science (17 | 4.0%), and Arts, Media & Entertainment (15 | 3.5%).
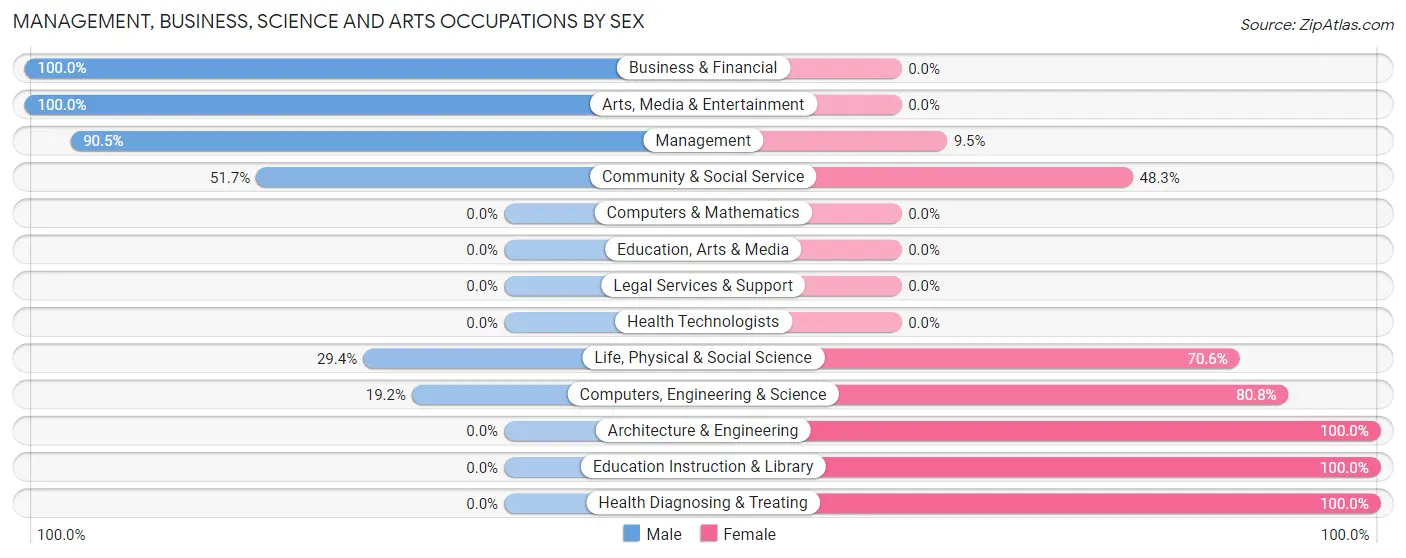
Management, Business, Science and Arts Occupations by Sex
Within the Management, Business, Science and Arts occupations in Twisp, the most male-oriented occupations are Business & Financial (100.0%), Arts, Media & Entertainment (100.0%), and Management (90.5%), while the most female-oriented occupations are Architecture & Engineering (100.0%), Education Instruction & Library (100.0%), and Health Diagnosing & Treating (100.0%).
| Occupation | Male | Female |
| Management | 38 (90.5%) | 4 (9.5%) |
| Business & Financial | 6 (100.0%) | 0 (0.0%) |
| Computers, Engineering & Science | 5 (19.2%) | 21 (80.8%) |
| Computers & Mathematics | 0 (0.0%) | 0 (0.0%) |
| Architecture & Engineering | 0 (0.0%) | 9 (100.0%) |
| Life, Physical & Social Science | 5 (29.4%) | 12 (70.6%) |
| Community & Social Service | 15 (51.7%) | 14 (48.3%) |
| Education, Arts & Media | 0 (0.0%) | 0 (0.0%) |
| Legal Services & Support | 0 (0.0%) | 0 (0.0%) |
| Education Instruction & Library | 0 (0.0%) | 14 (100.0%) |
| Arts, Media & Entertainment | 15 (100.0%) | 0 (0.0%) |
| Health Diagnosing & Treating | 0 (0.0%) | 4 (100.0%) |
| Health Technologists | 0 (0.0%) | 0 (0.0%) |
| Total (Category) | 64 (59.8%) | 43 (40.2%) |
| Total (Overall) | 213 (49.6%) | 216 (50.3%) |
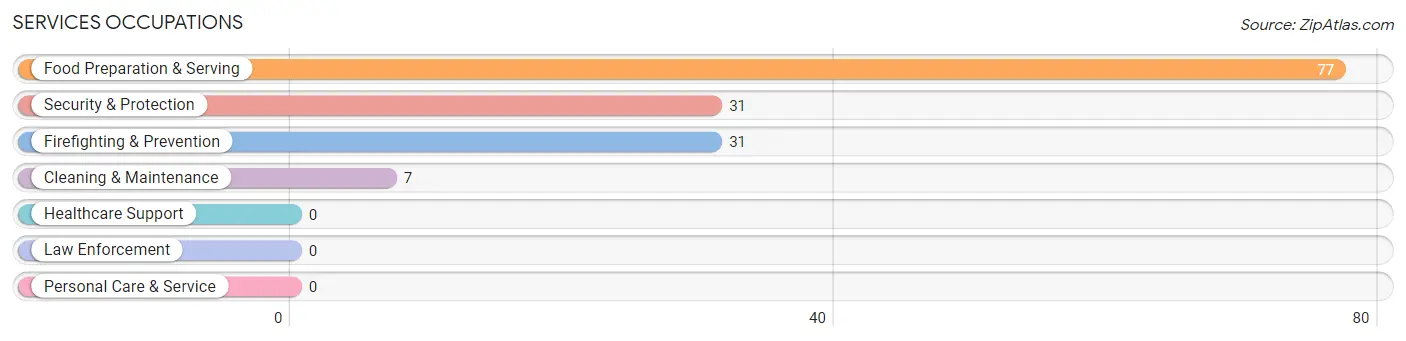
Services Occupations
The most common Services occupations in Twisp are Food Preparation & Serving (77 | 17.9%), Security & Protection (31 | 7.2%), Firefighting & Prevention (31 | 7.2%), and Cleaning & Maintenance (7 | 1.6%).
Services Occupations by Sex
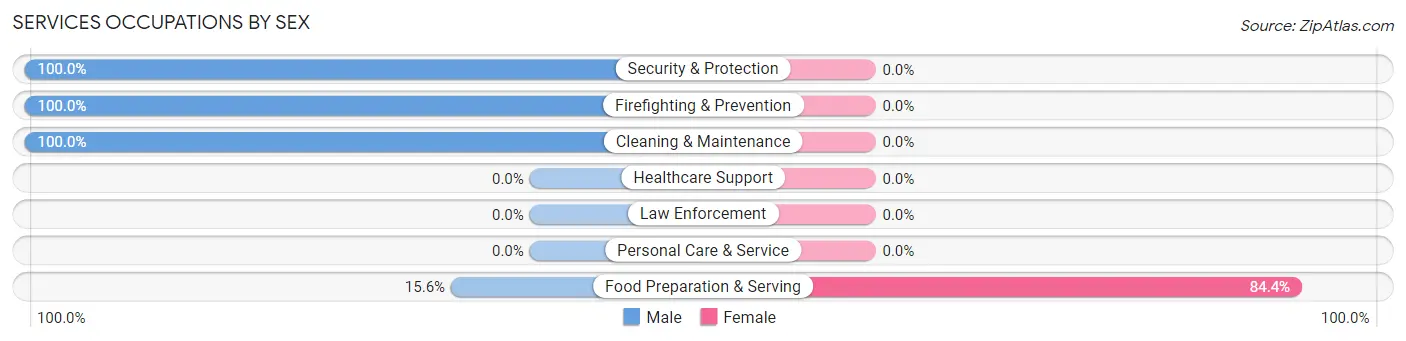
| Occupation | Male | Female |
| Healthcare Support | 0 (0.0%) | 0 (0.0%) |
| Security & Protection | 31 (100.0%) | 0 (0.0%) |
| Firefighting & Prevention | 31 (100.0%) | 0 (0.0%) |
| Law Enforcement | 0 (0.0%) | 0 (0.0%) |
| Food Preparation & Serving | 12 (15.6%) | 65 (84.4%) |
| Cleaning & Maintenance | 7 (100.0%) | 0 (0.0%) |
| Personal Care & Service | 0 (0.0%) | 0 (0.0%) |
| Total (Category) | 50 (43.5%) | 65 (56.5%) |
| Total (Overall) | 213 (49.6%) | 216 (50.3%) |
Sales and Office Occupations
The most common Sales and Office occupations in Twisp are Office & Administration (82 | 19.1%), and Sales & Related (48 | 11.2%).
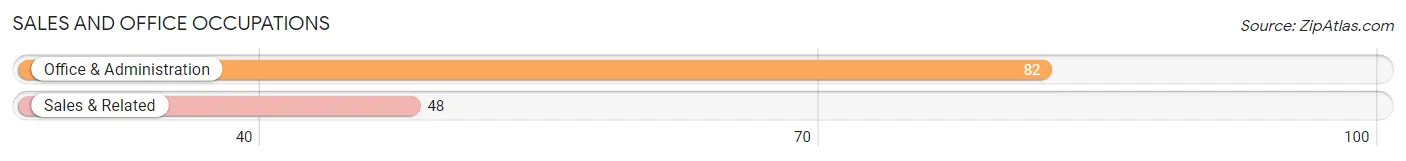
Sales and Office Occupations by Sex
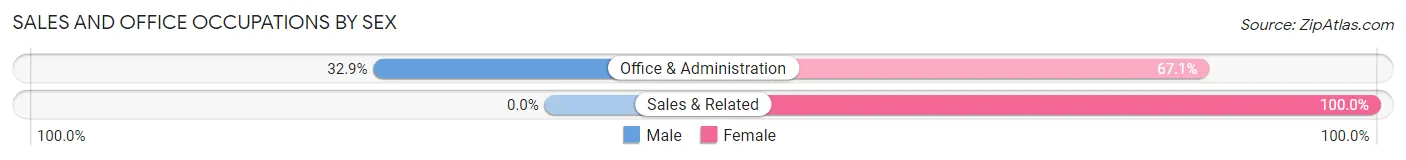
| Occupation | Male | Female |
| Sales & Related | 0 (0.0%) | 48 (100.0%) |
| Office & Administration | 27 (32.9%) | 55 (67.1%) |
| Total (Category) | 27 (20.8%) | 103 (79.2%) |
| Total (Overall) | 213 (49.6%) | 216 (50.3%) |
Natural Resources, Construction and Maintenance Occupations
The most common Natural Resources, Construction and Maintenance occupations in Twisp are , and Construction & Extraction (36 | 8.4%).
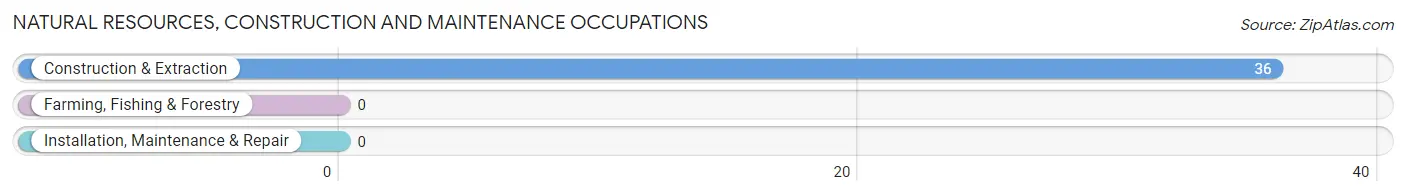
Natural Resources, Construction and Maintenance Occupations by Sex
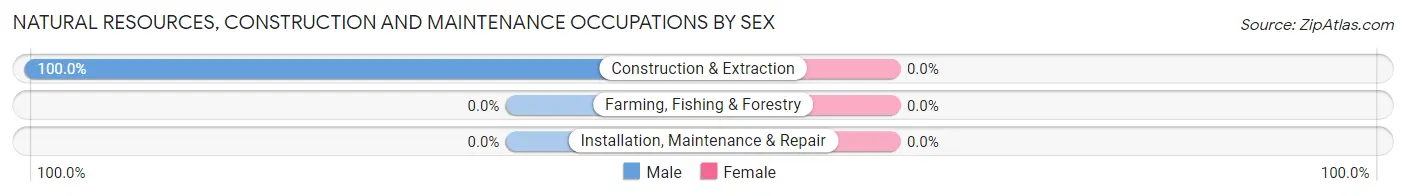
| Occupation | Male | Female |
| Farming, Fishing & Forestry | 0 (0.0%) | 0 (0.0%) |
| Construction & Extraction | 36 (100.0%) | 0 (0.0%) |
| Installation, Maintenance & Repair | 0 (0.0%) | 0 (0.0%) |
| Total (Category) | 36 (100.0%) | 0 (0.0%) |
| Total (Overall) | 213 (49.6%) | 216 (50.3%) |
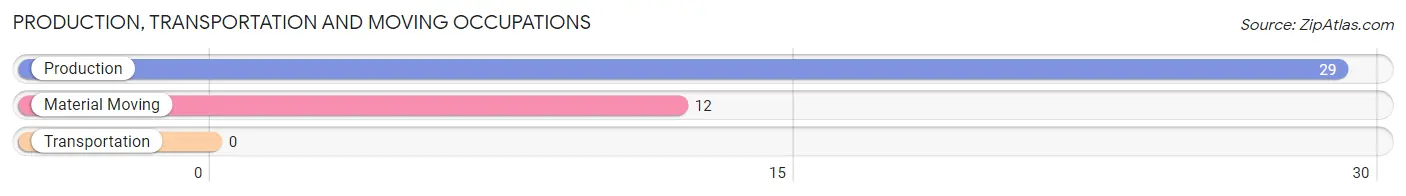
Production, Transportation and Moving Occupations
The most common Production, Transportation and Moving occupations in Twisp are Production (29 | 6.8%), and Material Moving (12 | 2.8%).
Production, Transportation and Moving Occupations by Sex
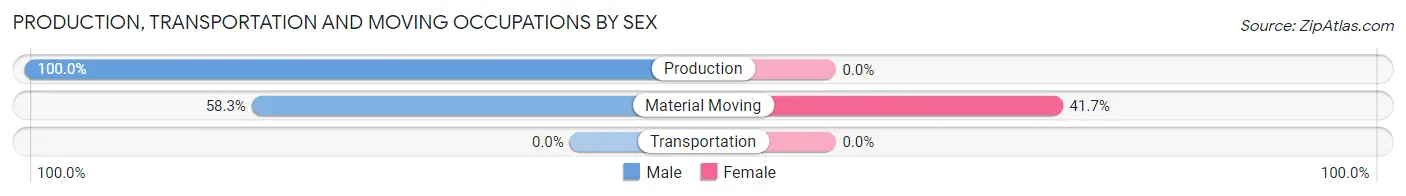
| Occupation | Male | Female |
| Production | 29 (100.0%) | 0 (0.0%) |
| Transportation | 0 (0.0%) | 0 (0.0%) |
| Material Moving | 7 (58.3%) | 5 (41.7%) |
| Total (Category) | 36 (87.8%) | 5 (12.2%) |
| Total (Overall) | 213 (49.6%) | 216 (50.3%) |
Employment Industries by Sex in Twisp
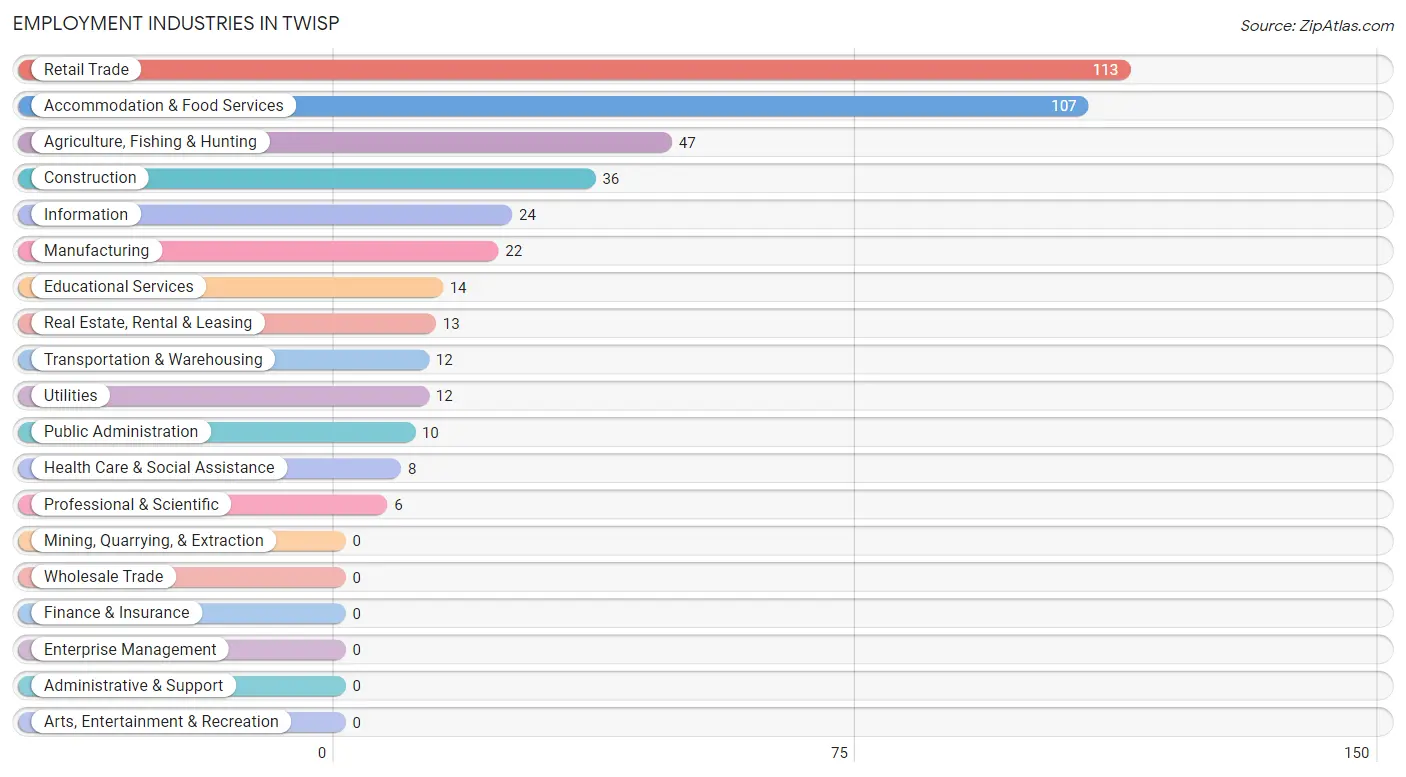
Employment Industries in Twisp
The major employment industries in Twisp include Retail Trade (113 | 26.3%), Accommodation & Food Services (107 | 24.9%), Agriculture, Fishing & Hunting (47 | 11.0%), Construction (36 | 8.4%), and Information (24 | 5.6%).
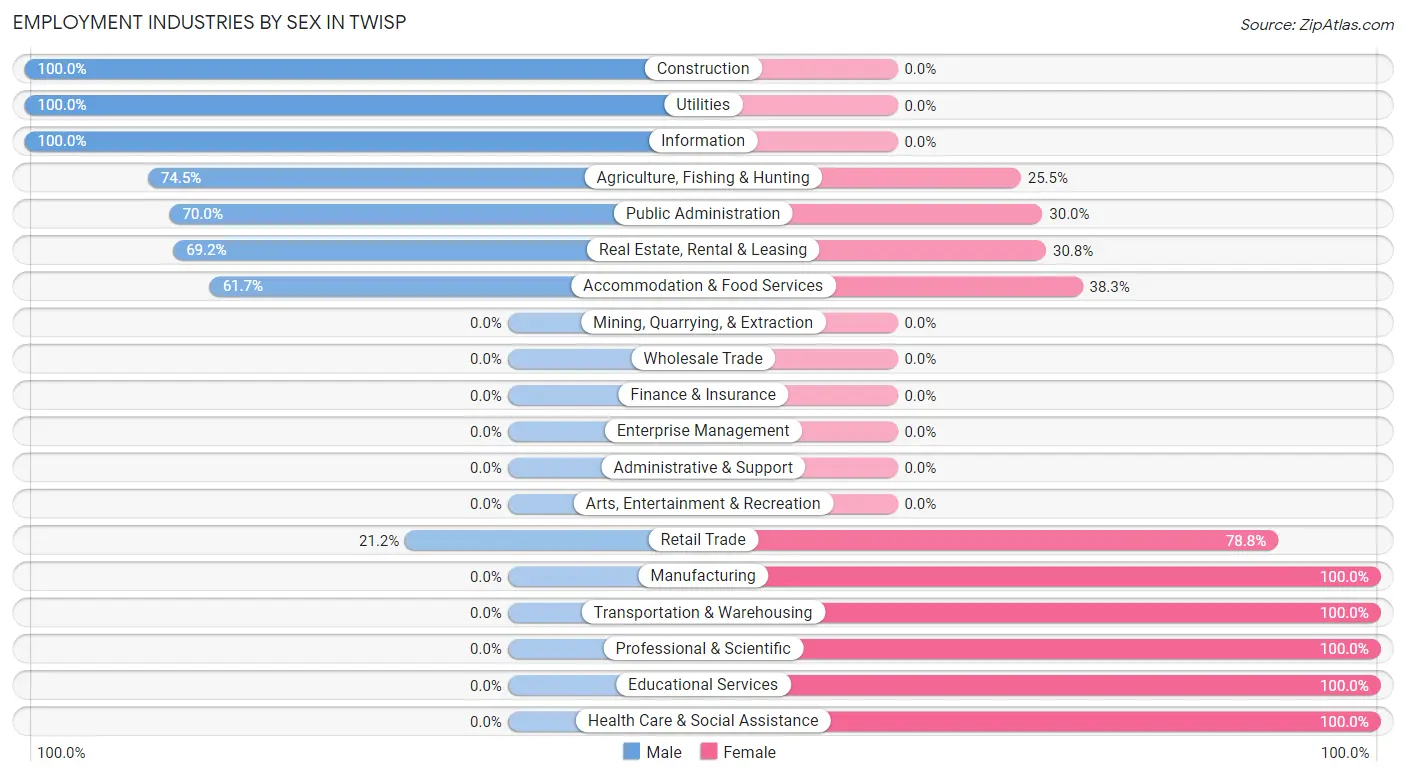
Employment Industries by Sex in Twisp
The Twisp industries that see more men than women are Construction (100.0%), Utilities (100.0%), and Information (100.0%), whereas the industries that tend to have a higher number of women are Manufacturing (100.0%), Transportation & Warehousing (100.0%), and Professional & Scientific (100.0%).
| Industry | Male | Female |
| Agriculture, Fishing & Hunting | 35 (74.5%) | 12 (25.5%) |
| Mining, Quarrying, & Extraction | 0 (0.0%) | 0 (0.0%) |
| Construction | 36 (100.0%) | 0 (0.0%) |
| Manufacturing | 0 (0.0%) | 22 (100.0%) |
| Wholesale Trade | 0 (0.0%) | 0 (0.0%) |
| Retail Trade | 24 (21.2%) | 89 (78.8%) |
| Transportation & Warehousing | 0 (0.0%) | 12 (100.0%) |
| Utilities | 12 (100.0%) | 0 (0.0%) |
| Information | 24 (100.0%) | 0 (0.0%) |
| Finance & Insurance | 0 (0.0%) | 0 (0.0%) |
| Real Estate, Rental & Leasing | 9 (69.2%) | 4 (30.8%) |
| Professional & Scientific | 0 (0.0%) | 6 (100.0%) |
| Enterprise Management | 0 (0.0%) | 0 (0.0%) |
| Administrative & Support | 0 (0.0%) | 0 (0.0%) |
| Educational Services | 0 (0.0%) | 14 (100.0%) |
| Health Care & Social Assistance | 0 (0.0%) | 8 (100.0%) |
| Arts, Entertainment & Recreation | 0 (0.0%) | 0 (0.0%) |
| Accommodation & Food Services | 66 (61.7%) | 41 (38.3%) |
| Public Administration | 7 (70.0%) | 3 (30.0%) |
| Total | 213 (49.6%) | 216 (50.3%) |
Education in Twisp
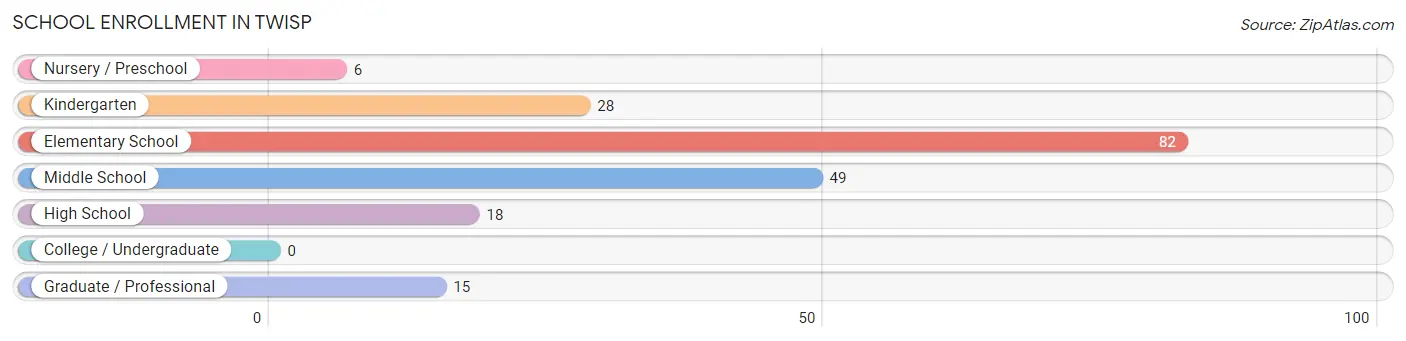
School Enrollment in Twisp
The most common levels of schooling among the 198 students in Twisp are elementary school (82 | 41.4%), middle school (49 | 24.7%), and kindergarten (28 | 14.1%).
| School Level | # Students | % Students |
| Nursery / Preschool | 6 | 3.0% |
| Kindergarten | 28 | 14.1% |
| Elementary School | 82 | 41.4% |
| Middle School | 49 | 24.7% |
| High School | 18 | 9.1% |
| College / Undergraduate | 0 | 0.0% |
| Graduate / Professional | 15 | 7.6% |
| Total | 198 | 100.0% |
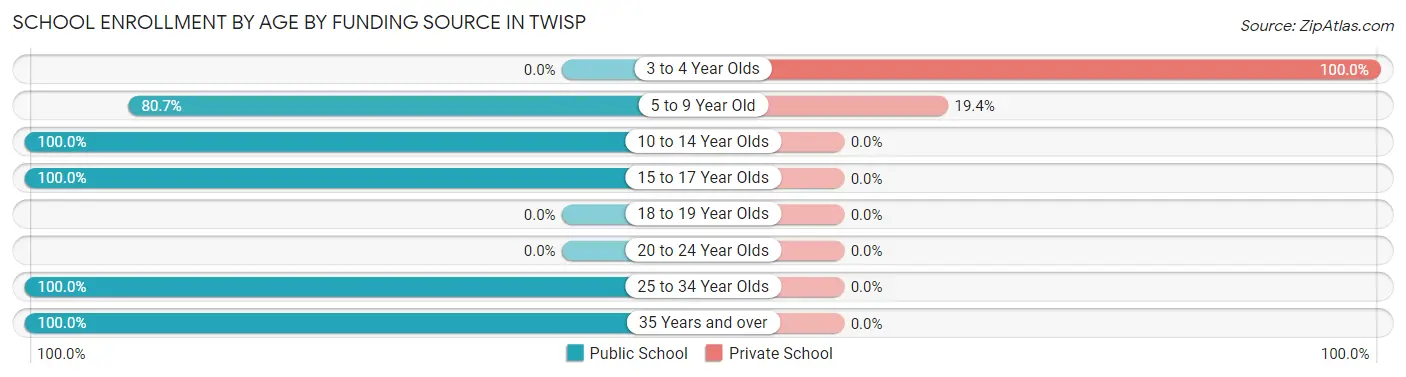
School Enrollment by Age by Funding Source in Twisp
Out of a total of 198 students who are enrolled in schools in Twisp, 18 (9.1%) attend a private institution, while the remaining 180 (90.9%) are enrolled in public schools. The age group of 3 to 4 year olds has the highest likelihood of being enrolled in private schools, with 6 (100.0% in the age bracket) enrolled. Conversely, the age group of 10 to 14 year olds has the lowest likelihood of being enrolled in a private school, with 99 (100.0% in the age bracket) attending a public institution.
| Age Bracket | Public School | Private School |
| 3 to 4 Year Olds | 0 (0.0%) | 6 (100.0%) |
| 5 to 9 Year Old | 50 (80.6%) | 12 (19.4%) |
| 10 to 14 Year Olds | 99 (100.0%) | 0 (0.0%) |
| 15 to 17 Year Olds | 16 (100.0%) | 0 (0.0%) |
| 18 to 19 Year Olds | 0 (0.0%) | 0 (0.0%) |
| 20 to 24 Year Olds | 0 (0.0%) | 0 (0.0%) |
| 25 to 34 Year Olds | 14 (100.0%) | 0 (0.0%) |
| 35 Years and over | 1 (100.0%) | 0 (0.0%) |
| Total | 180 (90.9%) | 18 (9.1%) |
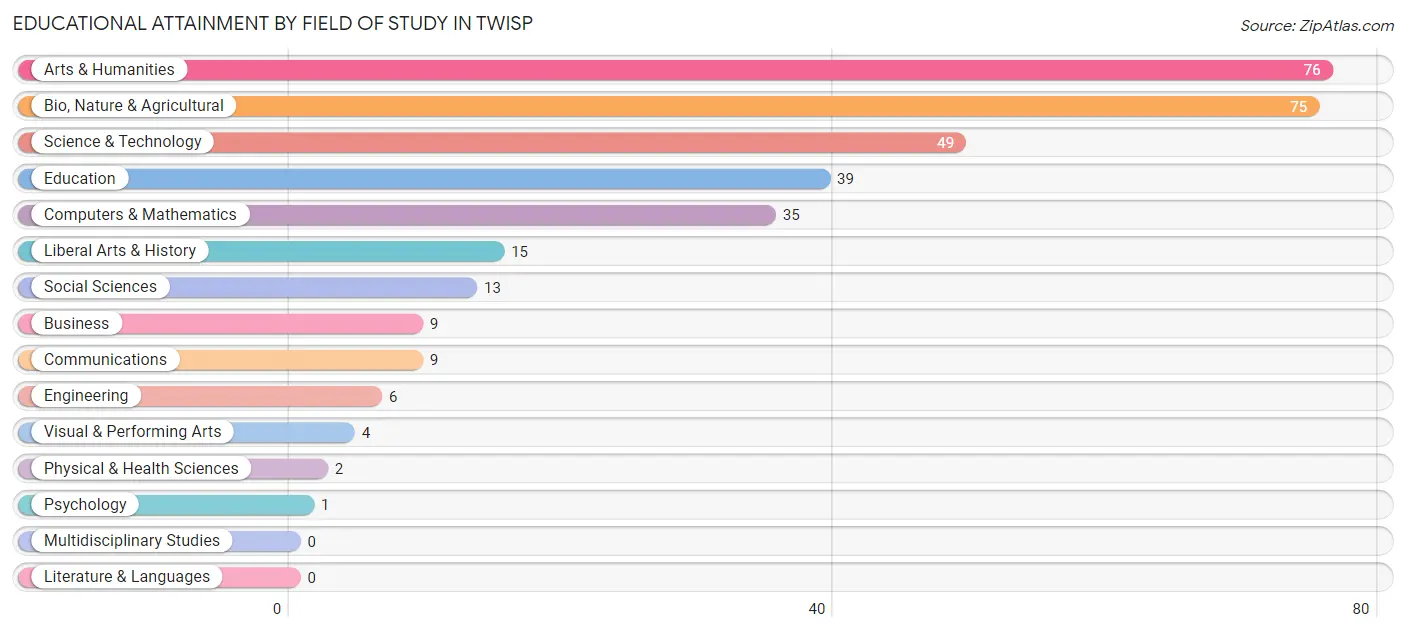
Educational Attainment by Field of Study in Twisp
Arts & humanities (76 | 22.8%), bio, nature & agricultural (75 | 22.5%), science & technology (49 | 14.7%), education (39 | 11.7%), and computers & mathematics (35 | 10.5%) are the most common fields of study among 333 individuals in Twisp who have obtained a bachelor's degree or higher.
| Field of Study | # Graduates | % Graduates |
| Computers & Mathematics | 35 | 10.5% |
| Bio, Nature & Agricultural | 75 | 22.5% |
| Physical & Health Sciences | 2 | 0.6% |
| Psychology | 1 | 0.3% |
| Social Sciences | 13 | 3.9% |
| Engineering | 6 | 1.8% |
| Multidisciplinary Studies | 0 | 0.0% |
| Science & Technology | 49 | 14.7% |
| Business | 9 | 2.7% |
| Education | 39 | 11.7% |
| Literature & Languages | 0 | 0.0% |
| Liberal Arts & History | 15 | 4.5% |
| Visual & Performing Arts | 4 | 1.2% |
| Communications | 9 | 2.7% |
| Arts & Humanities | 76 | 22.8% |
| Total | 333 | 100.0% |
Transportation & Commute in Twisp
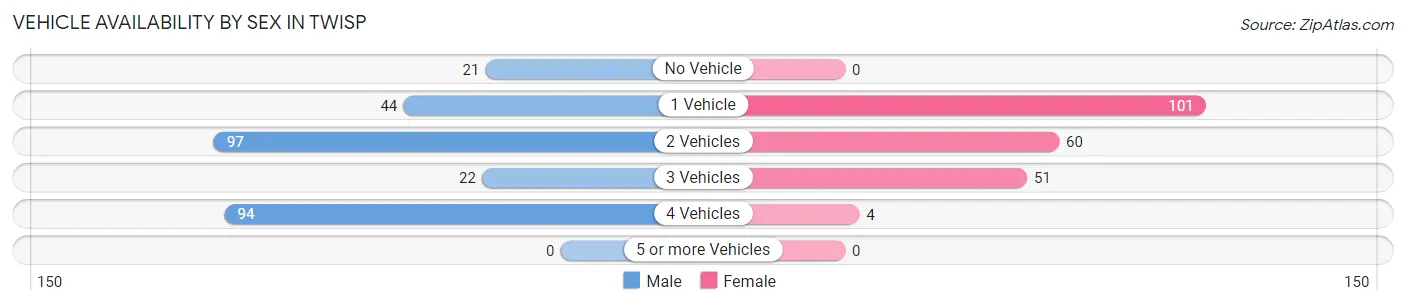
Vehicle Availability by Sex in Twisp
The most prevalent vehicle ownership categories in Twisp are males with 2 vehicles (97, accounting for 34.9%) and females with 2 vehicles (60, making up 44.9%).
| Vehicles Available | Male | Female |
| No Vehicle | 21 (7.5%) | 0 (0.0%) |
| 1 Vehicle | 44 (15.8%) | 101 (46.8%) |
| 2 Vehicles | 97 (34.9%) | 60 (27.8%) |
| 3 Vehicles | 22 (7.9%) | 51 (23.6%) |
| 4 Vehicles | 94 (33.8%) | 4 (1.8%) |
| 5 or more Vehicles | 0 (0.0%) | 0 (0.0%) |
| Total | 278 (100.0%) | 216 (100.0%) |
Commute Time in Twisp
The most frequently occuring commute durations in Twisp are 15 to 19 minutes (104 commuters, 21.3%), 10 to 14 minutes (99 commuters, 20.3%), and 5 to 9 minutes (93 commuters, 19.1%).
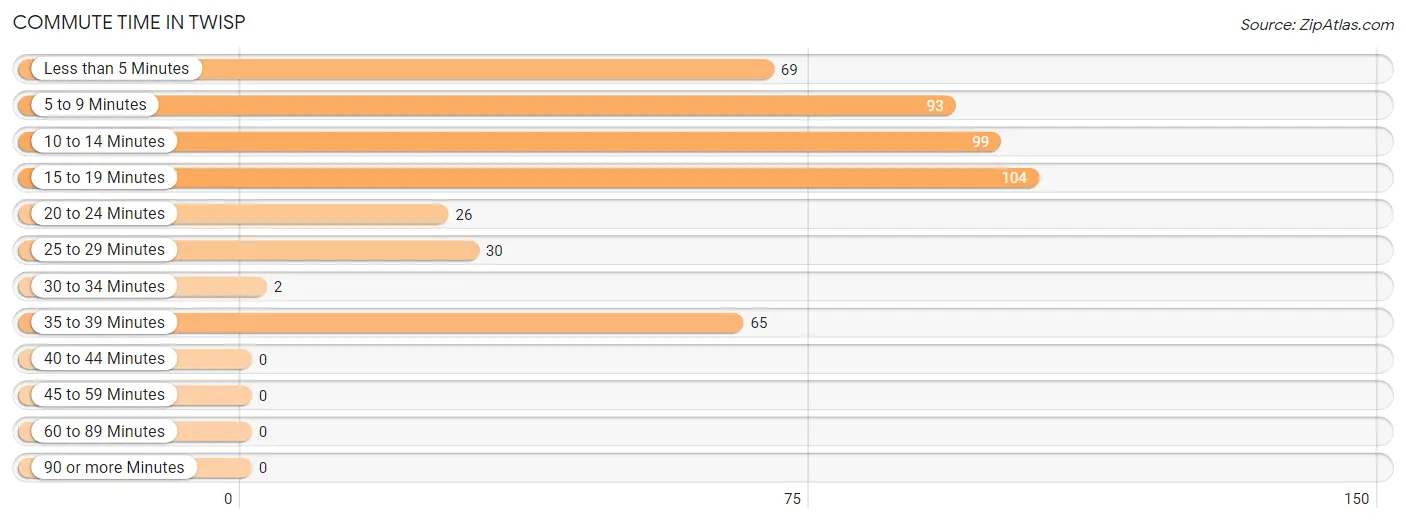
| Commute Time | # Commuters | % Commuters |
| Less than 5 Minutes | 69 | 14.1% |
| 5 to 9 Minutes | 93 | 19.1% |
| 10 to 14 Minutes | 99 | 20.3% |
| 15 to 19 Minutes | 104 | 21.3% |
| 20 to 24 Minutes | 26 | 5.3% |
| 25 to 29 Minutes | 30 | 6.1% |
| 30 to 34 Minutes | 2 | 0.4% |
| 35 to 39 Minutes | 65 | 13.3% |
| 40 to 44 Minutes | 0 | 0.0% |
| 45 to 59 Minutes | 0 | 0.0% |
| 60 to 89 Minutes | 0 | 0.0% |
| 90 or more Minutes | 0 | 0.0% |
Commute Time by Sex in Twisp
The most common commute times in Twisp are 10 to 14 minutes (83 commuters, 29.9%) for males and 15 to 19 minutes (74 commuters, 35.2%) for females.
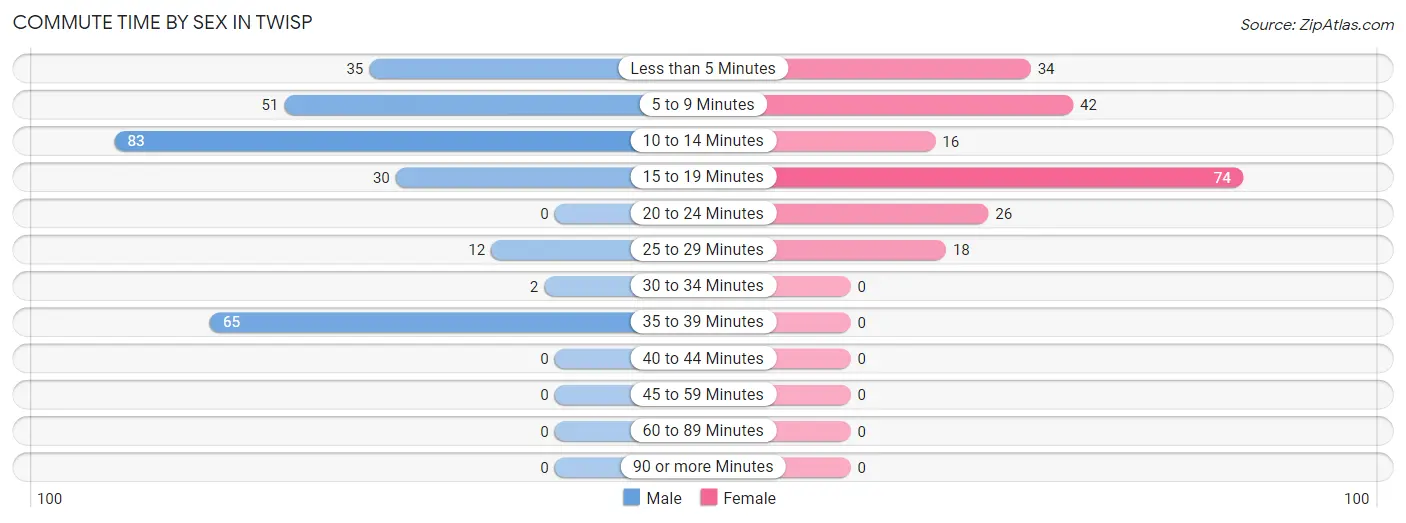
| Commute Time | Male | Female |
| Less than 5 Minutes | 35 (12.6%) | 34 (16.2%) |
| 5 to 9 Minutes | 51 (18.3%) | 42 (20.0%) |
| 10 to 14 Minutes | 83 (29.9%) | 16 (7.6%) |
| 15 to 19 Minutes | 30 (10.8%) | 74 (35.2%) |
| 20 to 24 Minutes | 0 (0.0%) | 26 (12.4%) |
| 25 to 29 Minutes | 12 (4.3%) | 18 (8.6%) |
| 30 to 34 Minutes | 2 (0.7%) | 0 (0.0%) |
| 35 to 39 Minutes | 65 (23.4%) | 0 (0.0%) |
| 40 to 44 Minutes | 0 (0.0%) | 0 (0.0%) |
| 45 to 59 Minutes | 0 (0.0%) | 0 (0.0%) |
| 60 to 89 Minutes | 0 (0.0%) | 0 (0.0%) |
| 90 or more Minutes | 0 (0.0%) | 0 (0.0%) |
Time of Departure to Work by Sex in Twisp
The most frequent times of departure to work in Twisp are 6:30 AM to 6:59 AM (71, 25.5%) for males and 7:30 AM to 7:59 AM (72, 34.3%) for females.
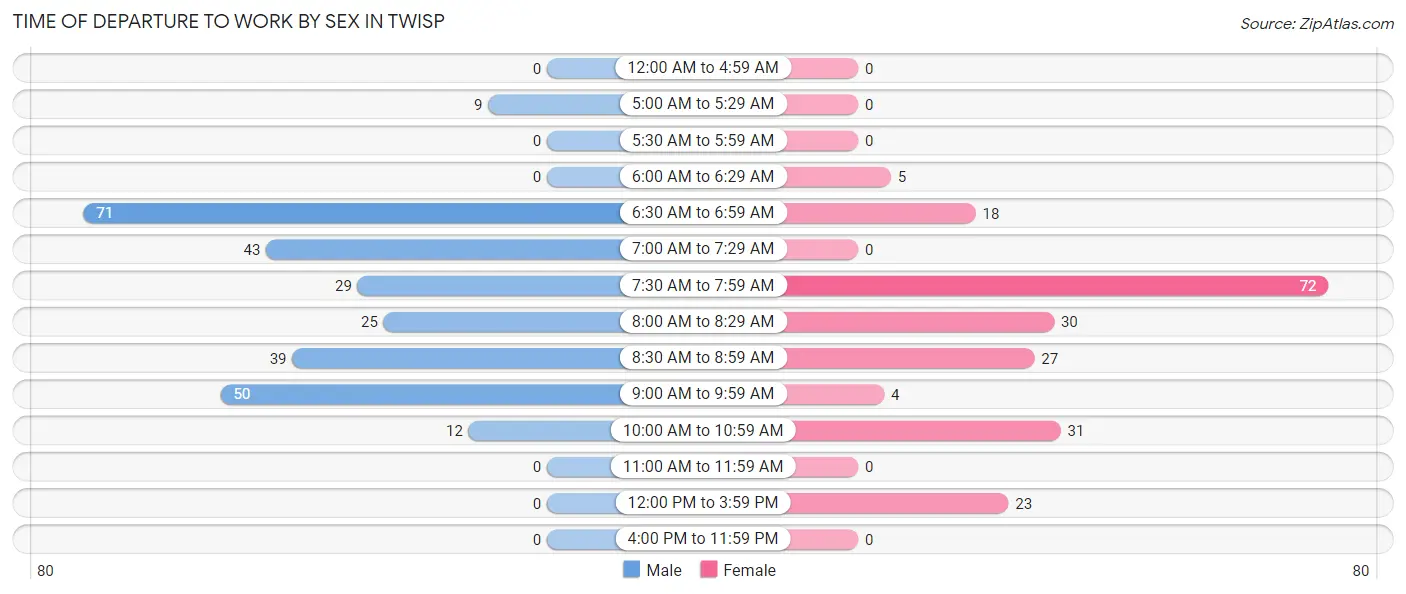
| Time of Departure | Male | Female |
| 12:00 AM to 4:59 AM | 0 (0.0%) | 0 (0.0%) |
| 5:00 AM to 5:29 AM | 9 (3.2%) | 0 (0.0%) |
| 5:30 AM to 5:59 AM | 0 (0.0%) | 0 (0.0%) |
| 6:00 AM to 6:29 AM | 0 (0.0%) | 5 (2.4%) |
| 6:30 AM to 6:59 AM | 71 (25.5%) | 18 (8.6%) |
| 7:00 AM to 7:29 AM | 43 (15.5%) | 0 (0.0%) |
| 7:30 AM to 7:59 AM | 29 (10.4%) | 72 (34.3%) |
| 8:00 AM to 8:29 AM | 25 (9.0%) | 30 (14.3%) |
| 8:30 AM to 8:59 AM | 39 (14.0%) | 27 (12.9%) |
| 9:00 AM to 9:59 AM | 50 (18.0%) | 4 (1.9%) |
| 10:00 AM to 10:59 AM | 12 (4.3%) | 31 (14.8%) |
| 11:00 AM to 11:59 AM | 0 (0.0%) | 0 (0.0%) |
| 12:00 PM to 3:59 PM | 0 (0.0%) | 23 (11.0%) |
| 4:00 PM to 11:59 PM | 0 (0.0%) | 0 (0.0%) |
| Total | 278 (100.0%) | 210 (100.0%) |
Housing Occupancy in Twisp
Occupancy by Ownership in Twisp
Of the total 535 dwellings in Twisp, owner-occupied units account for 284 (53.1%), while renter-occupied units make up 251 (46.9%).
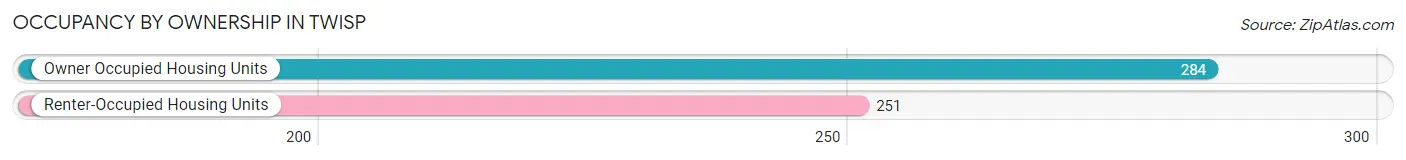
| Occupancy | # Housing Units | % Housing Units |
| Owner Occupied Housing Units | 284 | 53.1% |
| Renter-Occupied Housing Units | 251 | 46.9% |
| Total Occupied Housing Units | 535 | 100.0% |
Occupancy by Household Size in Twisp
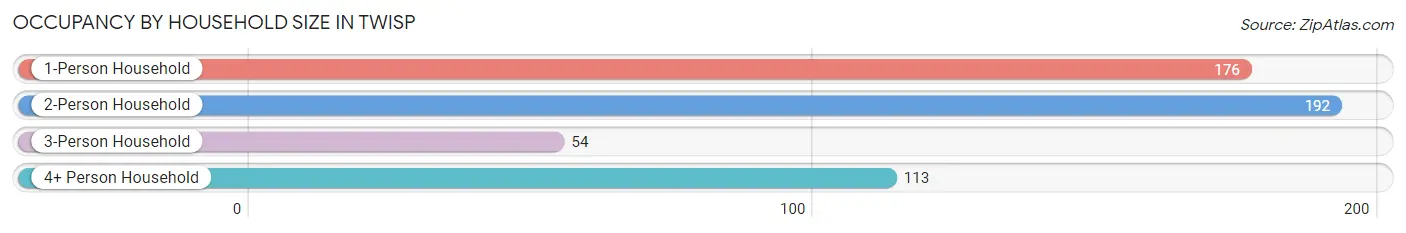
| Household Size | # Housing Units | % Housing Units |
| 1-Person Household | 176 | 32.9% |
| 2-Person Household | 192 | 35.9% |
| 3-Person Household | 54 | 10.1% |
| 4+ Person Household | 113 | 21.1% |
| Total Housing Units | 535 | 100.0% |
Occupancy by Ownership by Household Size in Twisp
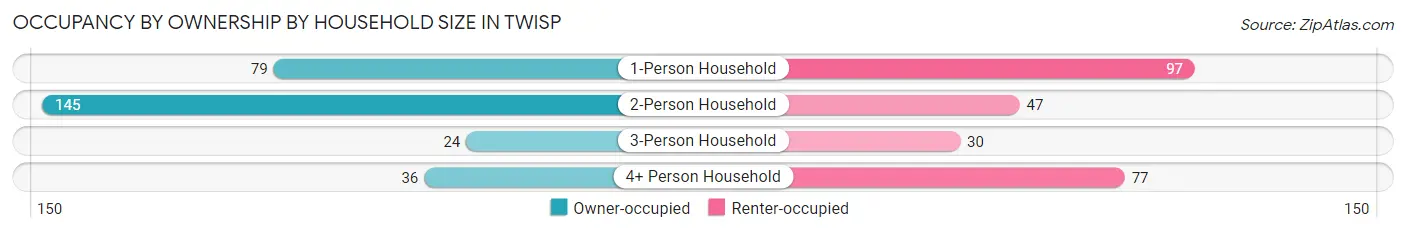
| Household Size | Owner-occupied | Renter-occupied |
| 1-Person Household | 79 (44.9%) | 97 (55.1%) |
| 2-Person Household | 145 (75.5%) | 47 (24.5%) |
| 3-Person Household | 24 (44.4%) | 30 (55.6%) |
| 4+ Person Household | 36 (31.9%) | 77 (68.1%) |
| Total Housing Units | 284 (53.1%) | 251 (46.9%) |
Occupancy by Educational Attainment in Twisp
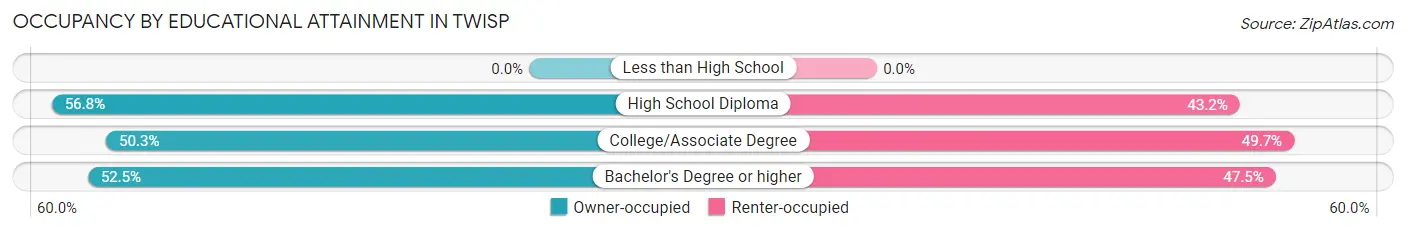
| Household Size | Owner-occupied | Renter-occupied |
| Less than High School | 0 (0.0%) | 0 (0.0%) |
| High School Diploma | 88 (56.8%) | 67 (43.2%) |
| College/Associate Degree | 80 (50.3%) | 79 (49.7%) |
| Bachelor's Degree or higher | 116 (52.5%) | 105 (47.5%) |
Occupancy by Age of Householder in Twisp
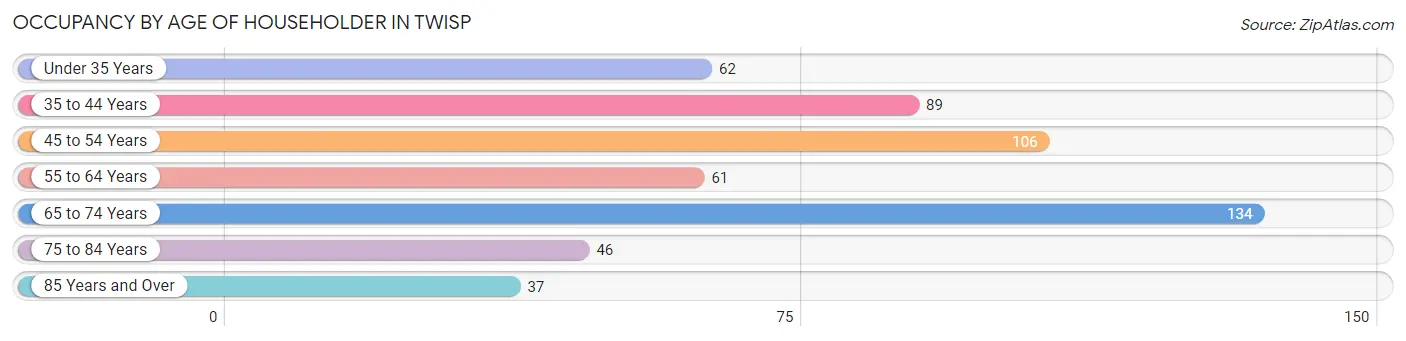
| Age Bracket | # Households | % Households |
| Under 35 Years | 62 | 11.6% |
| 35 to 44 Years | 89 | 16.6% |
| 45 to 54 Years | 106 | 19.8% |
| 55 to 64 Years | 61 | 11.4% |
| 65 to 74 Years | 134 | 25.1% |
| 75 to 84 Years | 46 | 8.6% |
| 85 Years and Over | 37 | 6.9% |
| Total | 535 | 100.0% |
Housing Finances in Twisp
Median Income by Occupancy in Twisp
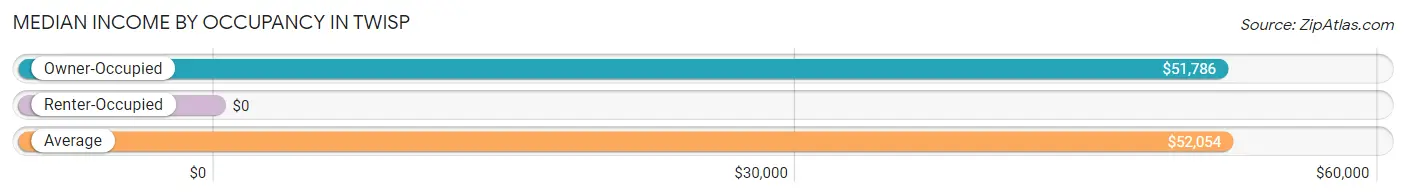
| Occupancy Type | # Households | Median Income |
| Owner-Occupied | 284 (53.1%) | $51,786 |
| Renter-Occupied | 251 (46.9%) | $0 |
| Average | 535 (100.0%) | $52,054 |
Occupancy by Householder Income Bracket in Twisp
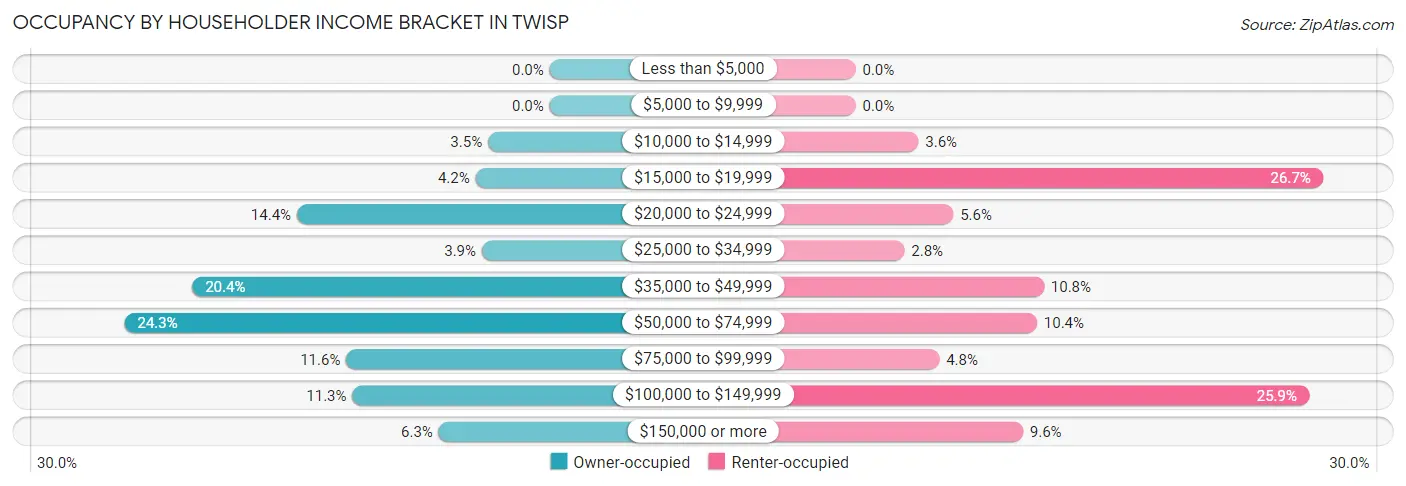
| Income Bracket | Owner-occupied | Renter-occupied |
| Less than $5,000 | 0 (0.0%) | 0 (0.0%) |
| $5,000 to $9,999 | 0 (0.0%) | 0 (0.0%) |
| $10,000 to $14,999 | 10 (3.5%) | 9 (3.6%) |
| $15,000 to $19,999 | 12 (4.2%) | 67 (26.7%) |
| $20,000 to $24,999 | 41 (14.4%) | 14 (5.6%) |
| $25,000 to $34,999 | 11 (3.9%) | 7 (2.8%) |
| $35,000 to $49,999 | 58 (20.4%) | 27 (10.8%) |
| $50,000 to $74,999 | 69 (24.3%) | 26 (10.4%) |
| $75,000 to $99,999 | 33 (11.6%) | 12 (4.8%) |
| $100,000 to $149,999 | 32 (11.3%) | 65 (25.9%) |
| $150,000 or more | 18 (6.3%) | 24 (9.6%) |
| Total | 284 (100.0%) | 251 (100.0%) |
Monthly Housing Cost Tiers in Twisp
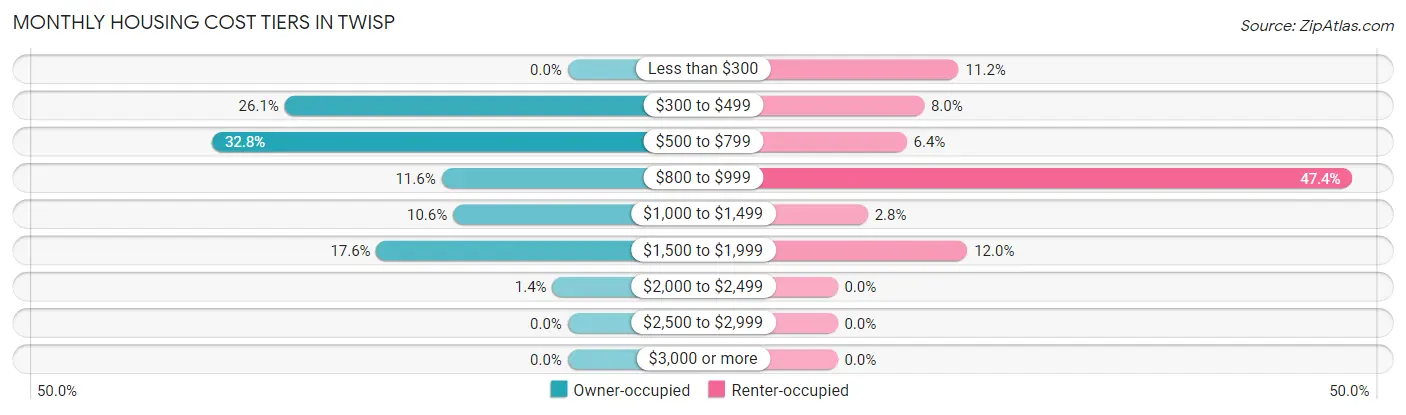
| Monthly Cost | Owner-occupied | Renter-occupied |
| Less than $300 | 0 (0.0%) | 28 (11.2%) |
| $300 to $499 | 74 (26.1%) | 20 (8.0%) |
| $500 to $799 | 93 (32.8%) | 16 (6.4%) |
| $800 to $999 | 33 (11.6%) | 119 (47.4%) |
| $1,000 to $1,499 | 30 (10.6%) | 7 (2.8%) |
| $1,500 to $1,999 | 50 (17.6%) | 30 (11.9%) |
| $2,000 to $2,499 | 4 (1.4%) | 0 (0.0%) |
| $2,500 to $2,999 | 0 (0.0%) | 0 (0.0%) |
| $3,000 or more | 0 (0.0%) | 0 (0.0%) |
| Total | 284 (100.0%) | 251 (100.0%) |
Physical Housing Characteristics in Twisp
Housing Structures in Twisp
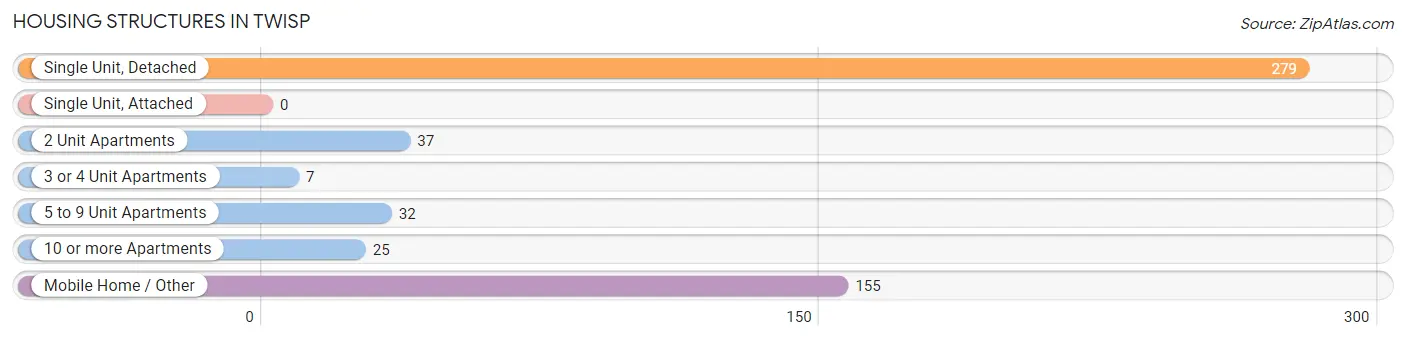
| Structure Type | # Housing Units | % Housing Units |
| Single Unit, Detached | 279 | 52.1% |
| Single Unit, Attached | 0 | 0.0% |
| 2 Unit Apartments | 37 | 6.9% |
| 3 or 4 Unit Apartments | 7 | 1.3% |
| 5 to 9 Unit Apartments | 32 | 6.0% |
| 10 or more Apartments | 25 | 4.7% |
| Mobile Home / Other | 155 | 29.0% |
| Total | 535 | 100.0% |
Housing Structures by Occupancy in Twisp
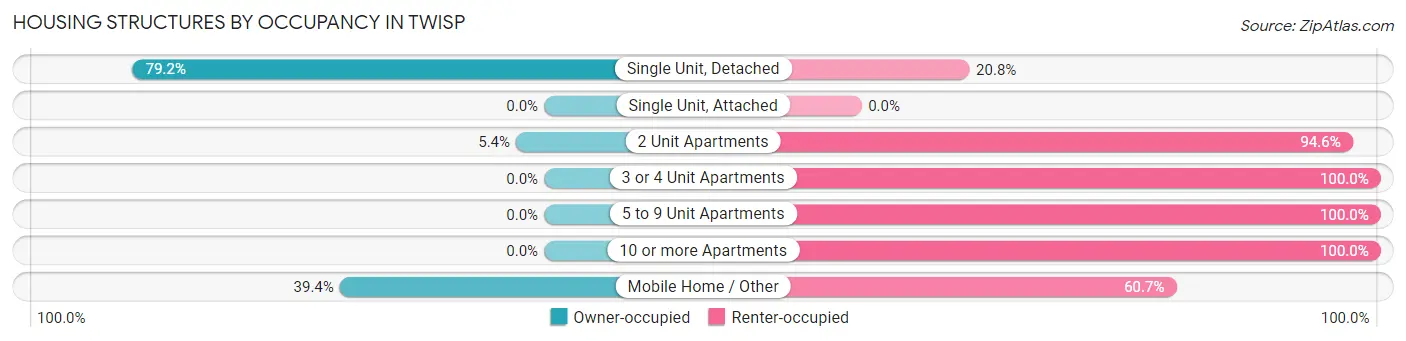
| Structure Type | Owner-occupied | Renter-occupied |
| Single Unit, Detached | 221 (79.2%) | 58 (20.8%) |
| Single Unit, Attached | 0 (0.0%) | 0 (0.0%) |
| 2 Unit Apartments | 2 (5.4%) | 35 (94.6%) |
| 3 or 4 Unit Apartments | 0 (0.0%) | 7 (100.0%) |
| 5 to 9 Unit Apartments | 0 (0.0%) | 32 (100.0%) |
| 10 or more Apartments | 0 (0.0%) | 25 (100.0%) |
| Mobile Home / Other | 61 (39.4%) | 94 (60.7%) |
| Total | 284 (53.1%) | 251 (46.9%) |
Housing Structures by Number of Rooms in Twisp
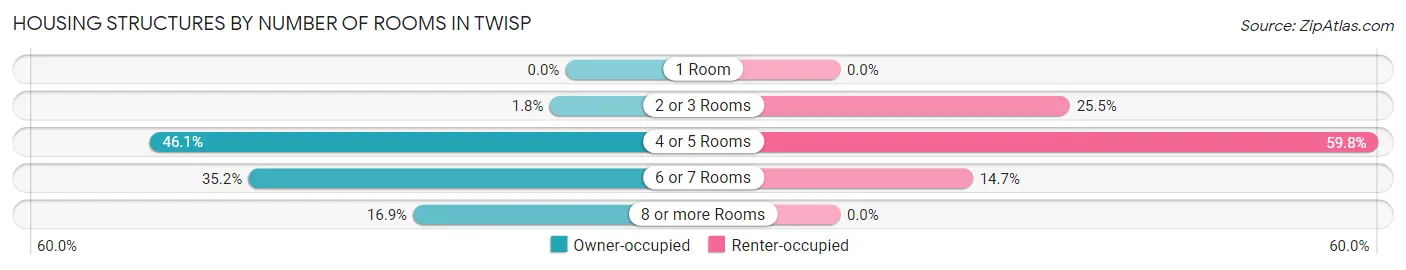
| Number of Rooms | Owner-occupied | Renter-occupied |
| 1 Room | 0 (0.0%) | 0 (0.0%) |
| 2 or 3 Rooms | 5 (1.8%) | 64 (25.5%) |
| 4 or 5 Rooms | 131 (46.1%) | 150 (59.8%) |
| 6 or 7 Rooms | 100 (35.2%) | 37 (14.7%) |
| 8 or more Rooms | 48 (16.9%) | 0 (0.0%) |
| Total | 284 (100.0%) | 251 (100.0%) |
Housing Structure by Heating Type in Twisp
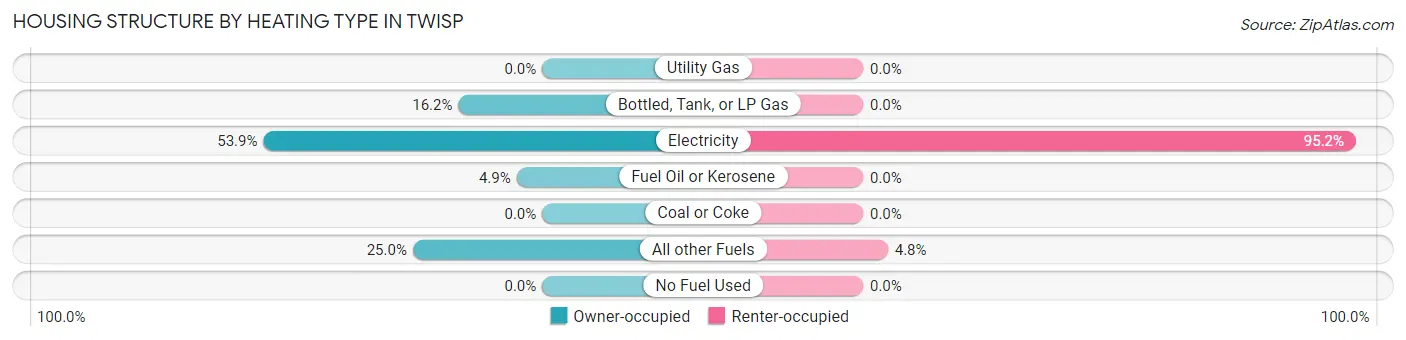
| Heating Type | Owner-occupied | Renter-occupied |
| Utility Gas | 0 (0.0%) | 0 (0.0%) |
| Bottled, Tank, or LP Gas | 46 (16.2%) | 0 (0.0%) |
| Electricity | 153 (53.9%) | 239 (95.2%) |
| Fuel Oil or Kerosene | 14 (4.9%) | 0 (0.0%) |
| Coal or Coke | 0 (0.0%) | 0 (0.0%) |
| All other Fuels | 71 (25.0%) | 12 (4.8%) |
| No Fuel Used | 0 (0.0%) | 0 (0.0%) |
| Total | 284 (100.0%) | 251 (100.0%) |
Household Vehicle Usage in Twisp
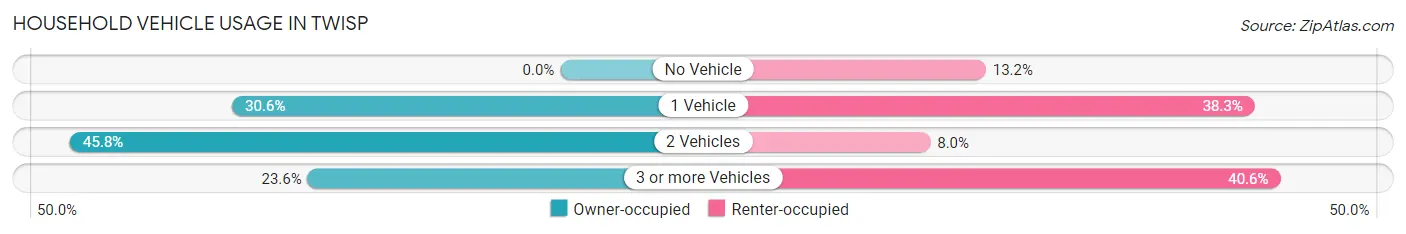
| Vehicles per Household | Owner-occupied | Renter-occupied |
| No Vehicle | 0 (0.0%) | 33 (13.2%) |
| 1 Vehicle | 87 (30.6%) | 96 (38.3%) |
| 2 Vehicles | 130 (45.8%) | 20 (8.0%) |
| 3 or more Vehicles | 67 (23.6%) | 102 (40.6%) |
| Total | 284 (100.0%) | 251 (100.0%) |
Real Estate & Mortgages in Twisp
Real Estate and Mortgage Overview in Twisp
| Characteristic | Without Mortgage | With Mortgage |
| Housing Units | 173 | 111 |
| Median Property Value | $302,700 | $246,600 |
| Median Household Income | $39,886 | $6 |
| Monthly Housing Costs | $531 | $0 |
| Real Estate Taxes | $1,929 | $0 |
Property Value by Mortgage Status in Twisp
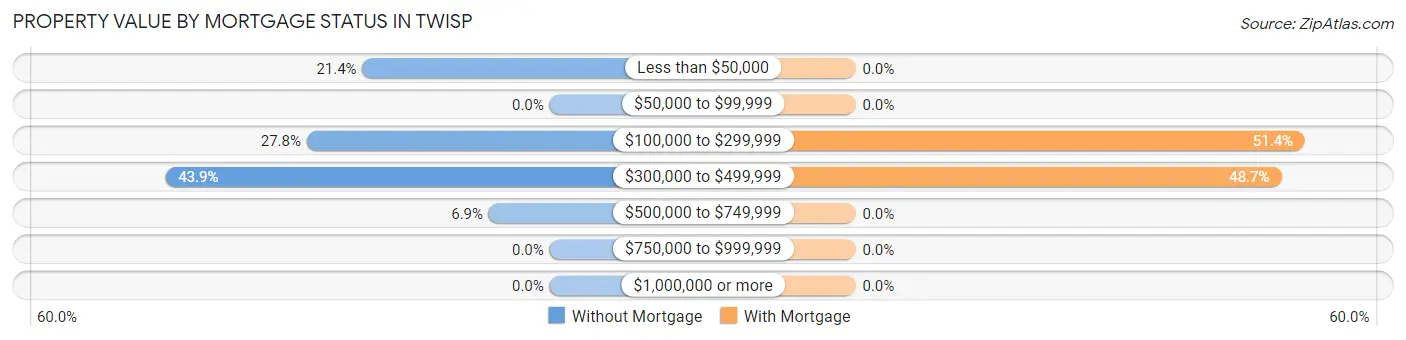
| Property Value | Without Mortgage | With Mortgage |
| Less than $50,000 | 37 (21.4%) | 0 (0.0%) |
| $50,000 to $99,999 | 0 (0.0%) | 0 (0.0%) |
| $100,000 to $299,999 | 48 (27.8%) | 57 (51.3%) |
| $300,000 to $499,999 | 76 (43.9%) | 54 (48.6%) |
| $500,000 to $749,999 | 12 (6.9%) | 0 (0.0%) |
| $750,000 to $999,999 | 0 (0.0%) | 0 (0.0%) |
| $1,000,000 or more | 0 (0.0%) | 0 (0.0%) |
| Total | 173 (100.0%) | 111 (100.0%) |
Household Income by Mortgage Status in Twisp
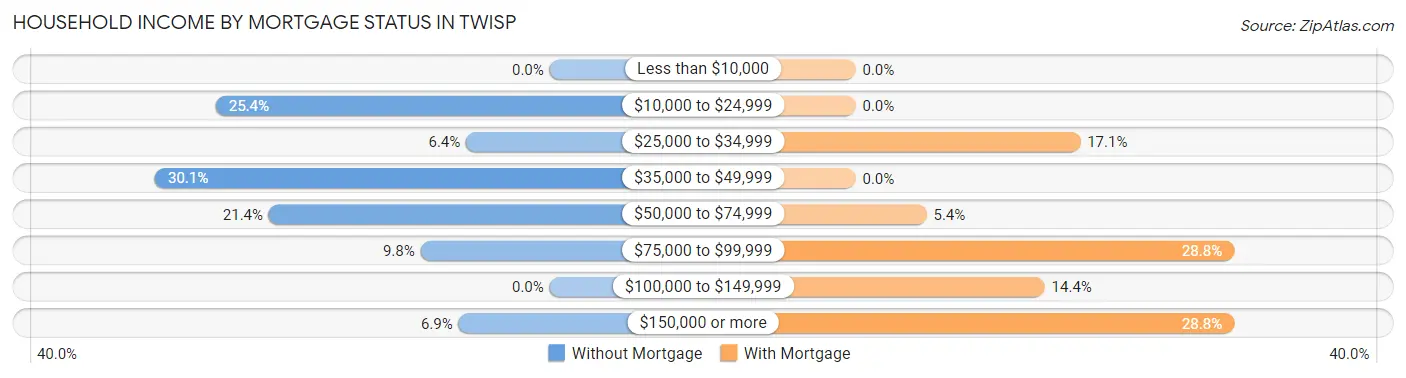
| Household Income | Without Mortgage | With Mortgage |
| Less than $10,000 | 0 (0.0%) | 0 (0.0%) |
| $10,000 to $24,999 | 44 (25.4%) | 0 (0.0%) |
| $25,000 to $34,999 | 11 (6.4%) | 19 (17.1%) |
| $35,000 to $49,999 | 52 (30.1%) | 0 (0.0%) |
| $50,000 to $74,999 | 37 (21.4%) | 6 (5.4%) |
| $75,000 to $99,999 | 17 (9.8%) | 32 (28.8%) |
| $100,000 to $149,999 | 0 (0.0%) | 16 (14.4%) |
| $150,000 or more | 12 (6.9%) | 32 (28.8%) |
| Total | 173 (100.0%) | 111 (100.0%) |
Property Value to Household Income Ratio in Twisp
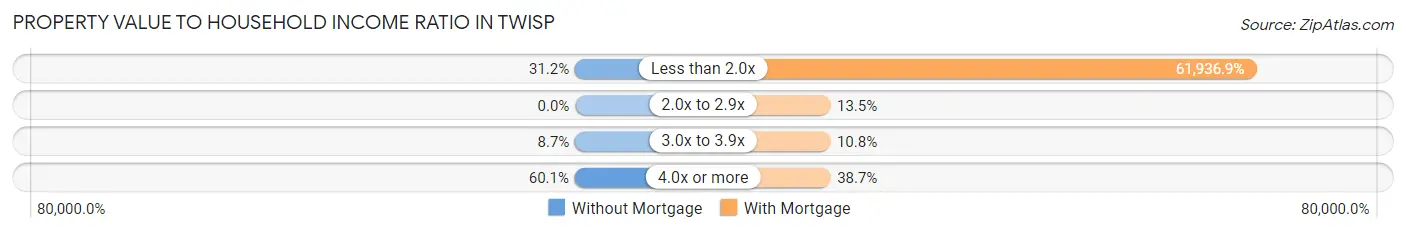
| Value-to-Income Ratio | Without Mortgage | With Mortgage |
| Less than 2.0x | 54 (31.2%) | 68,750 (61,936.9%) |
| 2.0x to 2.9x | 0 (0.0%) | 15 (13.5%) |
| 3.0x to 3.9x | 15 (8.7%) | 12 (10.8%) |
| 4.0x or more | 104 (60.1%) | 43 (38.7%) |
| Total | 173 (100.0%) | 111 (100.0%) |
Real Estate Taxes by Mortgage Status in Twisp
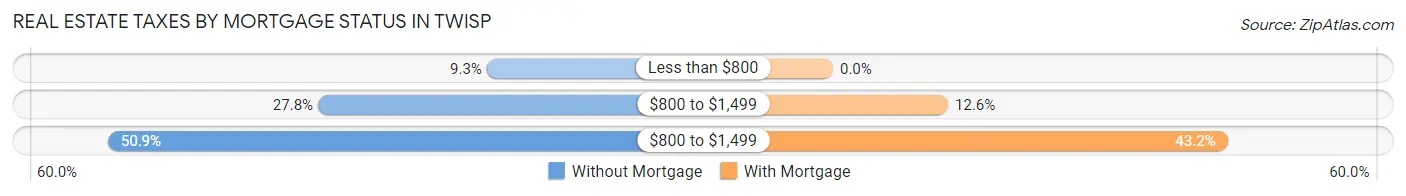
| Property Taxes | Without Mortgage | With Mortgage |
| Less than $800 | 16 (9.2%) | 0 (0.0%) |
| $800 to $1,499 | 48 (27.8%) | 14 (12.6%) |
| $800 to $1,499 | 88 (50.9%) | 48 (43.2%) |
| Total | 173 (100.0%) | 111 (100.0%) |
Health & Disability in Twisp
Health Insurance Coverage by Age in Twisp
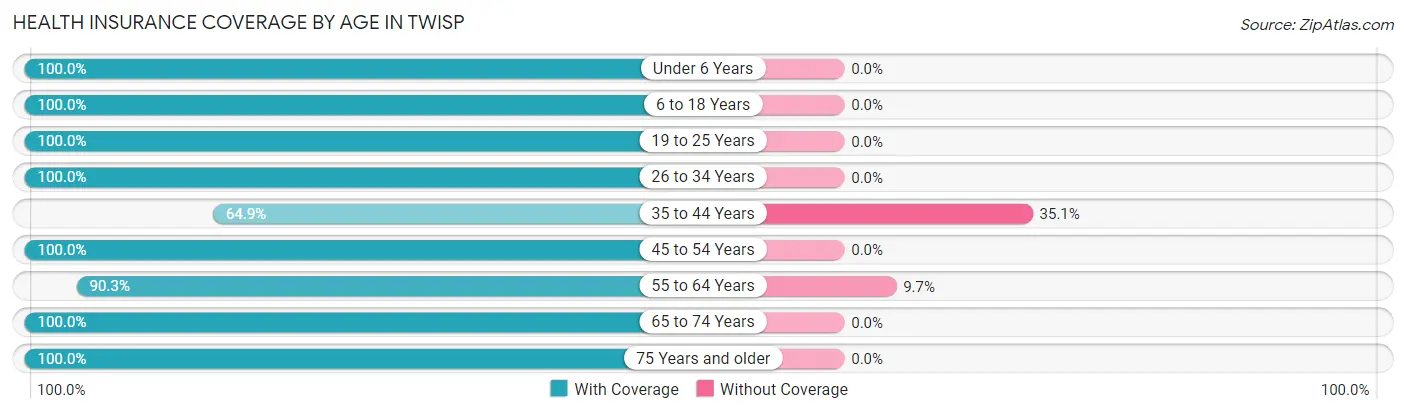
| Age Bracket | With Coverage | Without Coverage |
| Under 6 Years | 49 (100.0%) | 0 (0.0%) |
| 6 to 18 Years | 149 (100.0%) | 0 (0.0%) |
| 19 to 25 Years | 61 (100.0%) | 0 (0.0%) |
| 26 to 34 Years | 95 (100.0%) | 0 (0.0%) |
| 35 to 44 Years | 109 (64.9%) | 59 (35.1%) |
| 45 to 54 Years | 52 (100.0%) | 0 (0.0%) |
| 55 to 64 Years | 112 (90.3%) | 12 (9.7%) |
| 65 to 74 Years | 200 (100.0%) | 0 (0.0%) |
| 75 Years and older | 132 (100.0%) | 0 (0.0%) |
| Total | 959 (93.1%) | 71 (6.9%) |
Health Insurance Coverage by Citizenship Status in Twisp
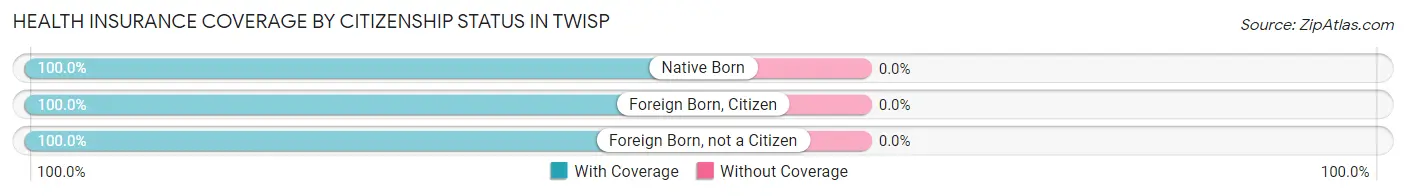
| Citizenship Status | With Coverage | Without Coverage |
| Native Born | 49 (100.0%) | 0 (0.0%) |
| Foreign Born, Citizen | 149 (100.0%) | 0 (0.0%) |
| Foreign Born, not a Citizen | 61 (100.0%) | 0 (0.0%) |
Health Insurance Coverage by Household Income in Twisp
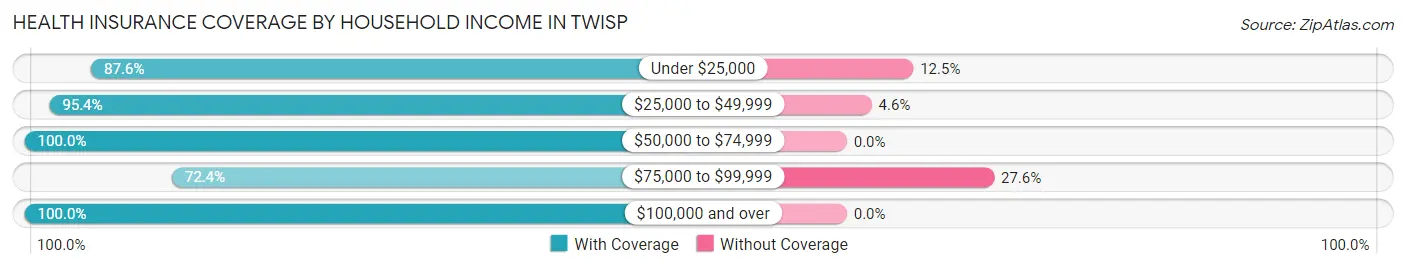
| Household Income | With Coverage | Without Coverage |
| Under $25,000 | 225 (87.5%) | 32 (12.4%) |
| $25,000 to $49,999 | 144 (95.4%) | 7 (4.6%) |
| $50,000 to $74,999 | 215 (100.0%) | 0 (0.0%) |
| $75,000 to $99,999 | 84 (72.4%) | 32 (27.6%) |
| $100,000 and over | 291 (100.0%) | 0 (0.0%) |
Public vs Private Health Insurance Coverage by Age in Twisp
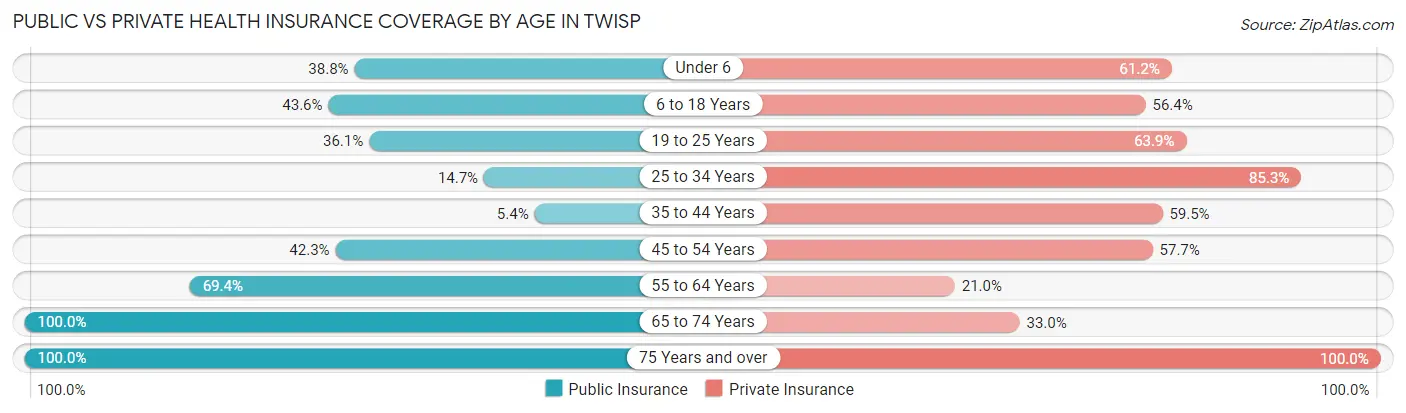
| Age Bracket | Public Insurance | Private Insurance |
| Under 6 | 19 (38.8%) | 30 (61.2%) |
| 6 to 18 Years | 65 (43.6%) | 84 (56.4%) |
| 19 to 25 Years | 22 (36.1%) | 39 (63.9%) |
| 25 to 34 Years | 14 (14.7%) | 81 (85.3%) |
| 35 to 44 Years | 9 (5.4%) | 100 (59.5%) |
| 45 to 54 Years | 22 (42.3%) | 30 (57.7%) |
| 55 to 64 Years | 86 (69.4%) | 26 (21.0%) |
| 65 to 74 Years | 200 (100.0%) | 66 (33.0%) |
| 75 Years and over | 132 (100.0%) | 132 (100.0%) |
| Total | 569 (55.2%) | 588 (57.1%) |
Disability Status by Sex by Age in Twisp
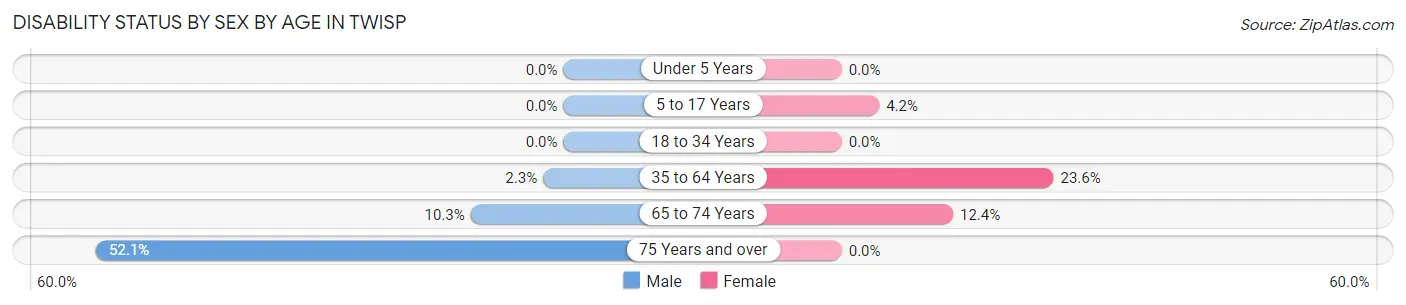
| Age Bracket | Male | Female |
| Under 5 Years | 0 (0.0%) | 0 (0.0%) |
| 5 to 17 Years | 0 (0.0%) | 4 (4.2%) |
| 18 to 34 Years | 0 (0.0%) | 0 (0.0%) |
| 35 to 64 Years | 3 (2.3%) | 50 (23.6%) |
| 65 to 74 Years | 9 (10.3%) | 14 (12.4%) |
| 75 Years and over | 38 (52.0%) | 0 (0.0%) |
Disability Class by Sex by Age in Twisp
Disability Class: Hearing Difficulty
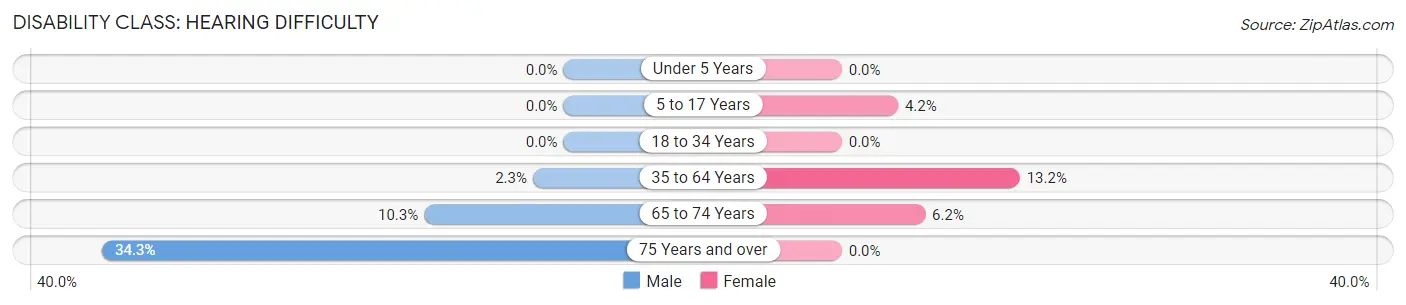
| Age Bracket | Male | Female |
| Under 5 Years | 0 (0.0%) | 0 (0.0%) |
| 5 to 17 Years | 0 (0.0%) | 4 (4.2%) |
| 18 to 34 Years | 0 (0.0%) | 0 (0.0%) |
| 35 to 64 Years | 3 (2.3%) | 28 (13.2%) |
| 65 to 74 Years | 9 (10.3%) | 7 (6.2%) |
| 75 Years and over | 25 (34.3%) | 0 (0.0%) |
Disability Class: Vision Difficulty
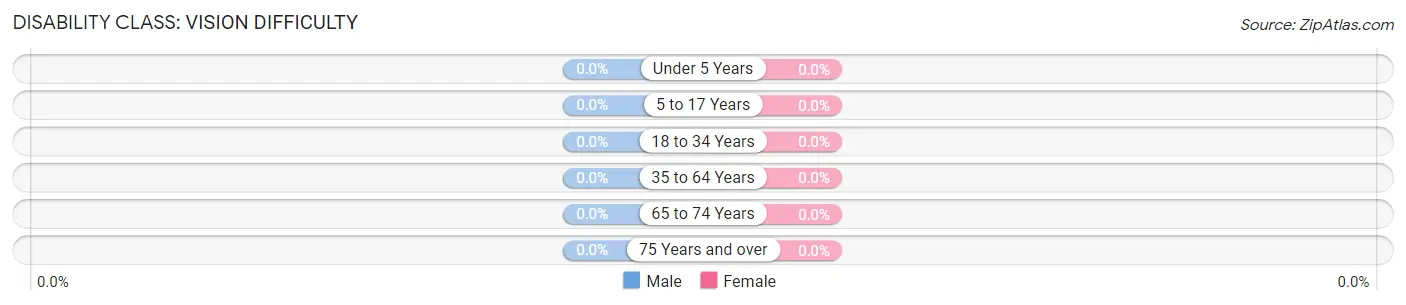
| Age Bracket | Male | Female |
| Under 5 Years | 0 (0.0%) | 0 (0.0%) |
| 5 to 17 Years | 0 (0.0%) | 0 (0.0%) |
| 18 to 34 Years | 0 (0.0%) | 0 (0.0%) |
| 35 to 64 Years | 0 (0.0%) | 0 (0.0%) |
| 65 to 74 Years | 0 (0.0%) | 0 (0.0%) |
| 75 Years and over | 0 (0.0%) | 0 (0.0%) |
Disability Class: Cognitive Difficulty
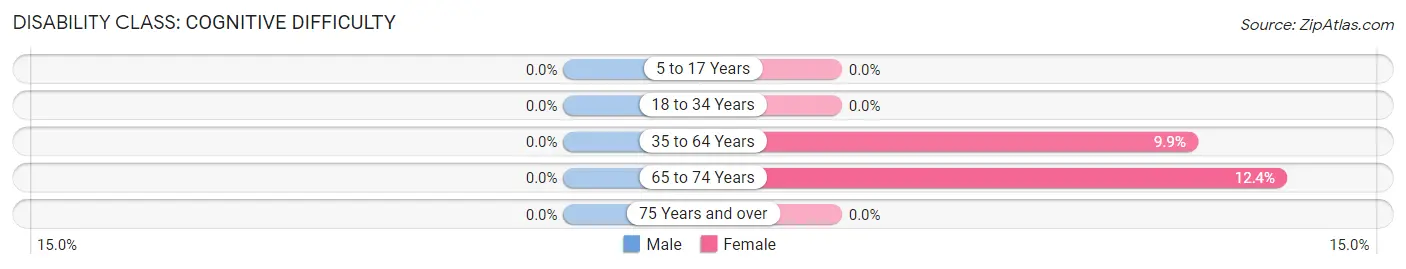
| Age Bracket | Male | Female |
| 5 to 17 Years | 0 (0.0%) | 0 (0.0%) |
| 18 to 34 Years | 0 (0.0%) | 0 (0.0%) |
| 35 to 64 Years | 0 (0.0%) | 21 (9.9%) |
| 65 to 74 Years | 0 (0.0%) | 14 (12.4%) |
| 75 Years and over | 0 (0.0%) | 0 (0.0%) |
Disability Class: Ambulatory Difficulty
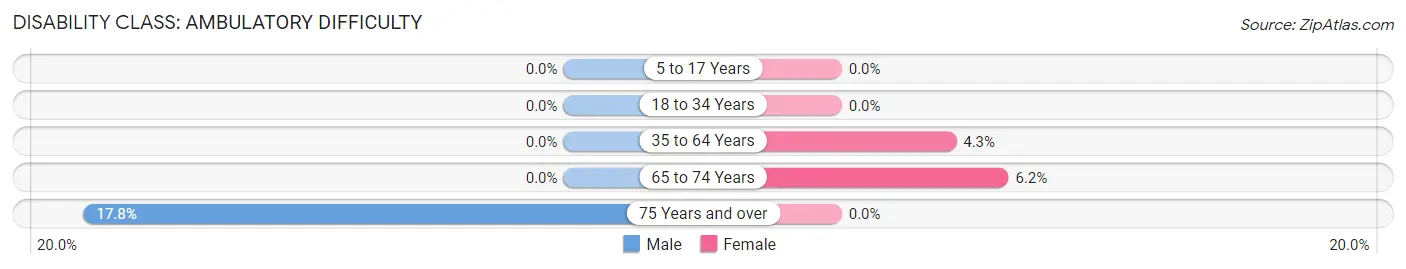
| Age Bracket | Male | Female |
| 5 to 17 Years | 0 (0.0%) | 0 (0.0%) |
| 18 to 34 Years | 0 (0.0%) | 0 (0.0%) |
| 35 to 64 Years | 0 (0.0%) | 9 (4.3%) |
| 65 to 74 Years | 0 (0.0%) | 7 (6.2%) |
| 75 Years and over | 13 (17.8%) | 0 (0.0%) |
Disability Class: Self-Care Difficulty
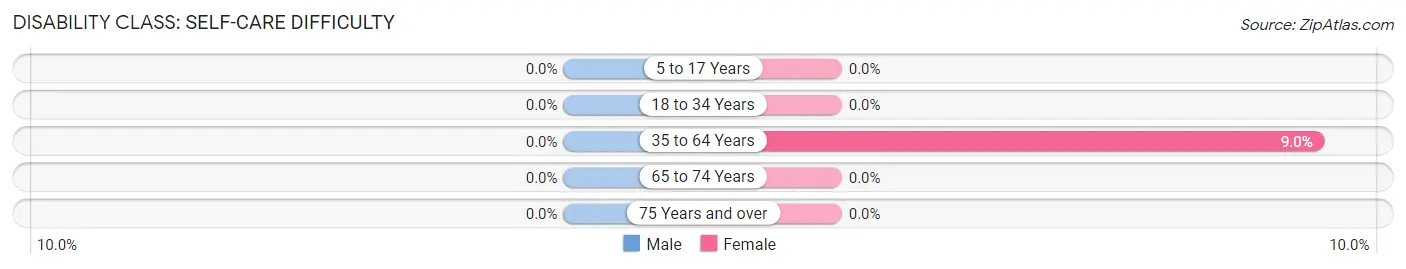
| Age Bracket | Male | Female |
| 5 to 17 Years | 0 (0.0%) | 0 (0.0%) |
| 18 to 34 Years | 0 (0.0%) | 0 (0.0%) |
| 35 to 64 Years | 0 (0.0%) | 19 (9.0%) |
| 65 to 74 Years | 0 (0.0%) | 0 (0.0%) |
| 75 Years and over | 0 (0.0%) | 0 (0.0%) |
Technology Access in Twisp
Computing Device Access in Twisp
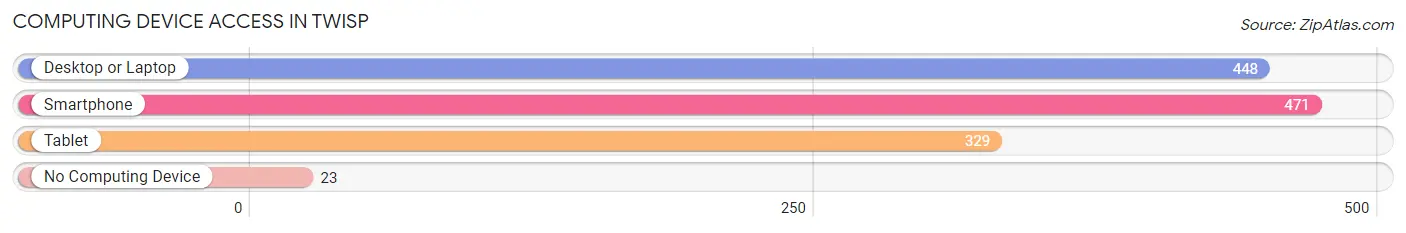
| Device Type | # Households | % Households |
| Desktop or Laptop | 448 | 83.7% |
| Smartphone | 471 | 88.0% |
| Tablet | 329 | 61.5% |
| No Computing Device | 23 | 4.3% |
| Total | 535 | 100.0% |
Internet Access in Twisp
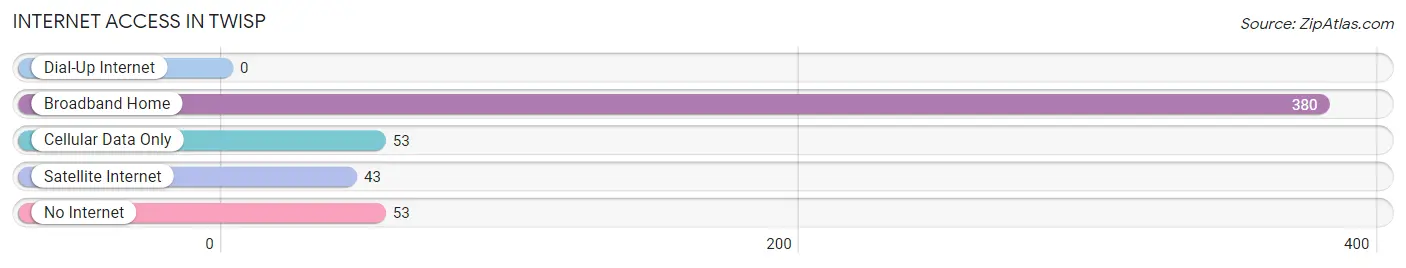
| Internet Type | # Households | % Households |
| Dial-Up Internet | 0 | 0.0% |
| Broadband Home | 380 | 71.0% |
| Cellular Data Only | 53 | 9.9% |
| Satellite Internet | 43 | 8.0% |
| No Internet | 53 | 9.9% |
| Total | 535 | 100.0% |
Twisp Summary
Twisp, Washington is a small town located in the Methow Valley of Okanogan County in the North Central region of the state. The town is situated at the confluence of the Methow and Twisp Rivers, and is surrounded by the Cascade Mountains. The population of Twisp was 890 at the 2010 census, making it the smallest incorporated town in the state.
Geography
Twisp is located at the confluence of the Methow and Twisp Rivers, in the Methow Valley of Okanogan County. The town is situated at the base of the Cascade Mountains, and is surrounded by the Okanogan National Forest. The town is located at an elevation of 1,717 feet (524 m). The nearest major cities are Wenatchee, Washington, located approximately 75 miles (121 km) to the south, and Spokane, Washington, located approximately 140 miles (225 km) to the east.
Climate
Twisp has a semi-arid climate, with hot summers and cold winters. The average annual temperature is 44.3°F (6.8°C), and the average annual precipitation is 11.3 inches (286 mm). The average snowfall is 28.3 inches (719 mm).
Demographics
As of the 2010 census, there were 890 people, 393 households, and 233 families residing in Twisp. The population density was 1,072.3 people per square mile (414.7/km2). The racial makeup of the town was 94.2% White, 0.3% African American, 1.2% Native American, 0.3% Asian, 0.1% Pacific Islander, 0.7% from other races, and 3.3% from two or more races. Hispanic or Latino of any race were 3.3% of the population.
Economy
The economy of Twisp is largely based on tourism, agriculture, and forestry. The town is home to several wineries, and is a popular destination for outdoor recreation, such as hiking, camping, fishing, and skiing. The town is also home to several small businesses, including restaurants, retail stores, and art galleries.
The town is also home to several large employers, including the Methow Valley School District, the Okanogan County Public Utility District, and the Methow Valley Community Hospital.
Conclusion
Twisp, Washington is a small town located in the Methow Valley of Okanogan County in the North Central region of the state. The town is situated at the confluence of the Methow and Twisp Rivers, and is surrounded by the Cascade Mountains. The population of Twisp was 890 at the 2010 census, making it the smallest incorporated town in the state. The economy of Twisp is largely based on tourism, agriculture, and forestry. The town is home to several wineries, and is a popular destination for outdoor recreation. The town is also home to several large employers, including the Methow Valley School District, the Okanogan County Public Utility District, and the Methow Valley Community Hospital.
Common Questions
What is Per Capita Income in Twisp?
Per Capita income in Twisp is $37,779.
What is the Median Family Income in Twisp?
Median Family Income in Twisp is $67,188.
What is the Median Household income in Twisp?
Median Household Income in Twisp is $52,054.
What is Income or Wage Gap in Twisp?
Income or Wage Gap in Twisp is 69.4%.
Women in Twisp earn 30.6 cents for every dollar earned by a man.
What is Inequality or Gini Index in Twisp?
Inequality or Gini Index in Twisp is 0.50.
What is the Total Population of Twisp?
Total Population of Twisp is 1,095.
What is the Total Male Population of Twisp?
Total Male Population of Twisp is 537.
What is the Total Female Population of Twisp?
Total Female Population of Twisp is 558.
What is the Ratio of Males per 100 Females in Twisp?
There are 96.24 Males per 100 Females in Twisp.
What is the Ratio of Females per 100 Males in Twisp?
There are 103.91 Females per 100 Males in Twisp.
What is the Median Population Age in Twisp?
Median Population Age in Twisp is 45.4 Years.
What is the Average Family Size in Twisp
Average Family Size in Twisp is 2.5 People.
What is the Average Household Size in Twisp
Average Household Size in Twisp is 2.0 People.
How Large is the Labor Force in Twisp?
There are 543 People in the Labor Forcein in Twisp.
What is the Percentage of People in the Labor Force in Twisp?
59.5% of People are in the Labor Force in Twisp.
What is the Unemployment Rate in Twisp?
Unemployment Rate in Twisp is 10.3%.