Copalis Beach, WA Map & Demographics
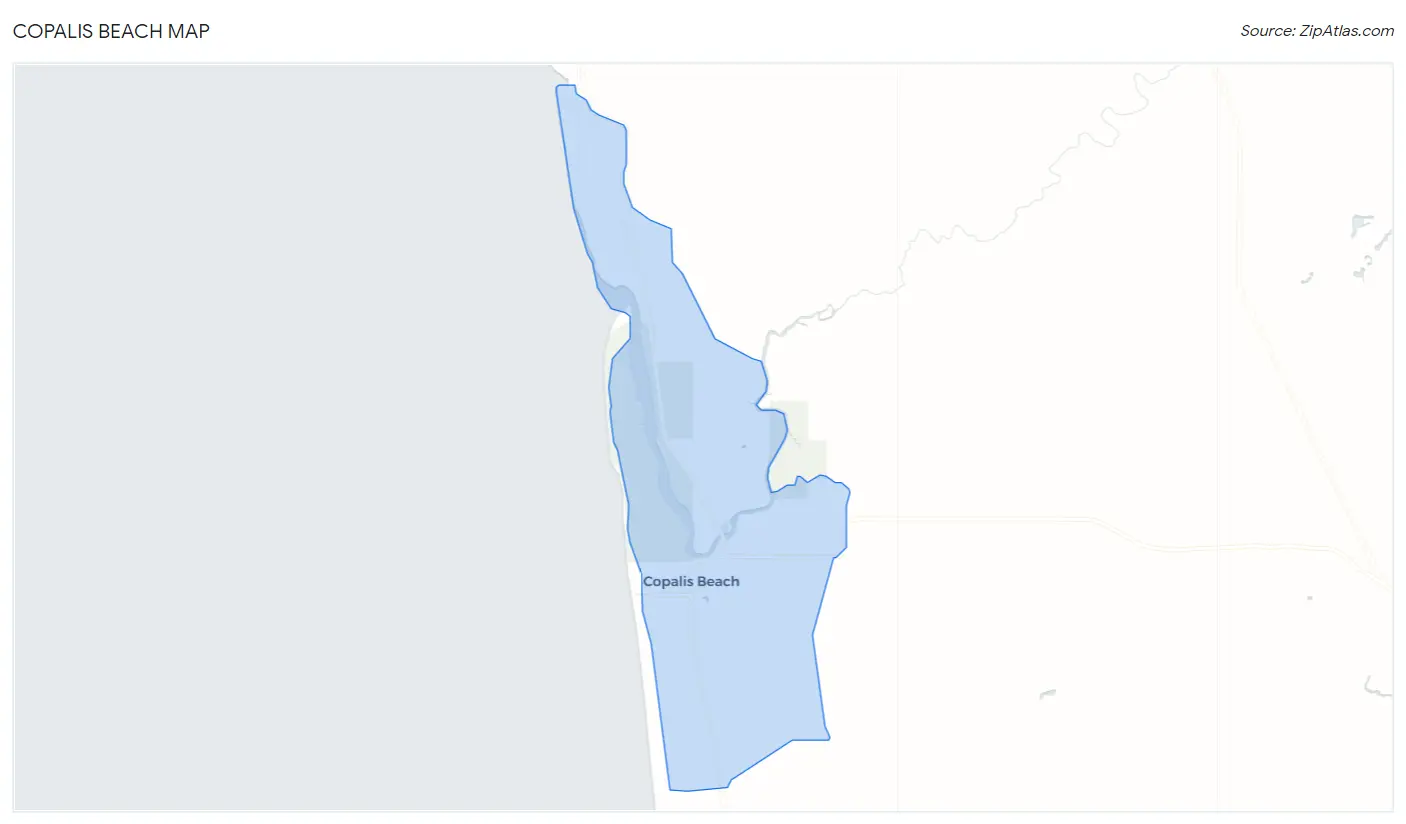
Copalis Beach Map
Copalis Beach Overview
$34,238
PER CAPITA INCOME
$60,320
AVG FAMILY INCOME
$55,406
AVG HOUSEHOLD INCOME
0.35
INEQUALITY / GINI INDEX
293
TOTAL POPULATION
148
MALE POPULATION
145
FEMALE POPULATION
102.07
MALES / 100 FEMALES
97.97
FEMALES / 100 MALES
70.0
MEDIAN AGE
2.4
AVG FAMILY SIZE
1.7
AVG HOUSEHOLD SIZE
88
LABOR FORCE [ PEOPLE ]
30.0%
PERCENT IN LABOR FORCE
Copalis Beach Zip Codes
Copalis Beach Area Codes
Income in Copalis Beach
Income Overview in Copalis Beach
Per Capita Income in Copalis Beach is $34,238, while median incomes of families and households are $60,320 and $55,406 respectively.
| Characteristic | Number | Measure |
| Per Capita Income | 293 | $34,238 |
| Median Family Income | 91 | $60,320 |
| Mean Family Income | 91 | $76,705 |
| Median Household Income | 169 | $55,406 |
| Mean Household Income | 169 | $53,753 |
| Income Deficit | 91 | $0 |
| Wage / Income Gap (%) | 293 | 0.00% |
| Wage / Income Gap ($) | 293 | 100.00¢ per $1 |
| Gini / Inequality Index | 293 | 0.35 |
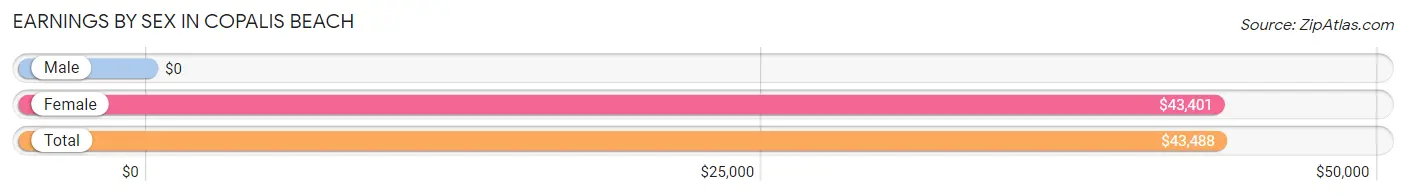
Earnings by Sex in Copalis Beach
| Sex | Number | Average Earnings |
| Male | 19 (21.6%) | $0 |
| Female | 69 (78.4%) | $43,401 |
| Total | 88 (100.0%) | $43,488 |
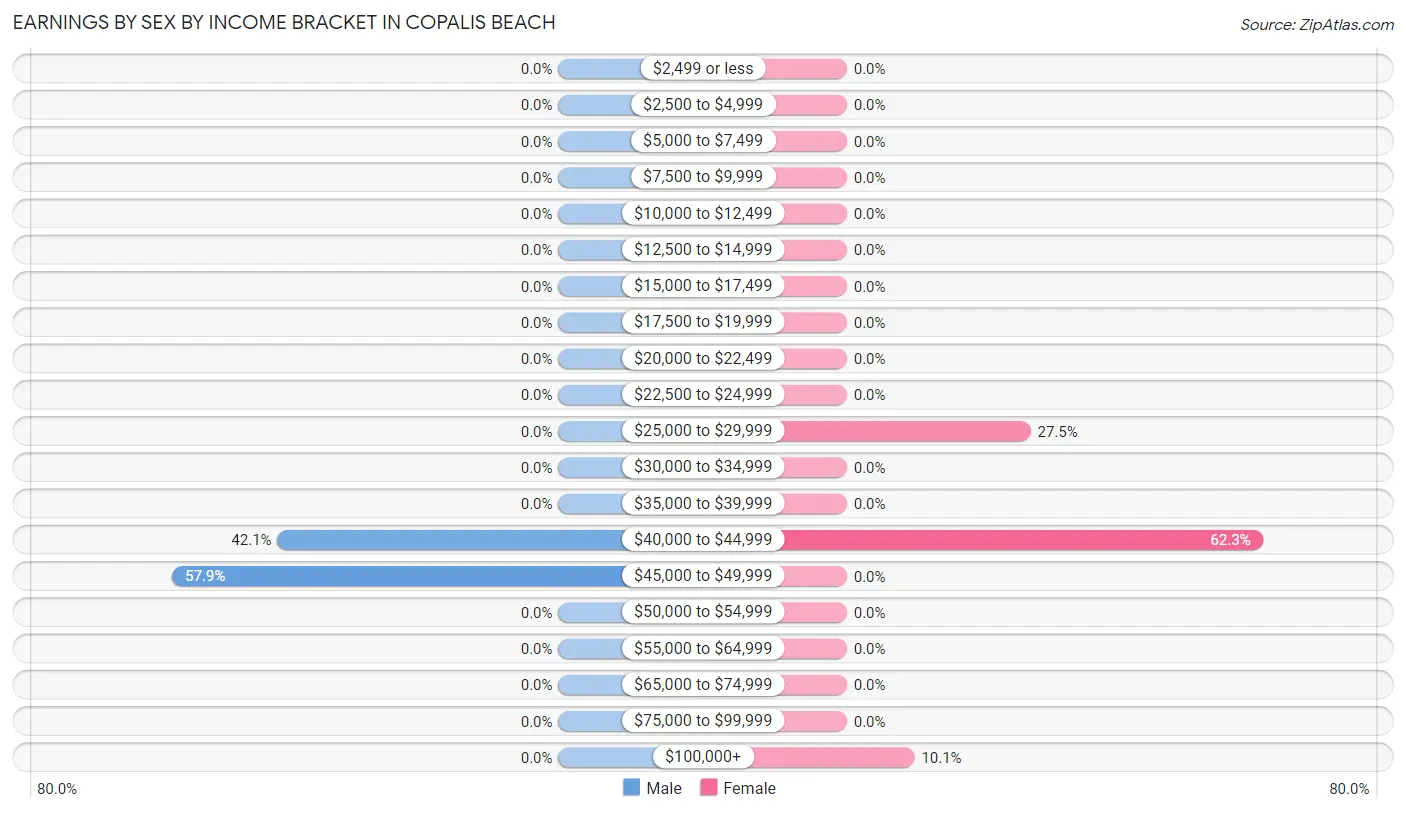
Earnings by Sex by Income Bracket in Copalis Beach
The most common earnings brackets in Copalis Beach are $45,000 to $49,999 for men (11 | 57.9%) and $40,000 to $44,999 for women (43 | 62.3%).
| Income | Male | Female |
| $2,499 or less | 0 (0.0%) | 0 (0.0%) |
| $2,500 to $4,999 | 0 (0.0%) | 0 (0.0%) |
| $5,000 to $7,499 | 0 (0.0%) | 0 (0.0%) |
| $7,500 to $9,999 | 0 (0.0%) | 0 (0.0%) |
| $10,000 to $12,499 | 0 (0.0%) | 0 (0.0%) |
| $12,500 to $14,999 | 0 (0.0%) | 0 (0.0%) |
| $15,000 to $17,499 | 0 (0.0%) | 0 (0.0%) |
| $17,500 to $19,999 | 0 (0.0%) | 0 (0.0%) |
| $20,000 to $22,499 | 0 (0.0%) | 0 (0.0%) |
| $22,500 to $24,999 | 0 (0.0%) | 0 (0.0%) |
| $25,000 to $29,999 | 0 (0.0%) | 19 (27.5%) |
| $30,000 to $34,999 | 0 (0.0%) | 0 (0.0%) |
| $35,000 to $39,999 | 0 (0.0%) | 0 (0.0%) |
| $40,000 to $44,999 | 8 (42.1%) | 43 (62.3%) |
| $45,000 to $49,999 | 11 (57.9%) | 0 (0.0%) |
| $50,000 to $54,999 | 0 (0.0%) | 0 (0.0%) |
| $55,000 to $64,999 | 0 (0.0%) | 0 (0.0%) |
| $65,000 to $74,999 | 0 (0.0%) | 0 (0.0%) |
| $75,000 to $99,999 | 0 (0.0%) | 0 (0.0%) |
| $100,000+ | 0 (0.0%) | 7 (10.1%) |
| Total | 19 (100.0%) | 69 (100.0%) |
Earnings by Sex by Educational Attainment in Copalis Beach
| Educational Attainment | Male Income | Female Income |
| Less than High School | - | - |
| High School Diploma | - | - |
| College or Associate's Degree | - | - |
| Bachelor's Degree | - | - |
| Graduate Degree | - | - |
| Total | - | - |
Family Income in Copalis Beach
Family Income Brackets in Copalis Beach
According to the Copalis Beach family income data, there are 83 families falling into the $50,000 to $74,999 income range, which is the most common income bracket and makes up 91.2% of all families.
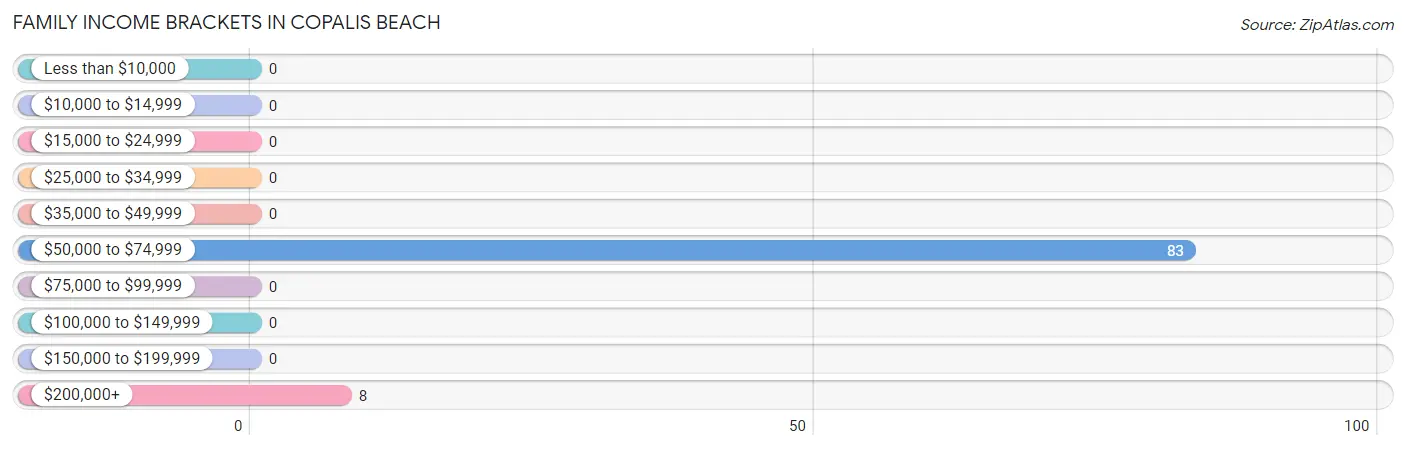
| Income Bracket | # Families | % Families |
| Less than $10,000 | 0 | 0.0% |
| $10,000 to $14,999 | 0 | 0.0% |
| $15,000 to $24,999 | 0 | 0.0% |
| $25,000 to $34,999 | 0 | 0.0% |
| $35,000 to $49,999 | 0 | 0.0% |
| $50,000 to $74,999 | 83 | 91.2% |
| $75,000 to $99,999 | 0 | 0.0% |
| $100,000 to $149,999 | 0 | 0.0% |
| $150,000 to $199,999 | 0 | 0.0% |
| $200,000+ | 8 | 8.8% |
Family Income by Famaliy Size in Copalis Beach
2-person families (83 | 91.2%) account for the highest median family income in Copalis Beach with $60,087 per family, while 2-person families (83 | 91.2%) have the highest median income of $30,044 per family member.
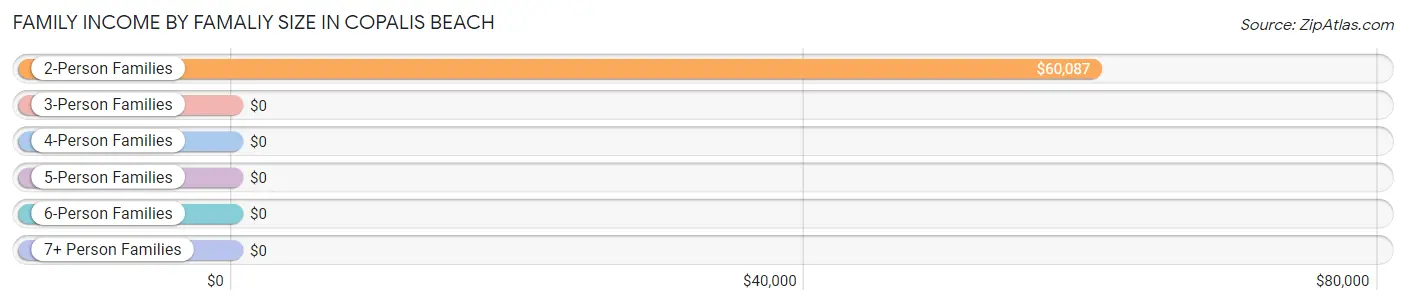
| Income Bracket | # Families | Median Income |
| 2-Person Families | 83 (91.2%) | $60,087 |
| 3-Person Families | 8 (8.8%) | $0 |
| 4-Person Families | 0 (0.0%) | $0 |
| 5-Person Families | 0 (0.0%) | $0 |
| 6-Person Families | 0 (0.0%) | $0 |
| 7+ Person Families | 0 (0.0%) | $0 |
| Total | 91 (100.0%) | $60,320 |
Family Income by Number of Earners in Copalis Beach
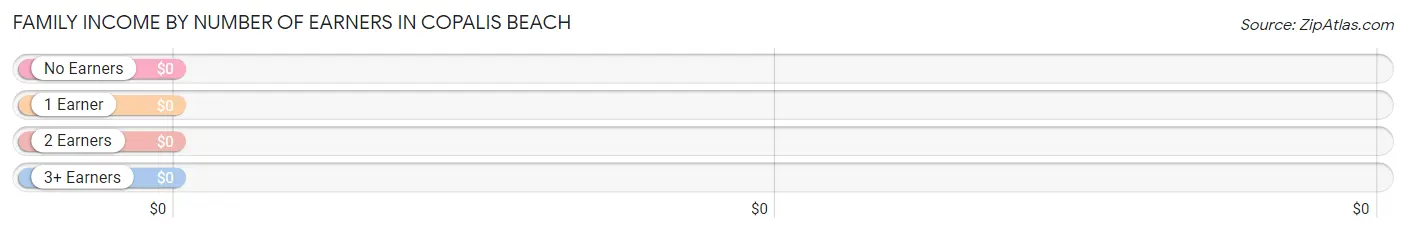
| Number of Earners | # Families | Median Income |
| No Earners | 43 (47.2%) | $0 |
| 1 Earner | 40 (44.0%) | $0 |
| 2 Earners | 0 (0.0%) | $0 |
| 3+ Earners | 8 (8.8%) | $0 |
| Total | 91 (100.0%) | $60,320 |
Household Income in Copalis Beach
Household Income Brackets in Copalis Beach
With 83 households falling in the category, the $50,000 to $74,999 income range is the most frequent in Copalis Beach, accounting for 49.1% of all households.
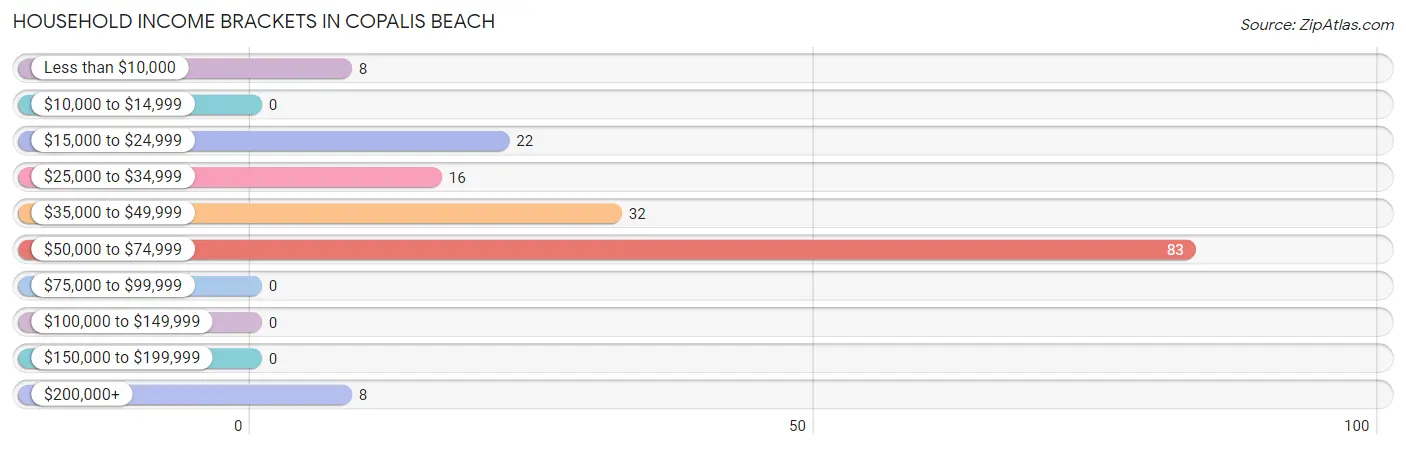
| Income Bracket | # Households | % Households |
| Less than $10,000 | 8 | 4.7% |
| $10,000 to $14,999 | 0 | 0.0% |
| $15,000 to $24,999 | 22 | 13.0% |
| $25,000 to $34,999 | 16 | 9.5% |
| $35,000 to $49,999 | 32 | 18.9% |
| $50,000 to $74,999 | 83 | 49.1% |
| $75,000 to $99,999 | 0 | 0.0% |
| $100,000 to $149,999 | 0 | 0.0% |
| $150,000 to $199,999 | 0 | 0.0% |
| $200,000+ | 8 | 4.7% |
Household Income by Householder Age in Copalis Beach
The median household income in Copalis Beach is $55,406, with the highest median household income of $55,750 found in the 45 to 64 years age bracket for the primary householder. A total of 44 households (26.0%) fall into this category.
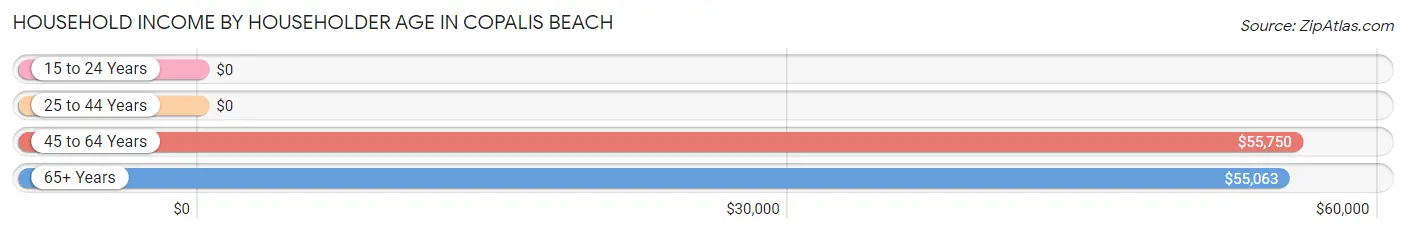
| Income Bracket | # Households | Median Income |
| 15 to 24 Years | 0 (0.0%) | $0 |
| 25 to 44 Years | 0 (0.0%) | $0 |
| 45 to 64 Years | 44 (26.0%) | $55,750 |
| 65+ Years | 125 (74.0%) | $55,063 |
| Total | 169 (100.0%) | $55,406 |
Poverty in Copalis Beach
Income Below Poverty by Sex and Age in Copalis Beach
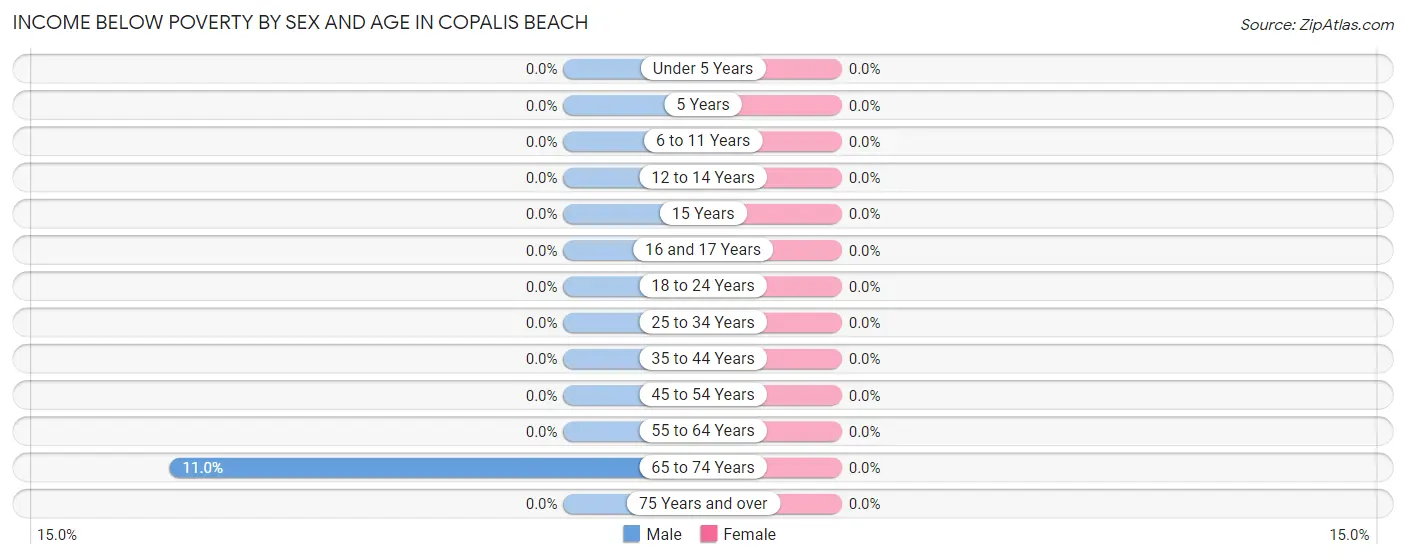
| Age Bracket | Male | Female |
| Under 5 Years | 0 (0.0%) | 0 (0.0%) |
| 5 Years | 0 (0.0%) | 0 (0.0%) |
| 6 to 11 Years | 0 (0.0%) | 0 (0.0%) |
| 12 to 14 Years | 0 (0.0%) | 0 (0.0%) |
| 15 Years | 0 (0.0%) | 0 (0.0%) |
| 16 and 17 Years | 0 (0.0%) | 0 (0.0%) |
| 18 to 24 Years | 0 (0.0%) | 0 (0.0%) |
| 25 to 34 Years | 0 (0.0%) | 0 (0.0%) |
| 35 to 44 Years | 0 (0.0%) | 0 (0.0%) |
| 45 to 54 Years | 0 (0.0%) | 0 (0.0%) |
| 55 to 64 Years | 0 (0.0%) | 0 (0.0%) |
| 65 to 74 Years | 8 (11.0%) | 0 (0.0%) |
| 75 Years and over | 0 (0.0%) | 0 (0.0%) |
| Total | 8 (5.4%) | 0 (0.0%) |
Income Above Poverty by Sex and Age in Copalis Beach
According to the poverty statistics in Copalis Beach, males aged 35 to 44 years and females aged 25 to 34 years are the age groups that are most secure financially, with 100.0% of males and 100.0% of females in these age groups living above the poverty line.
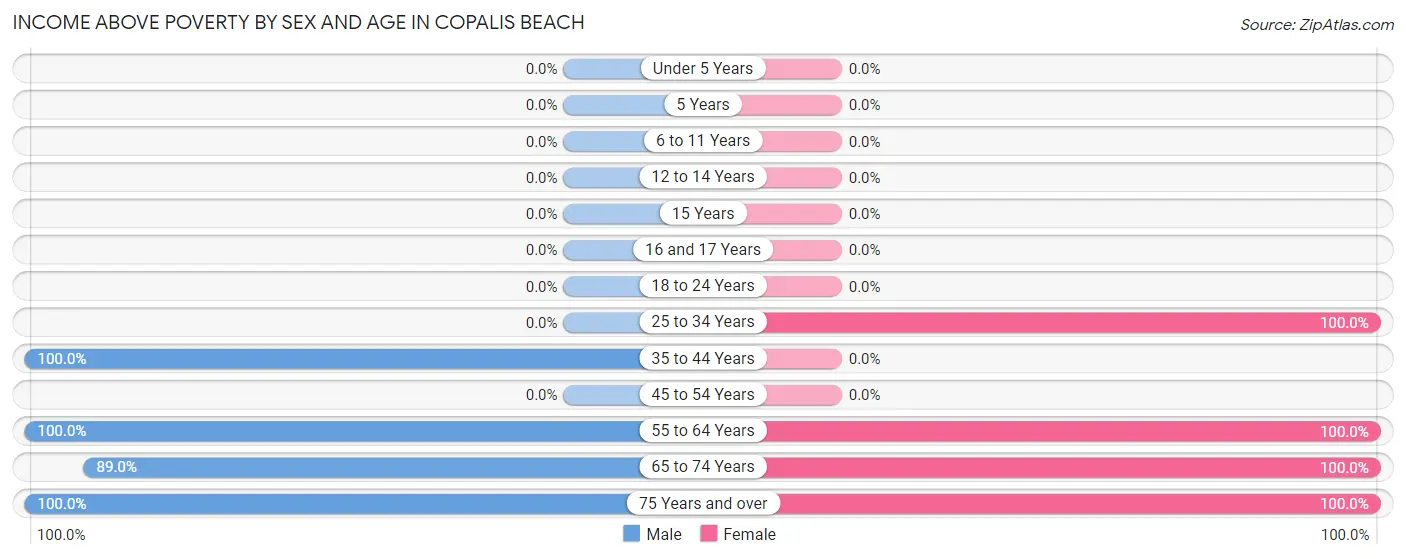
| Age Bracket | Male | Female |
| Under 5 Years | 0 (0.0%) | 0 (0.0%) |
| 5 Years | 0 (0.0%) | 0 (0.0%) |
| 6 to 11 Years | 0 (0.0%) | 0 (0.0%) |
| 12 to 14 Years | 0 (0.0%) | 0 (0.0%) |
| 15 Years | 0 (0.0%) | 0 (0.0%) |
| 16 and 17 Years | 0 (0.0%) | 0 (0.0%) |
| 18 to 24 Years | 0 (0.0%) | 0 (0.0%) |
| 25 to 34 Years | 0 (0.0%) | 43 (100.0%) |
| 35 to 44 Years | 11 (100.0%) | 0 (0.0%) |
| 45 to 54 Years | 0 (0.0%) | 0 (0.0%) |
| 55 to 64 Years | 44 (100.0%) | 7 (100.0%) |
| 65 to 74 Years | 65 (89.0%) | 63 (100.0%) |
| 75 Years and over | 20 (100.0%) | 32 (100.0%) |
| Total | 140 (94.6%) | 145 (100.0%) |
Income Below Poverty Among Married-Couple Families in Copalis Beach
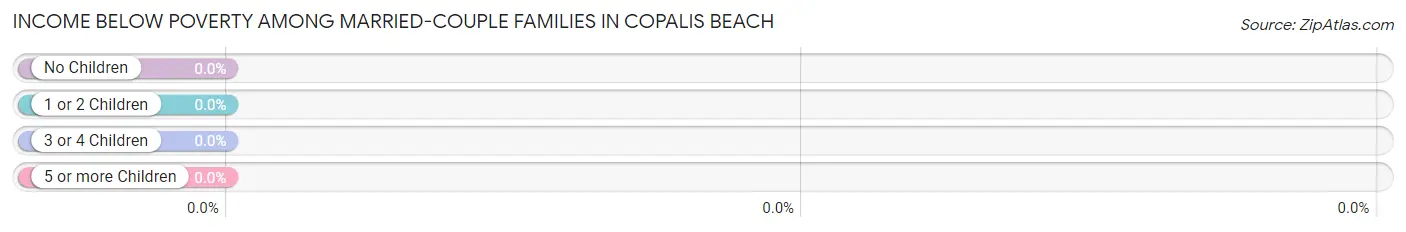
| Children | Above Poverty | Below Poverty |
| No Children | 71 (100.0%) | 0 (0.0%) |
| 1 or 2 Children | 0 (0.0%) | 0 (0.0%) |
| 3 or 4 Children | 0 (0.0%) | 0 (0.0%) |
| 5 or more Children | 0 (0.0%) | 0 (0.0%) |
| Total | 71 (100.0%) | 0 (0.0%) |
Income Below Poverty Among Single-Parent Households in Copalis Beach
| Children | Single Father | Single Mother |
| No Children | 0 (0.0%) | 0 (0.0%) |
| 1 or 2 Children | 0 (0.0%) | 0 (0.0%) |
| 3 or 4 Children | 0 (0.0%) | 0 (0.0%) |
| 5 or more Children | 0 (0.0%) | 0 (0.0%) |
| Total | 0 (0.0%) | 0 (0.0%) |
Income Below Poverty Among Married-Couple vs Single-Parent Households in Copalis Beach
| Children | Married-Couple Families | Single-Parent Households |
| No Children | 0 (0.0%) | 0 (0.0%) |
| 1 or 2 Children | 0 (0.0%) | 0 (0.0%) |
| 3 or 4 Children | 0 (0.0%) | 0 (0.0%) |
| 5 or more Children | 0 (0.0%) | 0 (0.0%) |
| Total | 0 (0.0%) | 0 (0.0%) |
Race in Copalis Beach
The most populous races in Copalis Beach are White / Caucasian (261 | 89.1%), Hispanic or Latino (43 | 14.7%), and Two or more Races (32 | 10.9%).
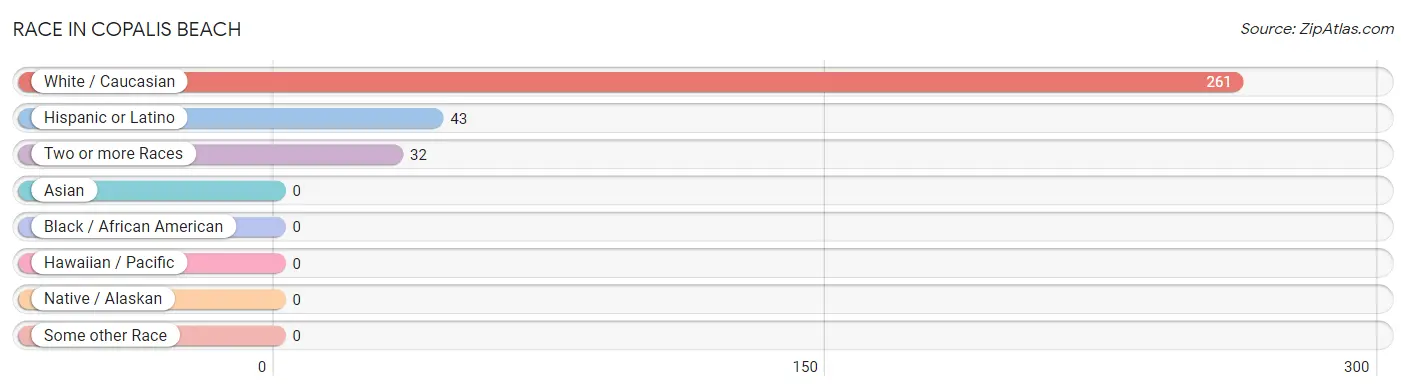
| Race | # Population | % Population |
| Asian | 0 | 0.0% |
| Black / African American | 0 | 0.0% |
| Hawaiian / Pacific | 0 | 0.0% |
| Hispanic or Latino | 43 | 14.7% |
| Native / Alaskan | 0 | 0.0% |
| White / Caucasian | 261 | 89.1% |
| Two or more Races | 32 | 10.9% |
| Some other Race | 0 | 0.0% |
| Total | 293 | 100.0% |
Ancestry in Copalis Beach
The most populous ancestries reported in Copalis Beach are German (79 | 27.0%), American (59 | 20.1%), English (50 | 17.1%), Mexican (43 | 14.7%), and Swedish (22 | 7.5%), together accounting for 86.3% of all Copalis Beach residents.
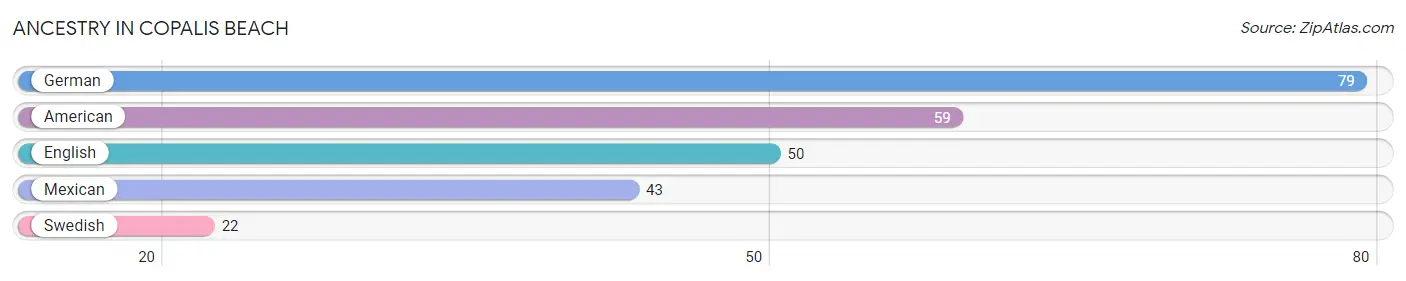
| Ancestry | # Population | % Population |
| American | 59 | 20.1% |
| English | 50 | 17.1% |
| German | 79 | 27.0% |
| Mexican | 43 | 14.7% |
| Swedish | 22 | 7.5% | View All 5 Rows |
Immigrants in Copalis Beach

| Immigration Origin | # Population | % Population | View All 0 Rows |
Sex and Age in Copalis Beach
Sex and Age in Copalis Beach
The most populous age groups in Copalis Beach are 70 to 74 Years (51 | 34.5%) for men and 70 to 74 Years (44 | 30.3%) for women.
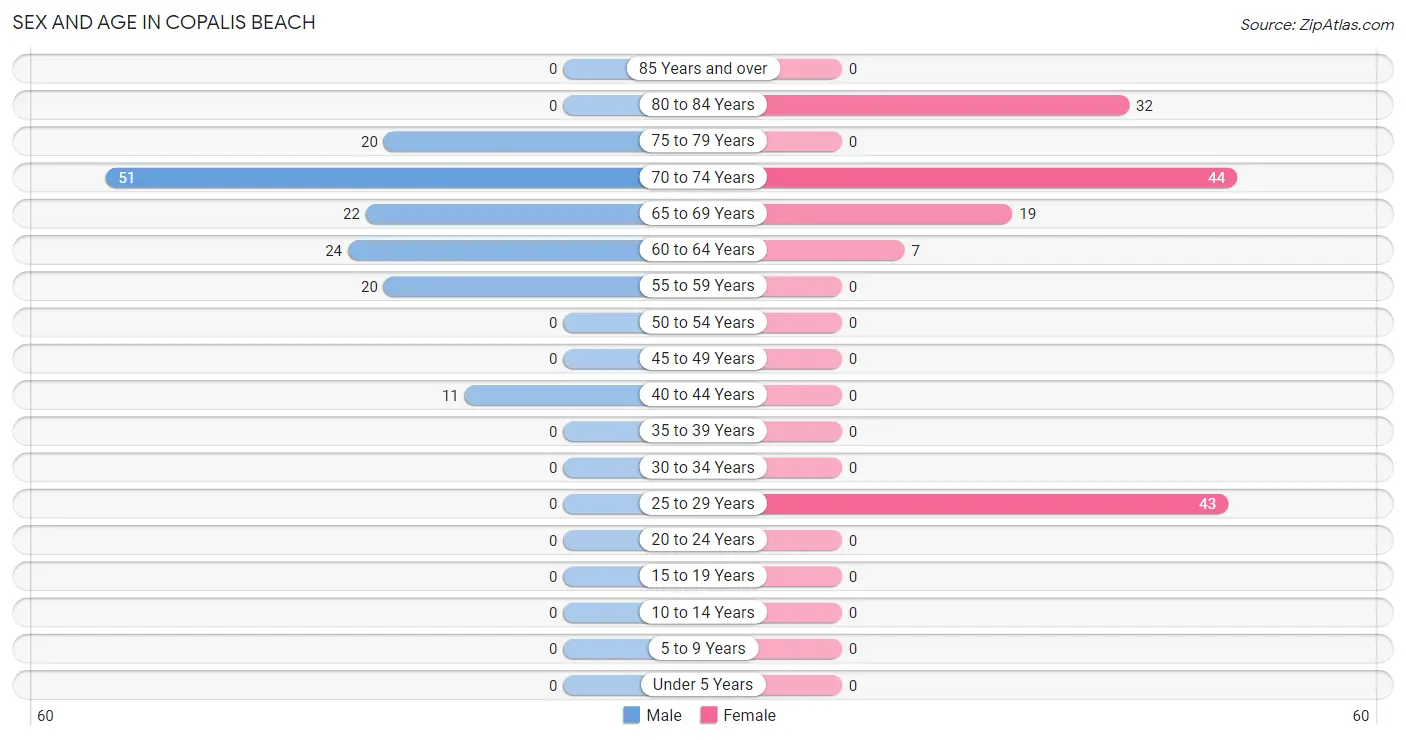
| Age Bracket | Male | Female |
| Under 5 Years | 0 (0.0%) | 0 (0.0%) |
| 5 to 9 Years | 0 (0.0%) | 0 (0.0%) |
| 10 to 14 Years | 0 (0.0%) | 0 (0.0%) |
| 15 to 19 Years | 0 (0.0%) | 0 (0.0%) |
| 20 to 24 Years | 0 (0.0%) | 0 (0.0%) |
| 25 to 29 Years | 0 (0.0%) | 43 (29.7%) |
| 30 to 34 Years | 0 (0.0%) | 0 (0.0%) |
| 35 to 39 Years | 0 (0.0%) | 0 (0.0%) |
| 40 to 44 Years | 11 (7.4%) | 0 (0.0%) |
| 45 to 49 Years | 0 (0.0%) | 0 (0.0%) |
| 50 to 54 Years | 0 (0.0%) | 0 (0.0%) |
| 55 to 59 Years | 20 (13.5%) | 0 (0.0%) |
| 60 to 64 Years | 24 (16.2%) | 7 (4.8%) |
| 65 to 69 Years | 22 (14.9%) | 19 (13.1%) |
| 70 to 74 Years | 51 (34.5%) | 44 (30.3%) |
| 75 to 79 Years | 20 (13.5%) | 0 (0.0%) |
| 80 to 84 Years | 0 (0.0%) | 32 (22.1%) |
| 85 Years and over | 0 (0.0%) | 0 (0.0%) |
| Total | 148 (100.0%) | 145 (100.0%) |
Families and Households in Copalis Beach
Median Family Size in Copalis Beach
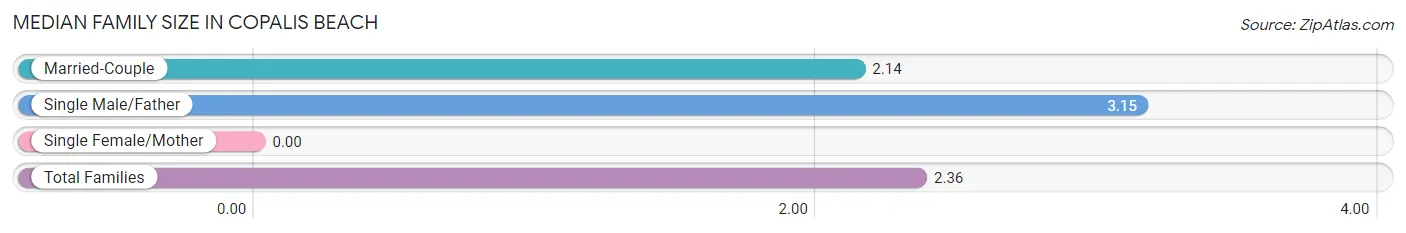
| Family Type | # Families | Family Size |
| Married-Couple | 71 (78.0%) | 2.14 |
| Single Male/Father | 20 (22.0%) | 3.15 |
| Single Female/Mother | 0 (0.0%) | - |
| Total Families | 91 (100.0%) | 2.36 |
Median Household Size in Copalis Beach
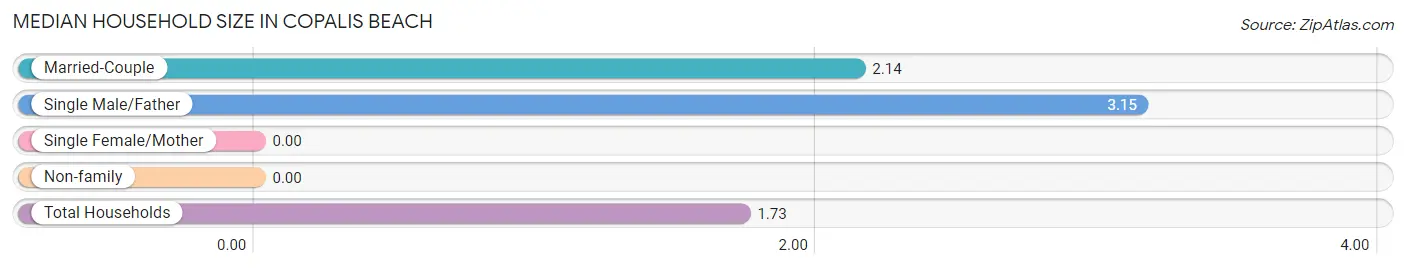
| Household Type | # Households | Household Size |
| Married-Couple | 71 (42.0%) | 2.14 |
| Single Male/Father | 20 (11.8%) | 3.15 |
| Single Female/Mother | 0 (0.0%) | - |
| Non-family | 78 (46.2%) | - |
| Total Households | 169 (100.0%) | 1.73 |
Household Size by Marriage Status in Copalis Beach
Out of a total of 169 households in Copalis Beach, 91 (53.8%) are family households, while 78 (46.2%) are nonfamily households. The most numerous type of family households are 2-person households, comprising 83, and the most common type of nonfamily households are 1-person households, comprising 78.
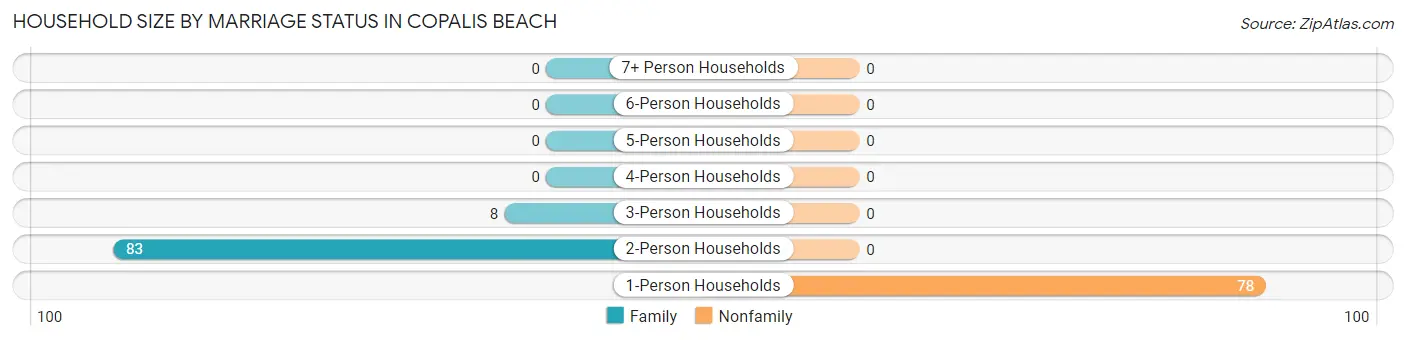
| Household Size | Family Households | Nonfamily Households |
| 1-Person Households | - | 78 (46.2%) |
| 2-Person Households | 83 (49.1%) | 0 (0.0%) |
| 3-Person Households | 8 (4.7%) | 0 (0.0%) |
| 4-Person Households | 0 (0.0%) | 0 (0.0%) |
| 5-Person Households | 0 (0.0%) | 0 (0.0%) |
| 6-Person Households | 0 (0.0%) | 0 (0.0%) |
| 7+ Person Households | 0 (0.0%) | 0 (0.0%) |
| Total | 91 (53.8%) | 78 (46.2%) |
Female Fertility in Copalis Beach
Fertility by Age in Copalis Beach
| Age Bracket | Women with Births | Births / 1,000 Women |
| 15 to 19 years | 0 (0.0%) | 0.0 |
| 20 to 34 years | 0 (0.0%) | 0.0 |
| 35 to 50 years | 0 (0.0%) | 0.0 |
| Total | 0 (0.0%) | 0.0 |
Fertility by Age by Marriage Status in Copalis Beach
| Age Bracket | Married | Unmarried |
| 15 to 19 years | 0 (0.0%) | 0 (0.0%) |
| 20 to 34 years | 0 (0.0%) | 0 (0.0%) |
| 35 to 50 years | 0 (0.0%) | 0 (0.0%) |
| Total | 0 (0.0%) | 0 (0.0%) |
Fertility by Education in Copalis Beach
| Educational Attainment | Women with Births | Births / 1,000 Women |
| Less than High School | 0 (0.0%) | 0.0 |
| High School Diploma | 0 (0.0%) | 0.0 |
| College or Associate's Degree | 0 (0.0%) | 0.0 |
| Bachelor's Degree | 0 (0.0%) | 0.0 |
| Graduate Degree | 0 (0.0%) | 0.0 |
| Total | 0 (0.0%) | 0.0 |
Fertility by Education by Marriage Status in Copalis Beach
| Educational Attainment | Married | Unmarried |
| Less than High School | 0 (0.0%) | 0 (0.0%) |
| High School Diploma | 0 (0.0%) | 0 (0.0%) |
| College or Associate's Degree | 0 (0.0%) | 0 (0.0%) |
| Bachelor's Degree | 0 (0.0%) | 0 (0.0%) |
| Graduate Degree | 0 (0.0%) | 0 (0.0%) |
| Total | 0 (0.0%) | 0 (0.0%) |
Employment Characteristics in Copalis Beach
Employment by Class of Employer in Copalis Beach
Among the 88 employed individuals in Copalis Beach, federal government employees (43 | 48.9%), private company employees (37 | 42.0%), and self-employed (incorporated) (8 | 9.1%) make up the most common classes of employment.
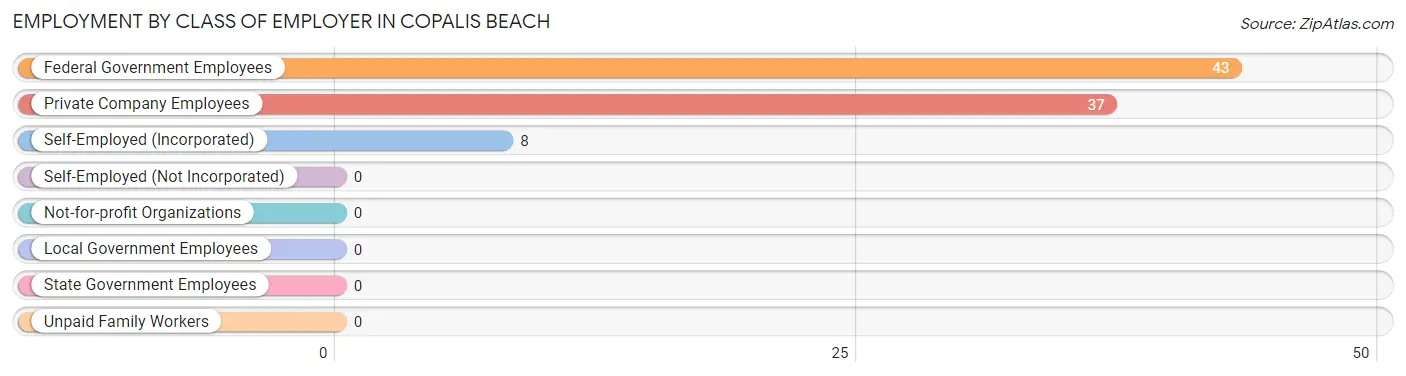
| Employer Class | # Employees | % Employees |
| Private Company Employees | 37 | 42.0% |
| Self-Employed (Incorporated) | 8 | 9.1% |
| Self-Employed (Not Incorporated) | 0 | 0.0% |
| Not-for-profit Organizations | 0 | 0.0% |
| Local Government Employees | 0 | 0.0% |
| State Government Employees | 0 | 0.0% |
| Federal Government Employees | 43 | 48.9% |
| Unpaid Family Workers | 0 | 0.0% |
| Total | 88 | 100.0% |
Employment Status by Age in Copalis Beach
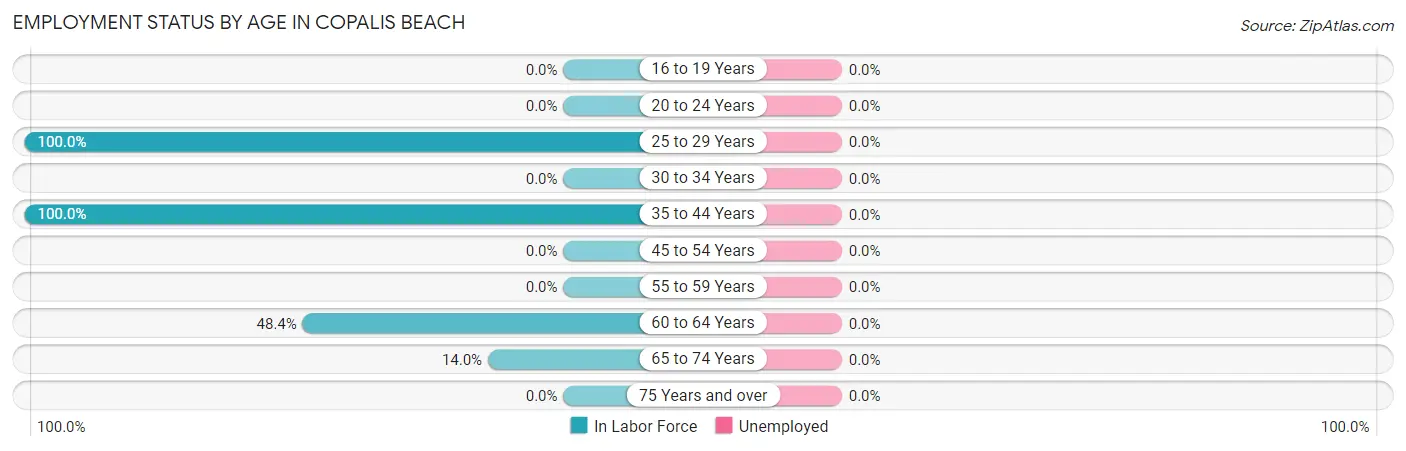
| Age Bracket | In Labor Force | Unemployed |
| 16 to 19 Years | 0 (0.0%) | 0 (0.0%) |
| 20 to 24 Years | 0 (0.0%) | 0 (0.0%) |
| 25 to 29 Years | 43 (100.0%) | 0 (0.0%) |
| 30 to 34 Years | 0 (0.0%) | 0 (0.0%) |
| 35 to 44 Years | 11 (100.0%) | 0 (0.0%) |
| 45 to 54 Years | 0 (0.0%) | 0 (0.0%) |
| 55 to 59 Years | 0 (0.0%) | 0 (0.0%) |
| 60 to 64 Years | 15 (48.4%) | 0 (0.0%) |
| 65 to 74 Years | 19 (14.0%) | 0 (0.0%) |
| 75 Years and over | 0 (0.0%) | 0 (0.0%) |
| Total | 88 (30.0%) | 0 (0.0%) |
Employment Status by Educational Attainment in Copalis Beach
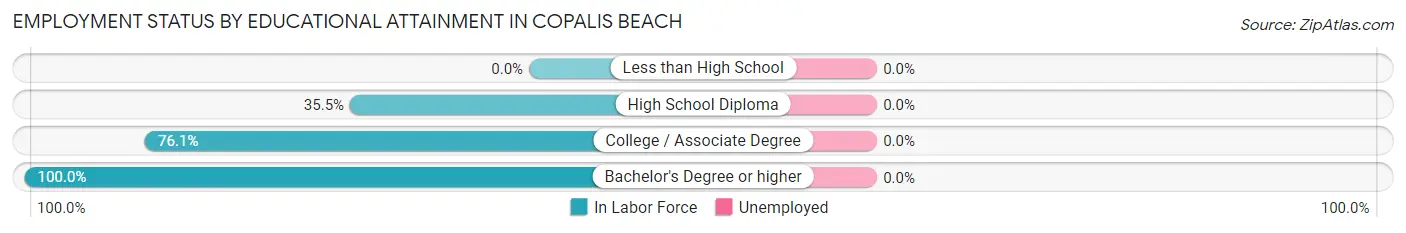
| Educational Attainment | In Labor Force | Unemployed |
| Less than High School | 0 (0.0%) | 0 (0.0%) |
| High School Diploma | 11 (35.5%) | 0 (0.0%) |
| College / Associate Degree | 51 (76.1%) | 0 (0.0%) |
| Bachelor's Degree or higher | 7 (100.0%) | 0 (0.0%) |
| Total | 69 (65.7%) | 0 (0.0%) |
Employment Occupations by Sex in Copalis Beach
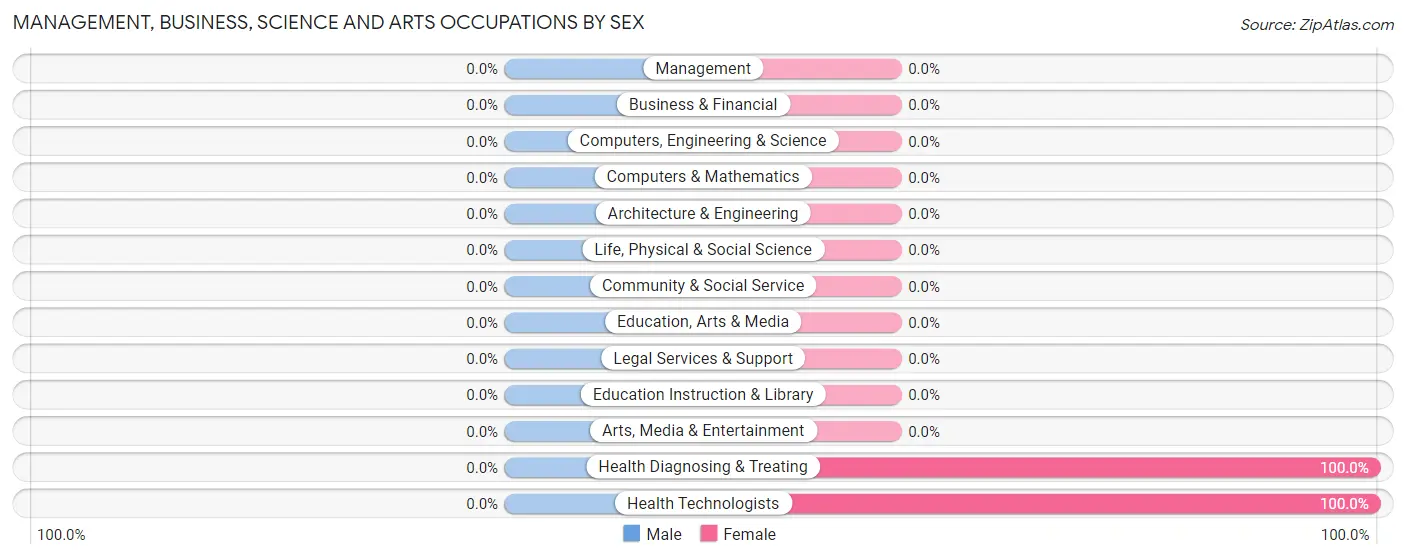
Management, Business, Science and Arts Occupations
The most common Management, Business, Science and Arts occupations in Copalis Beach are Health Diagnosing & Treating (7 | 8.0%), and Health Technologists (7 | 8.0%).
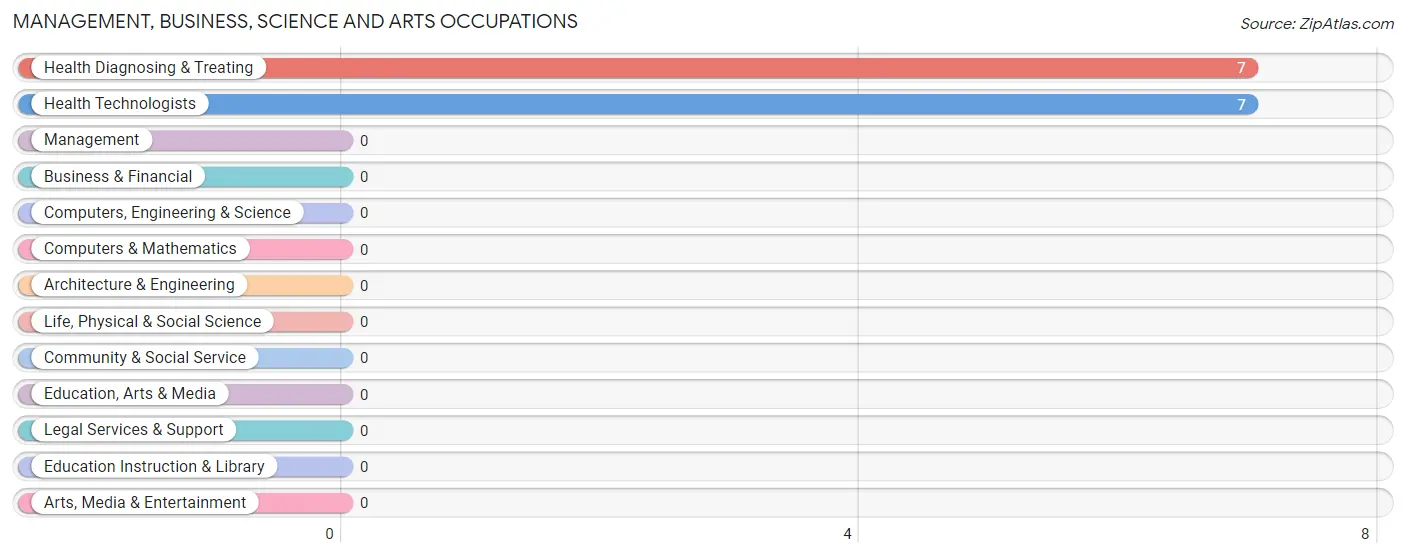
Management, Business, Science and Arts Occupations by Sex
| Occupation | Male | Female |
| Management | 0 (0.0%) | 0 (0.0%) |
| Business & Financial | 0 (0.0%) | 0 (0.0%) |
| Computers, Engineering & Science | 0 (0.0%) | 0 (0.0%) |
| Computers & Mathematics | 0 (0.0%) | 0 (0.0%) |
| Architecture & Engineering | 0 (0.0%) | 0 (0.0%) |
| Life, Physical & Social Science | 0 (0.0%) | 0 (0.0%) |
| Community & Social Service | 0 (0.0%) | 0 (0.0%) |
| Education, Arts & Media | 0 (0.0%) | 0 (0.0%) |
| Legal Services & Support | 0 (0.0%) | 0 (0.0%) |
| Education Instruction & Library | 0 (0.0%) | 0 (0.0%) |
| Arts, Media & Entertainment | 0 (0.0%) | 0 (0.0%) |
| Health Diagnosing & Treating | 0 (0.0%) | 7 (100.0%) |
| Health Technologists | 0 (0.0%) | 7 (100.0%) |
| Total (Category) | 0 (0.0%) | 7 (100.0%) |
| Total (Overall) | 19 (21.6%) | 69 (78.4%) |
Services Occupations
Services Occupations by Sex
| Occupation | Male | Female |
| Healthcare Support | 0 (0.0%) | 0 (0.0%) |
| Security & Protection | 0 (0.0%) | 0 (0.0%) |
| Firefighting & Prevention | 0 (0.0%) | 0 (0.0%) |
| Law Enforcement | 0 (0.0%) | 0 (0.0%) |
| Food Preparation & Serving | 0 (0.0%) | 0 (0.0%) |
| Cleaning & Maintenance | 0 (0.0%) | 0 (0.0%) |
| Personal Care & Service | 0 (0.0%) | 0 (0.0%) |
| Total (Category) | 0 (0.0%) | 0 (0.0%) |
| Total (Overall) | 19 (21.6%) | 69 (78.4%) |
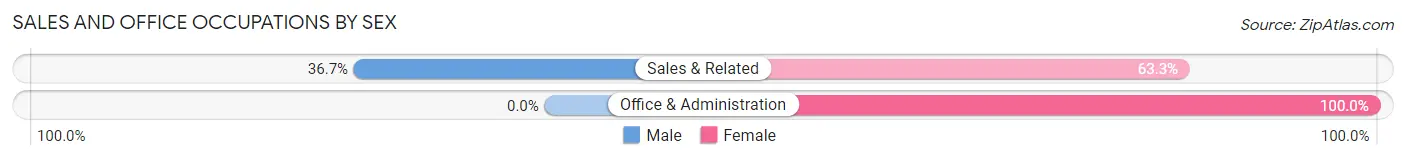
Sales and Office Occupations
The most common Sales and Office occupations in Copalis Beach are Office & Administration (43 | 48.9%), and Sales & Related (30 | 34.1%).
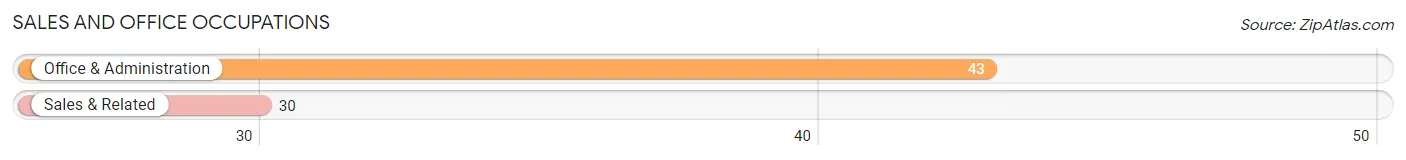
Sales and Office Occupations by Sex
| Occupation | Male | Female |
| Sales & Related | 11 (36.7%) | 19 (63.3%) |
| Office & Administration | 0 (0.0%) | 43 (100.0%) |
| Total (Category) | 11 (15.1%) | 62 (84.9%) |
| Total (Overall) | 19 (21.6%) | 69 (78.4%) |
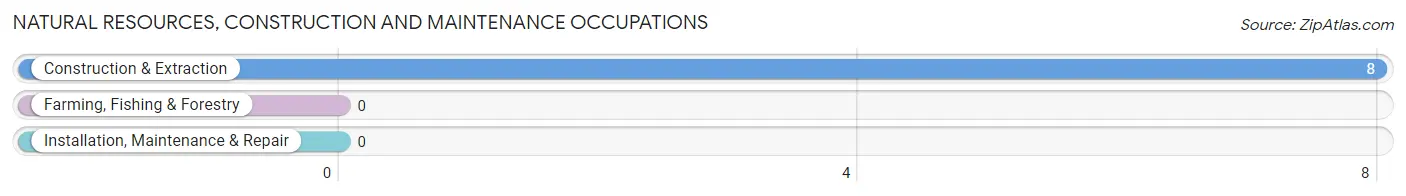
Natural Resources, Construction and Maintenance Occupations
The most common Natural Resources, Construction and Maintenance occupations in Copalis Beach are , and Construction & Extraction (8 | 9.1%).
Natural Resources, Construction and Maintenance Occupations by Sex
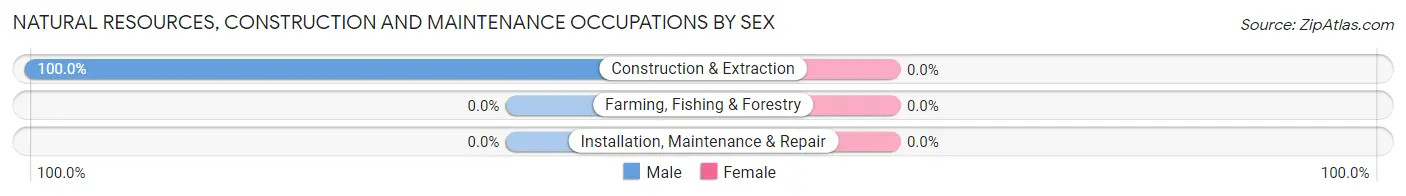
| Occupation | Male | Female |
| Farming, Fishing & Forestry | 0 (0.0%) | 0 (0.0%) |
| Construction & Extraction | 8 (100.0%) | 0 (0.0%) |
| Installation, Maintenance & Repair | 0 (0.0%) | 0 (0.0%) |
| Total (Category) | 8 (100.0%) | 0 (0.0%) |
| Total (Overall) | 19 (21.6%) | 69 (78.4%) |
Production, Transportation and Moving Occupations
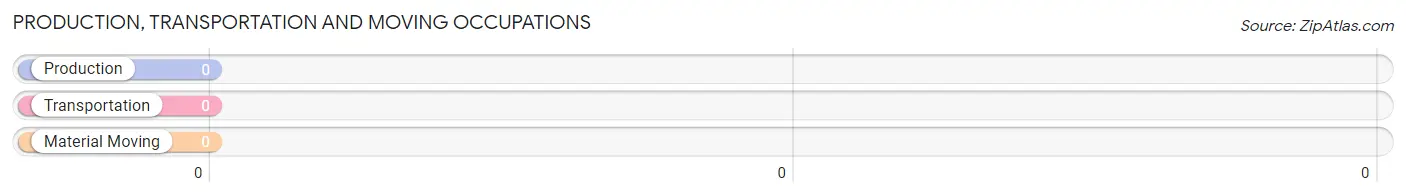
Production, Transportation and Moving Occupations by Sex
| Occupation | Male | Female |
| Production | 0 (0.0%) | 0 (0.0%) |
| Transportation | 0 (0.0%) | 0 (0.0%) |
| Material Moving | 0 (0.0%) | 0 (0.0%) |
| Total (Category) | 0 (0.0%) | 0 (0.0%) |
| Total (Overall) | 19 (21.6%) | 69 (78.4%) |
Employment Industries by Sex in Copalis Beach
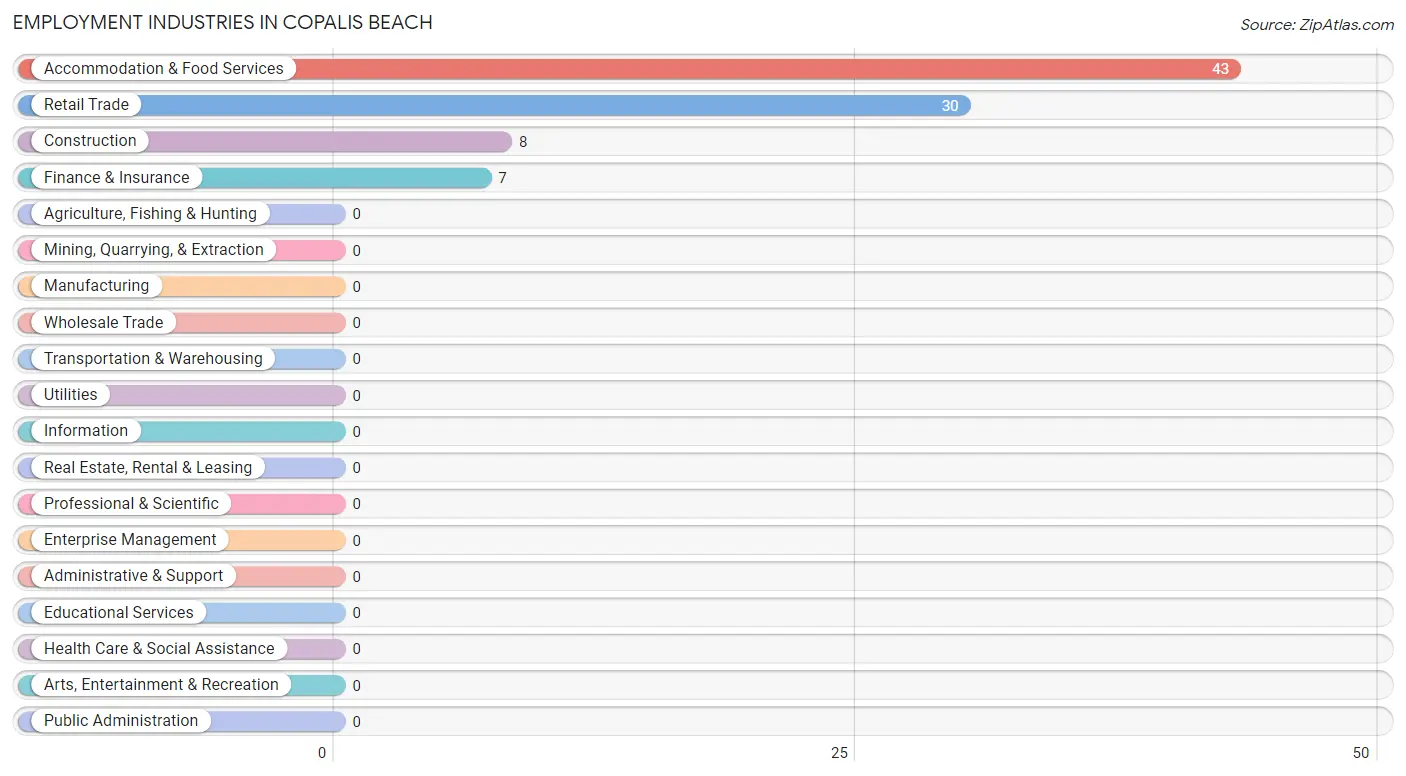
Employment Industries in Copalis Beach
The major employment industries in Copalis Beach include Accommodation & Food Services (43 | 48.9%), Retail Trade (30 | 34.1%), Construction (8 | 9.1%), and Finance & Insurance (7 | 8.0%).
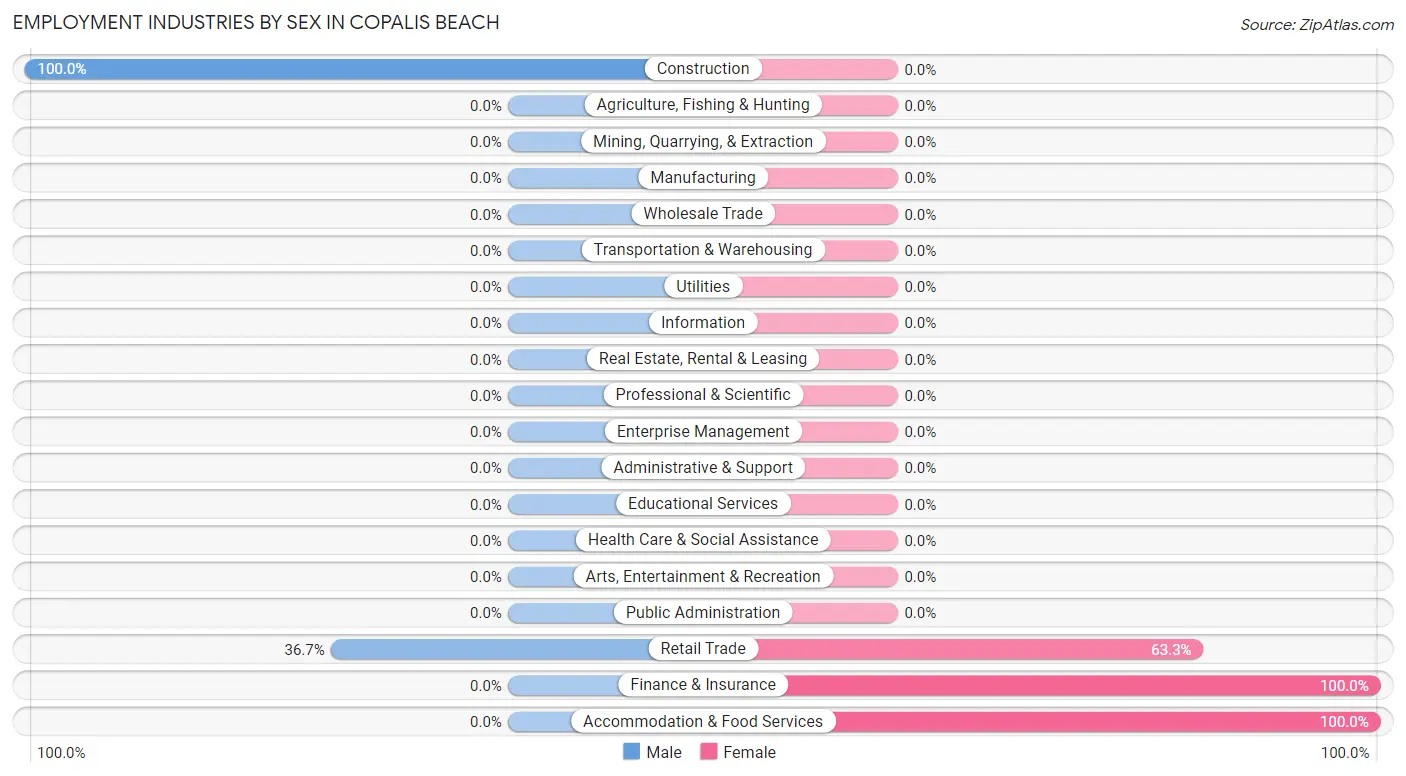
Employment Industries by Sex in Copalis Beach
The Copalis Beach industries that see more men than women are Construction (100.0%), and Retail Trade (36.7%), whereas the industries that tend to have a higher number of women are Finance & Insurance (100.0%), Accommodation & Food Services (100.0%), and Retail Trade (63.3%).
| Industry | Male | Female |
| Agriculture, Fishing & Hunting | 0 (0.0%) | 0 (0.0%) |
| Mining, Quarrying, & Extraction | 0 (0.0%) | 0 (0.0%) |
| Construction | 8 (100.0%) | 0 (0.0%) |
| Manufacturing | 0 (0.0%) | 0 (0.0%) |
| Wholesale Trade | 0 (0.0%) | 0 (0.0%) |
| Retail Trade | 11 (36.7%) | 19 (63.3%) |
| Transportation & Warehousing | 0 (0.0%) | 0 (0.0%) |
| Utilities | 0 (0.0%) | 0 (0.0%) |
| Information | 0 (0.0%) | 0 (0.0%) |
| Finance & Insurance | 0 (0.0%) | 7 (100.0%) |
| Real Estate, Rental & Leasing | 0 (0.0%) | 0 (0.0%) |
| Professional & Scientific | 0 (0.0%) | 0 (0.0%) |
| Enterprise Management | 0 (0.0%) | 0 (0.0%) |
| Administrative & Support | 0 (0.0%) | 0 (0.0%) |
| Educational Services | 0 (0.0%) | 0 (0.0%) |
| Health Care & Social Assistance | 0 (0.0%) | 0 (0.0%) |
| Arts, Entertainment & Recreation | 0 (0.0%) | 0 (0.0%) |
| Accommodation & Food Services | 0 (0.0%) | 43 (100.0%) |
| Public Administration | 0 (0.0%) | 0 (0.0%) |
| Total | 19 (21.6%) | 69 (78.4%) |
Education in Copalis Beach
School Enrollment in Copalis Beach
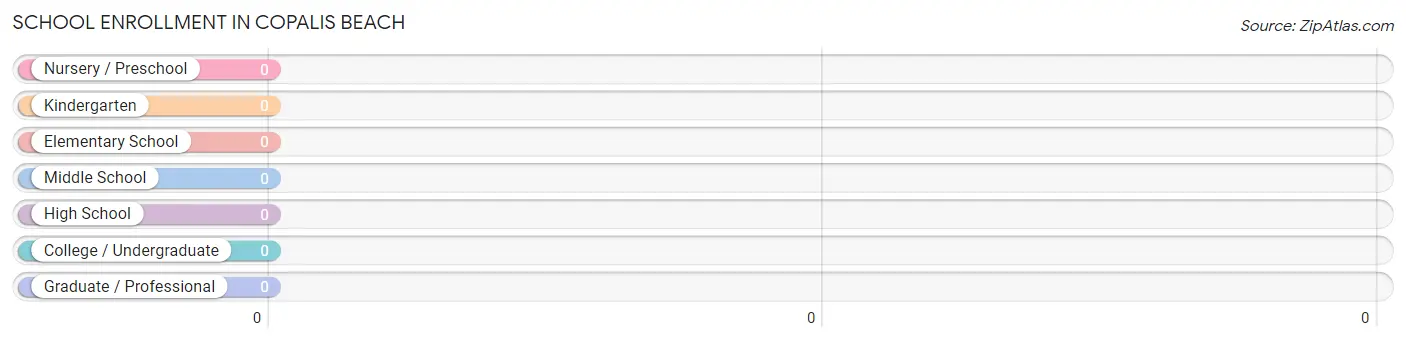
| School Level | # Students | % Students |
| Nursery / Preschool | 0 | 0.0% |
| Kindergarten | 0 | 0.0% |
| Elementary School | 0 | 0.0% |
| Middle School | 0 | 0.0% |
| High School | 0 | 0.0% |
| College / Undergraduate | 0 | 0.0% |
| Graduate / Professional | 0 | 0.0% |
| Total | 0 | 0.0% |
School Enrollment by Age by Funding Source in Copalis Beach
| Age Bracket | Public School | Private School |
| 3 to 4 Year Olds | 0 (0.0%) | 0 (0.0%) |
| 5 to 9 Year Old | 0 (0.0%) | 0 (0.0%) |
| 10 to 14 Year Olds | 0 (0.0%) | 0 (0.0%) |
| 15 to 17 Year Olds | 0 (0.0%) | 0 (0.0%) |
| 18 to 19 Year Olds | 0 (0.0%) | 0 (0.0%) |
| 20 to 24 Year Olds | 0 (0.0%) | 0 (0.0%) |
| 25 to 34 Year Olds | 0 (0.0%) | 0 (0.0%) |
| 35 Years and over | 0 (0.0%) | 0 (0.0%) |
| Total | 0 (0.0%) | 0 (0.0%) |
Educational Attainment by Field of Study in Copalis Beach
Computers & mathematics (43 | 52.4%), education (32 | 39.0%), and science & technology (7 | 8.5%) are the most common fields of study among 82 individuals in Copalis Beach who have obtained a bachelor's degree or higher.
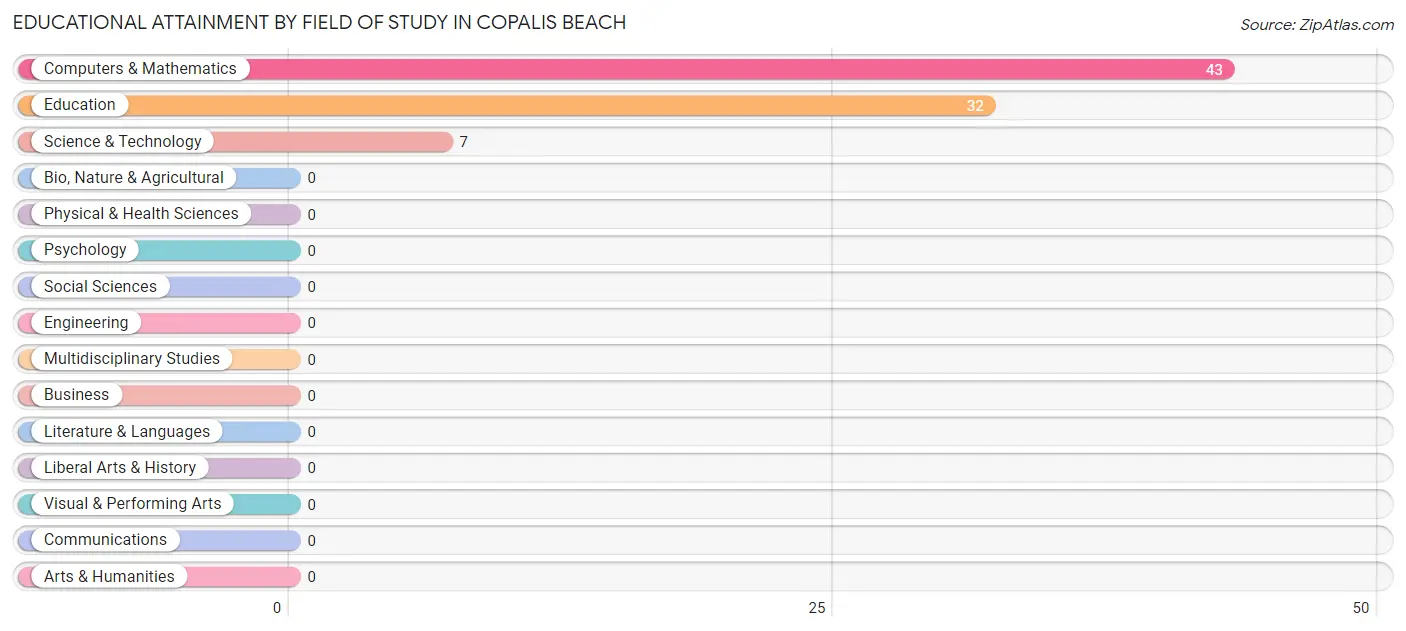
| Field of Study | # Graduates | % Graduates |
| Computers & Mathematics | 43 | 52.4% |
| Bio, Nature & Agricultural | 0 | 0.0% |
| Physical & Health Sciences | 0 | 0.0% |
| Psychology | 0 | 0.0% |
| Social Sciences | 0 | 0.0% |
| Engineering | 0 | 0.0% |
| Multidisciplinary Studies | 0 | 0.0% |
| Science & Technology | 7 | 8.5% |
| Business | 0 | 0.0% |
| Education | 32 | 39.0% |
| Literature & Languages | 0 | 0.0% |
| Liberal Arts & History | 0 | 0.0% |
| Visual & Performing Arts | 0 | 0.0% |
| Communications | 0 | 0.0% |
| Arts & Humanities | 0 | 0.0% |
| Total | 82 | 100.0% |
Transportation & Commute in Copalis Beach
Vehicle Availability by Sex in Copalis Beach
The most prevalent vehicle ownership categories in Copalis Beach are males with 3 vehicles (19, accounting for 100.0%) and females with 3 vehicles (7, making up 27.5%).
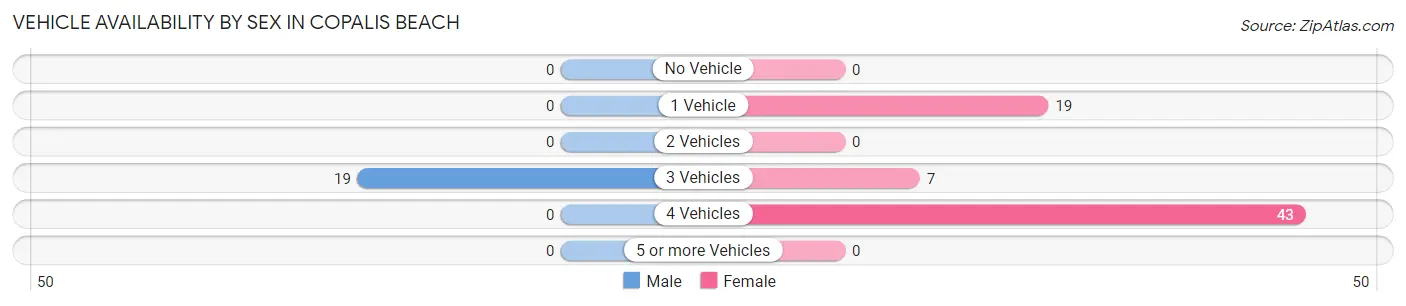
| Vehicles Available | Male | Female |
| No Vehicle | 0 (0.0%) | 0 (0.0%) |
| 1 Vehicle | 0 (0.0%) | 19 (27.5%) |
| 2 Vehicles | 0 (0.0%) | 0 (0.0%) |
| 3 Vehicles | 19 (100.0%) | 7 (10.1%) |
| 4 Vehicles | 0 (0.0%) | 43 (62.3%) |
| 5 or more Vehicles | 0 (0.0%) | 0 (0.0%) |
| Total | 19 (100.0%) | 69 (100.0%) |
Commute Time in Copalis Beach
The most frequently occuring commute durations in Copalis Beach are 60 to 89 minutes (43 commuters, 61.4%), 40 to 44 minutes (19 commuters, 27.1%), and 5 to 9 minutes (8 commuters, 11.4%).
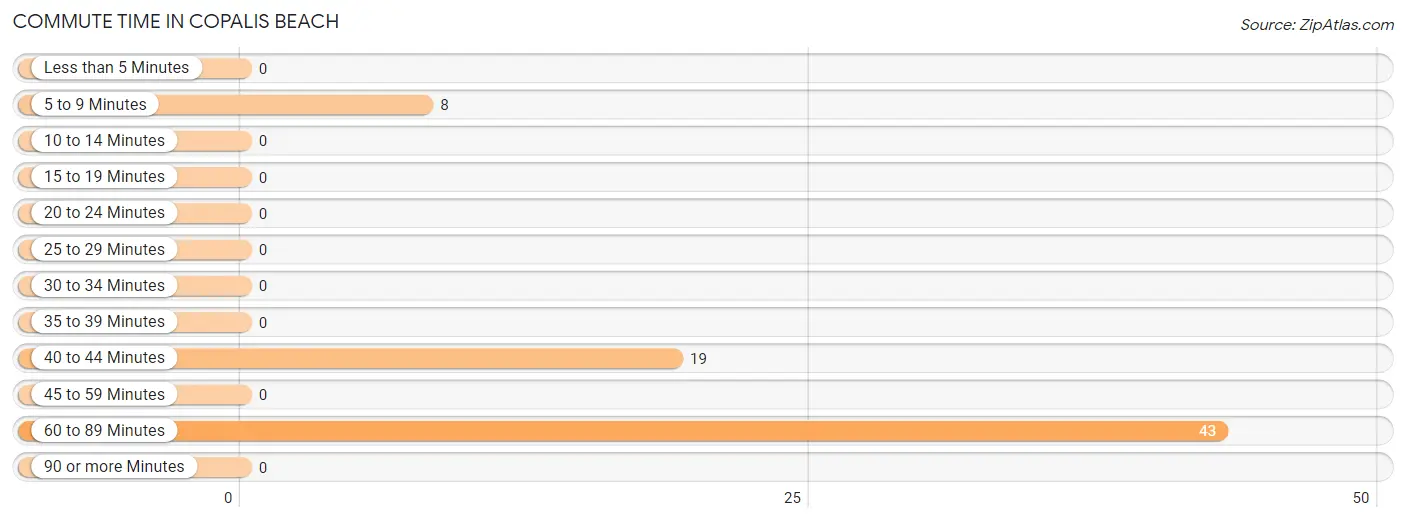
| Commute Time | # Commuters | % Commuters |
| Less than 5 Minutes | 0 | 0.0% |
| 5 to 9 Minutes | 8 | 11.4% |
| 10 to 14 Minutes | 0 | 0.0% |
| 15 to 19 Minutes | 0 | 0.0% |
| 20 to 24 Minutes | 0 | 0.0% |
| 25 to 29 Minutes | 0 | 0.0% |
| 30 to 34 Minutes | 0 | 0.0% |
| 35 to 39 Minutes | 0 | 0.0% |
| 40 to 44 Minutes | 19 | 27.1% |
| 45 to 59 Minutes | 0 | 0.0% |
| 60 to 89 Minutes | 43 | 61.4% |
| 90 or more Minutes | 0 | 0.0% |
Commute Time by Sex in Copalis Beach
The most common commute times in Copalis Beach are 5 to 9 minutes (8 commuters, 100.0%) for males and 60 to 89 minutes (43 commuters, 69.4%) for females.
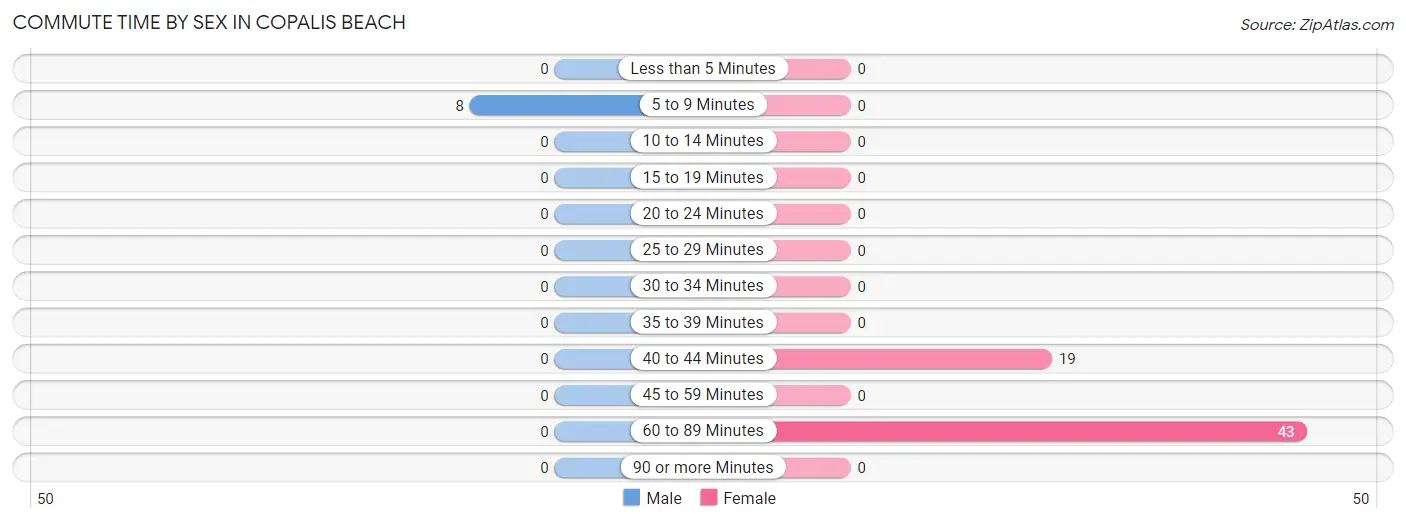
| Commute Time | Male | Female |
| Less than 5 Minutes | 0 (0.0%) | 0 (0.0%) |
| 5 to 9 Minutes | 8 (100.0%) | 0 (0.0%) |
| 10 to 14 Minutes | 0 (0.0%) | 0 (0.0%) |
| 15 to 19 Minutes | 0 (0.0%) | 0 (0.0%) |
| 20 to 24 Minutes | 0 (0.0%) | 0 (0.0%) |
| 25 to 29 Minutes | 0 (0.0%) | 0 (0.0%) |
| 30 to 34 Minutes | 0 (0.0%) | 0 (0.0%) |
| 35 to 39 Minutes | 0 (0.0%) | 0 (0.0%) |
| 40 to 44 Minutes | 0 (0.0%) | 19 (30.6%) |
| 45 to 59 Minutes | 0 (0.0%) | 0 (0.0%) |
| 60 to 89 Minutes | 0 (0.0%) | 43 (69.4%) |
| 90 or more Minutes | 0 (0.0%) | 0 (0.0%) |
Time of Departure to Work by Sex in Copalis Beach
The most frequent times of departure to work in Copalis Beach are 7:00 AM to 7:29 AM (8, 100.0%) for males and 9:00 AM to 9:59 AM (43, 69.4%) for females.
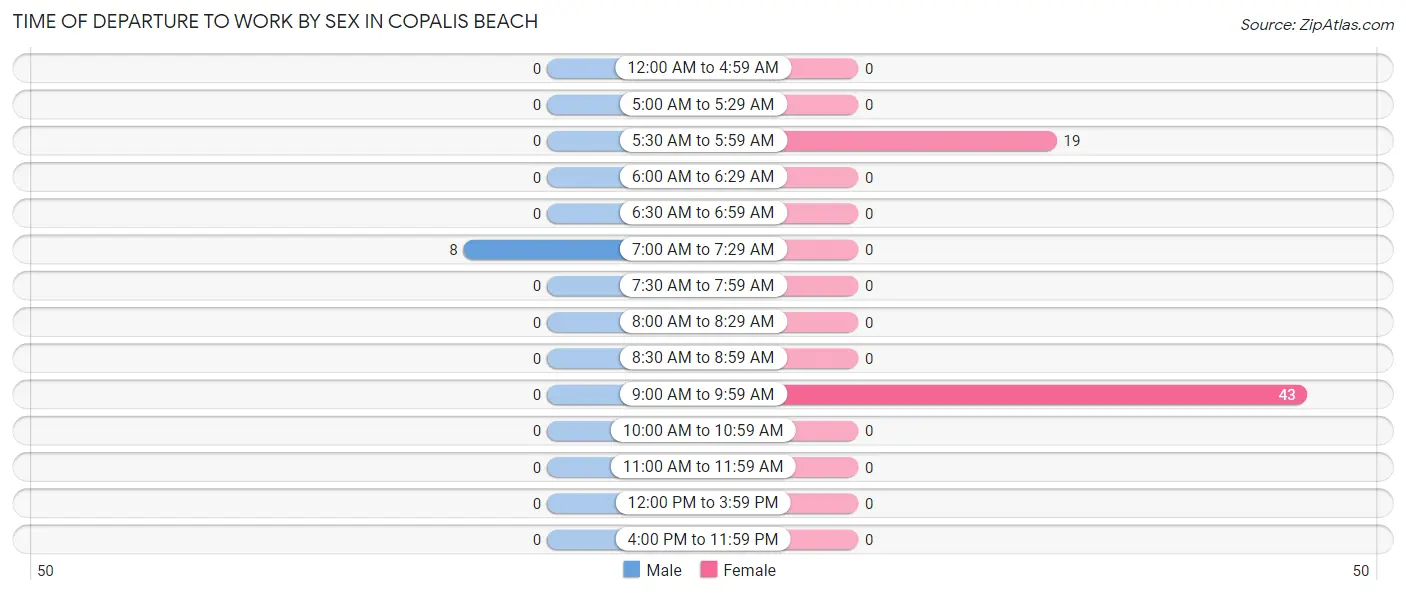
| Time of Departure | Male | Female |
| 12:00 AM to 4:59 AM | 0 (0.0%) | 0 (0.0%) |
| 5:00 AM to 5:29 AM | 0 (0.0%) | 0 (0.0%) |
| 5:30 AM to 5:59 AM | 0 (0.0%) | 19 (30.6%) |
| 6:00 AM to 6:29 AM | 0 (0.0%) | 0 (0.0%) |
| 6:30 AM to 6:59 AM | 0 (0.0%) | 0 (0.0%) |
| 7:00 AM to 7:29 AM | 8 (100.0%) | 0 (0.0%) |
| 7:30 AM to 7:59 AM | 0 (0.0%) | 0 (0.0%) |
| 8:00 AM to 8:29 AM | 0 (0.0%) | 0 (0.0%) |
| 8:30 AM to 8:59 AM | 0 (0.0%) | 0 (0.0%) |
| 9:00 AM to 9:59 AM | 0 (0.0%) | 43 (69.4%) |
| 10:00 AM to 10:59 AM | 0 (0.0%) | 0 (0.0%) |
| 11:00 AM to 11:59 AM | 0 (0.0%) | 0 (0.0%) |
| 12:00 PM to 3:59 PM | 0 (0.0%) | 0 (0.0%) |
| 4:00 PM to 11:59 PM | 0 (0.0%) | 0 (0.0%) |
| Total | 8 (100.0%) | 62 (100.0%) |
Housing Occupancy in Copalis Beach
Occupancy by Ownership in Copalis Beach
Of the total 169 dwellings in Copalis Beach, owner-occupied units account for 161 (95.3%), while renter-occupied units make up 8 (4.7%).
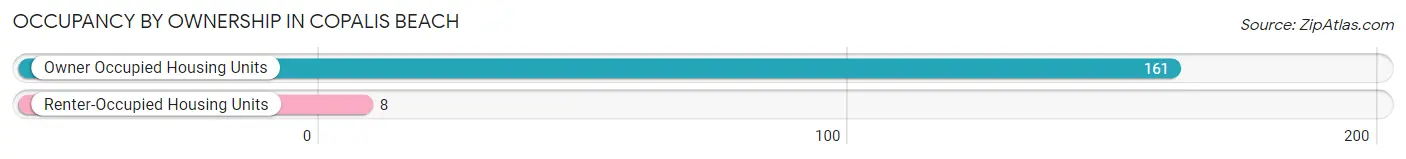
| Occupancy | # Housing Units | % Housing Units |
| Owner Occupied Housing Units | 161 | 95.3% |
| Renter-Occupied Housing Units | 8 | 4.7% |
| Total Occupied Housing Units | 169 | 100.0% |
Occupancy by Household Size in Copalis Beach
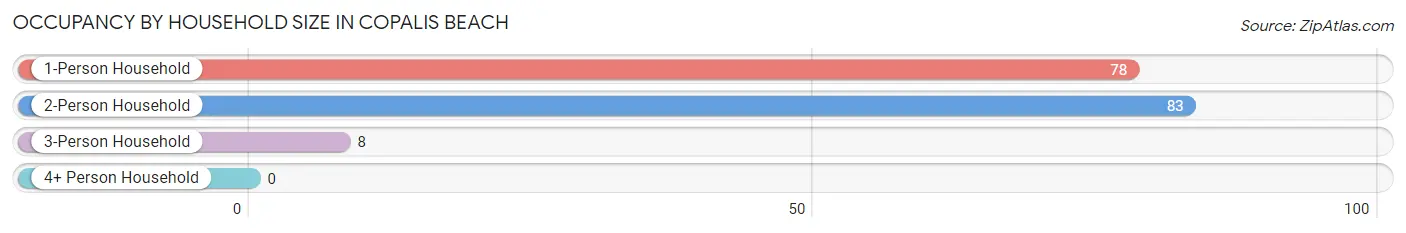
| Household Size | # Housing Units | % Housing Units |
| 1-Person Household | 78 | 46.2% |
| 2-Person Household | 83 | 49.1% |
| 3-Person Household | 8 | 4.7% |
| 4+ Person Household | 0 | 0.0% |
| Total Housing Units | 169 | 100.0% |
Occupancy by Ownership by Household Size in Copalis Beach
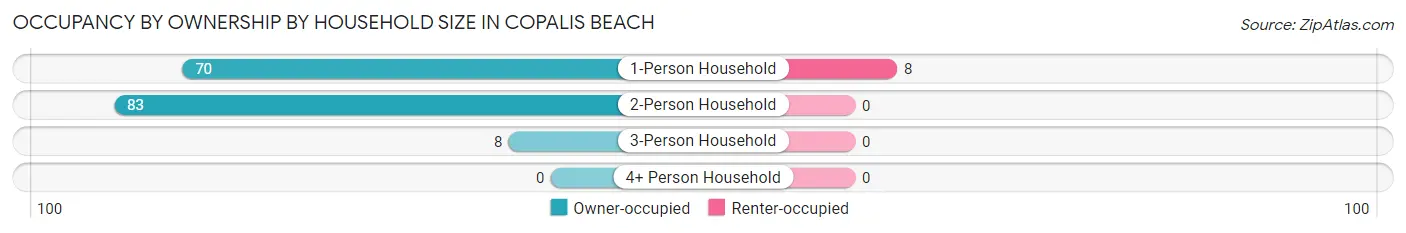
| Household Size | Owner-occupied | Renter-occupied |
| 1-Person Household | 70 (89.7%) | 8 (10.3%) |
| 2-Person Household | 83 (100.0%) | 0 (0.0%) |
| 3-Person Household | 8 (100.0%) | 0 (0.0%) |
| 4+ Person Household | 0 (0.0%) | 0 (0.0%) |
| Total Housing Units | 161 (95.3%) | 8 (4.7%) |
Occupancy by Educational Attainment in Copalis Beach
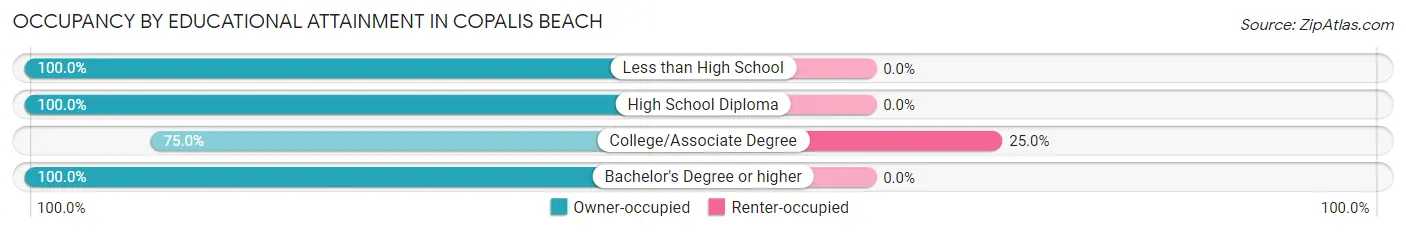
| Household Size | Owner-occupied | Renter-occupied |
| Less than High School | 20 (100.0%) | 0 (0.0%) |
| High School Diploma | 42 (100.0%) | 0 (0.0%) |
| College/Associate Degree | 24 (75.0%) | 8 (25.0%) |
| Bachelor's Degree or higher | 75 (100.0%) | 0 (0.0%) |
Occupancy by Age of Householder in Copalis Beach
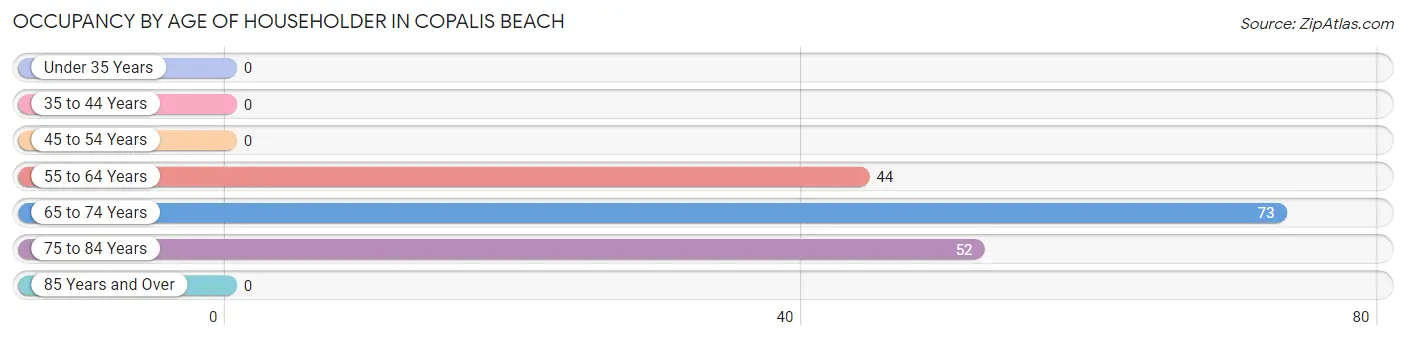
| Age Bracket | # Households | % Households |
| Under 35 Years | 0 | 0.0% |
| 35 to 44 Years | 0 | 0.0% |
| 45 to 54 Years | 0 | 0.0% |
| 55 to 64 Years | 44 | 26.0% |
| 65 to 74 Years | 73 | 43.2% |
| 75 to 84 Years | 52 | 30.8% |
| 85 Years and Over | 0 | 0.0% |
| Total | 169 | 100.0% |
Housing Finances in Copalis Beach
Median Income by Occupancy in Copalis Beach
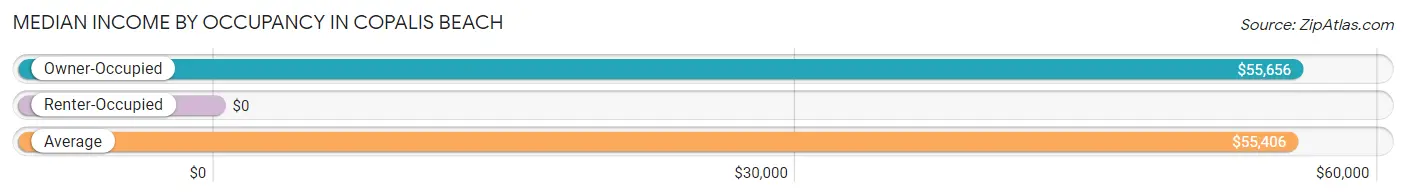
| Occupancy Type | # Households | Median Income |
| Owner-Occupied | 161 (95.3%) | $55,656 |
| Renter-Occupied | 8 (4.7%) | $0 |
| Average | 169 (100.0%) | $55,406 |
Occupancy by Householder Income Bracket in Copalis Beach
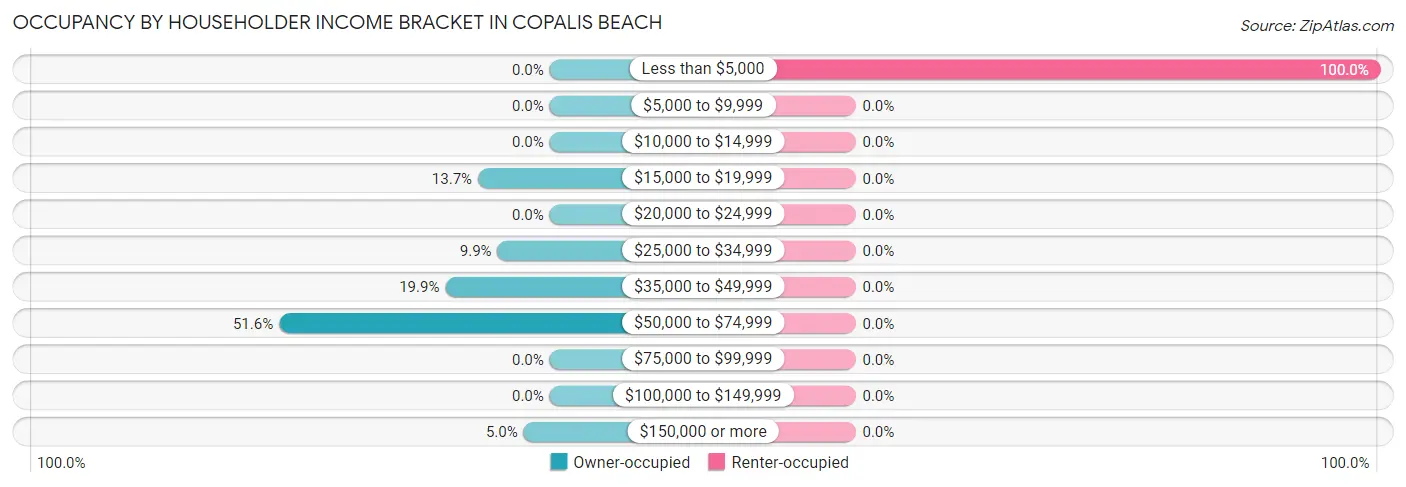
| Income Bracket | Owner-occupied | Renter-occupied |
| Less than $5,000 | 0 (0.0%) | 8 (100.0%) |
| $5,000 to $9,999 | 0 (0.0%) | 0 (0.0%) |
| $10,000 to $14,999 | 0 (0.0%) | 0 (0.0%) |
| $15,000 to $19,999 | 22 (13.7%) | 0 (0.0%) |
| $20,000 to $24,999 | 0 (0.0%) | 0 (0.0%) |
| $25,000 to $34,999 | 16 (9.9%) | 0 (0.0%) |
| $35,000 to $49,999 | 32 (19.9%) | 0 (0.0%) |
| $50,000 to $74,999 | 83 (51.5%) | 0 (0.0%) |
| $75,000 to $99,999 | 0 (0.0%) | 0 (0.0%) |
| $100,000 to $149,999 | 0 (0.0%) | 0 (0.0%) |
| $150,000 or more | 8 (5.0%) | 0 (0.0%) |
| Total | 161 (100.0%) | 8 (100.0%) |
Monthly Housing Cost Tiers in Copalis Beach
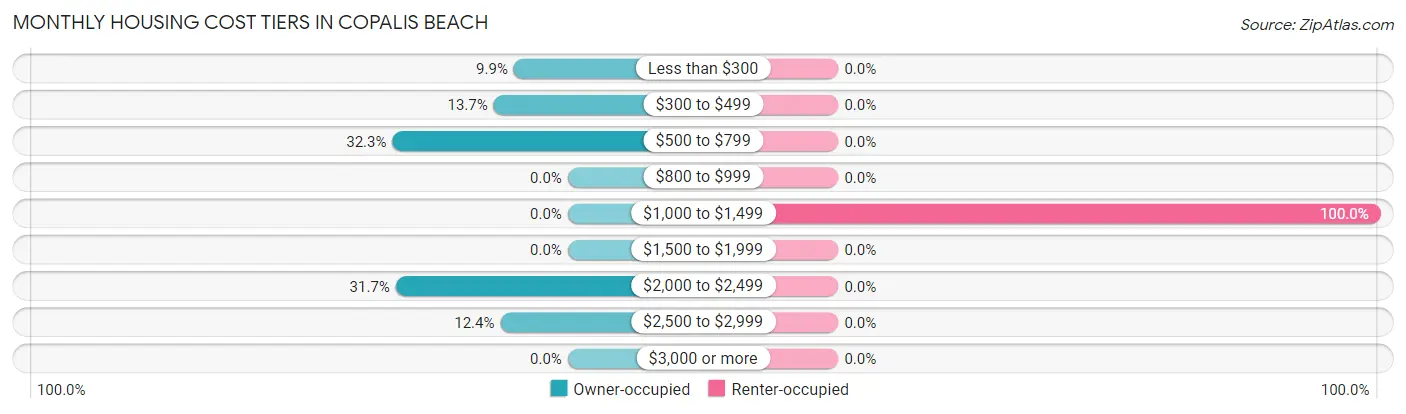
| Monthly Cost | Owner-occupied | Renter-occupied |
| Less than $300 | 16 (9.9%) | 0 (0.0%) |
| $300 to $499 | 22 (13.7%) | 0 (0.0%) |
| $500 to $799 | 52 (32.3%) | 0 (0.0%) |
| $800 to $999 | 0 (0.0%) | 0 (0.0%) |
| $1,000 to $1,499 | 0 (0.0%) | 8 (100.0%) |
| $1,500 to $1,999 | 0 (0.0%) | 0 (0.0%) |
| $2,000 to $2,499 | 51 (31.7%) | 0 (0.0%) |
| $2,500 to $2,999 | 20 (12.4%) | 0 (0.0%) |
| $3,000 or more | 0 (0.0%) | 0 (0.0%) |
| Total | 161 (100.0%) | 8 (100.0%) |
Physical Housing Characteristics in Copalis Beach
Housing Structures in Copalis Beach
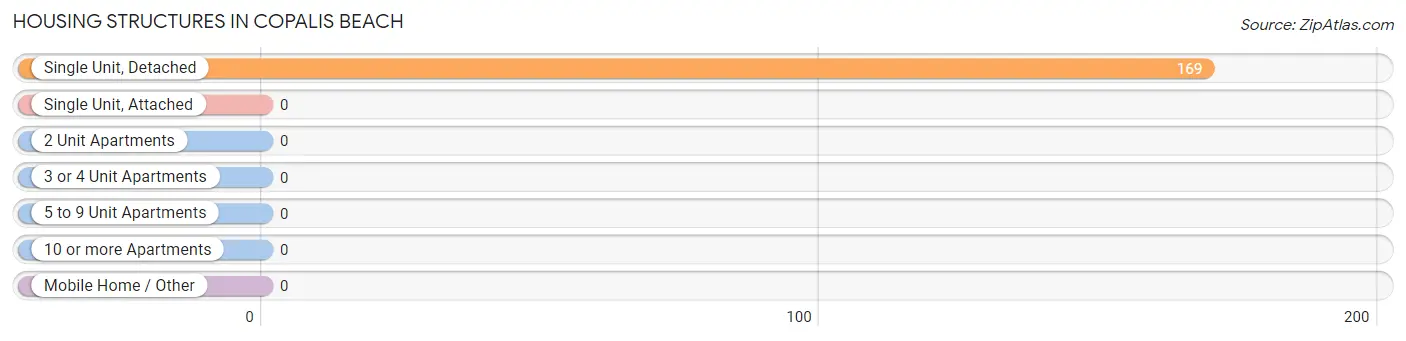
| Structure Type | # Housing Units | % Housing Units |
| Single Unit, Detached | 169 | 100.0% |
| Single Unit, Attached | 0 | 0.0% |
| 2 Unit Apartments | 0 | 0.0% |
| 3 or 4 Unit Apartments | 0 | 0.0% |
| 5 to 9 Unit Apartments | 0 | 0.0% |
| 10 or more Apartments | 0 | 0.0% |
| Mobile Home / Other | 0 | 0.0% |
| Total | 169 | 100.0% |
Housing Structures by Occupancy in Copalis Beach
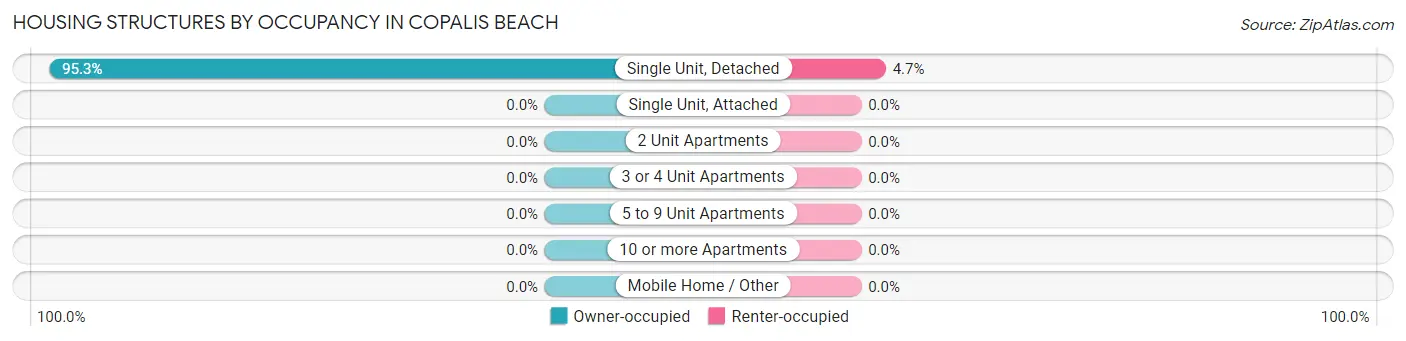
| Structure Type | Owner-occupied | Renter-occupied |
| Single Unit, Detached | 161 (95.3%) | 8 (4.7%) |
| Single Unit, Attached | 0 (0.0%) | 0 (0.0%) |
| 2 Unit Apartments | 0 (0.0%) | 0 (0.0%) |
| 3 or 4 Unit Apartments | 0 (0.0%) | 0 (0.0%) |
| 5 to 9 Unit Apartments | 0 (0.0%) | 0 (0.0%) |
| 10 or more Apartments | 0 (0.0%) | 0 (0.0%) |
| Mobile Home / Other | 0 (0.0%) | 0 (0.0%) |
| Total | 161 (95.3%) | 8 (4.7%) |
Housing Structures by Number of Rooms in Copalis Beach
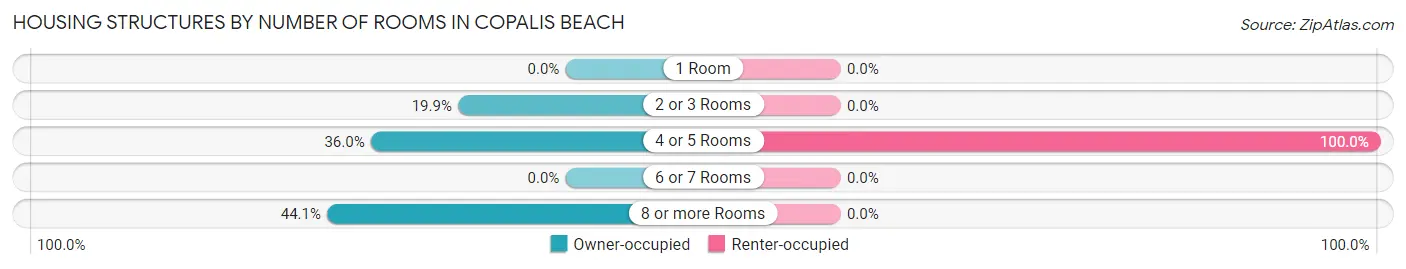
| Number of Rooms | Owner-occupied | Renter-occupied |
| 1 Room | 0 (0.0%) | 0 (0.0%) |
| 2 or 3 Rooms | 32 (19.9%) | 0 (0.0%) |
| 4 or 5 Rooms | 58 (36.0%) | 8 (100.0%) |
| 6 or 7 Rooms | 0 (0.0%) | 0 (0.0%) |
| 8 or more Rooms | 71 (44.1%) | 0 (0.0%) |
| Total | 161 (100.0%) | 8 (100.0%) |
Housing Structure by Heating Type in Copalis Beach
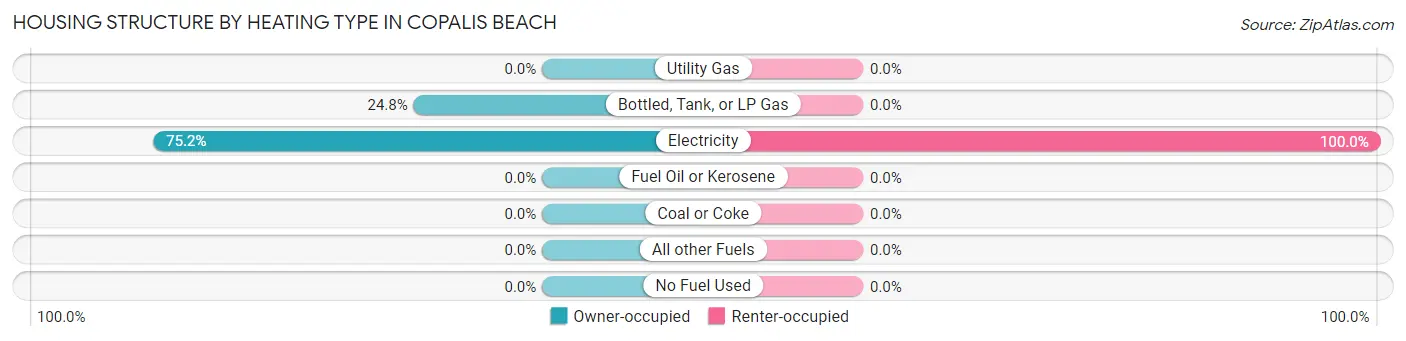
| Heating Type | Owner-occupied | Renter-occupied |
| Utility Gas | 0 (0.0%) | 0 (0.0%) |
| Bottled, Tank, or LP Gas | 40 (24.8%) | 0 (0.0%) |
| Electricity | 121 (75.2%) | 8 (100.0%) |
| Fuel Oil or Kerosene | 0 (0.0%) | 0 (0.0%) |
| Coal or Coke | 0 (0.0%) | 0 (0.0%) |
| All other Fuels | 0 (0.0%) | 0 (0.0%) |
| No Fuel Used | 0 (0.0%) | 0 (0.0%) |
| Total | 161 (100.0%) | 8 (100.0%) |
Household Vehicle Usage in Copalis Beach
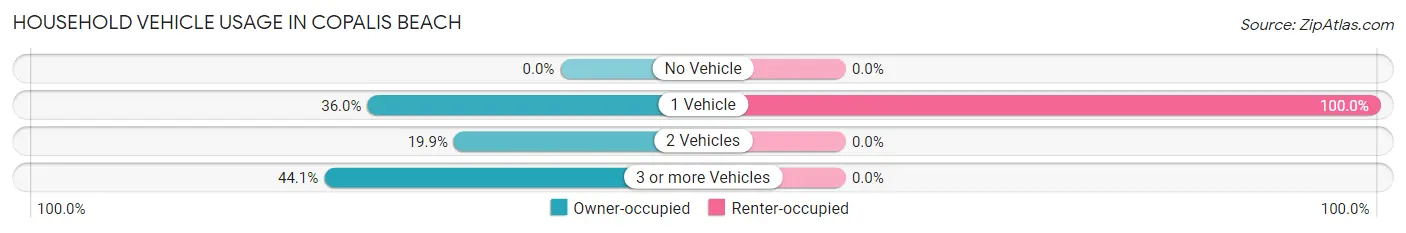
| Vehicles per Household | Owner-occupied | Renter-occupied |
| No Vehicle | 0 (0.0%) | 0 (0.0%) |
| 1 Vehicle | 58 (36.0%) | 8 (100.0%) |
| 2 Vehicles | 32 (19.9%) | 0 (0.0%) |
| 3 or more Vehicles | 71 (44.1%) | 0 (0.0%) |
| Total | 161 (100.0%) | 8 (100.0%) |
Real Estate & Mortgages in Copalis Beach
Real Estate and Mortgage Overview in Copalis Beach
| Characteristic | Without Mortgage | With Mortgage |
| Housing Units | 52 | 109 |
| Median Property Value | - | - |
| Median Household Income | - | - |
| Monthly Housing Costs | - | - |
| Real Estate Taxes | - | - |
Property Value by Mortgage Status in Copalis Beach
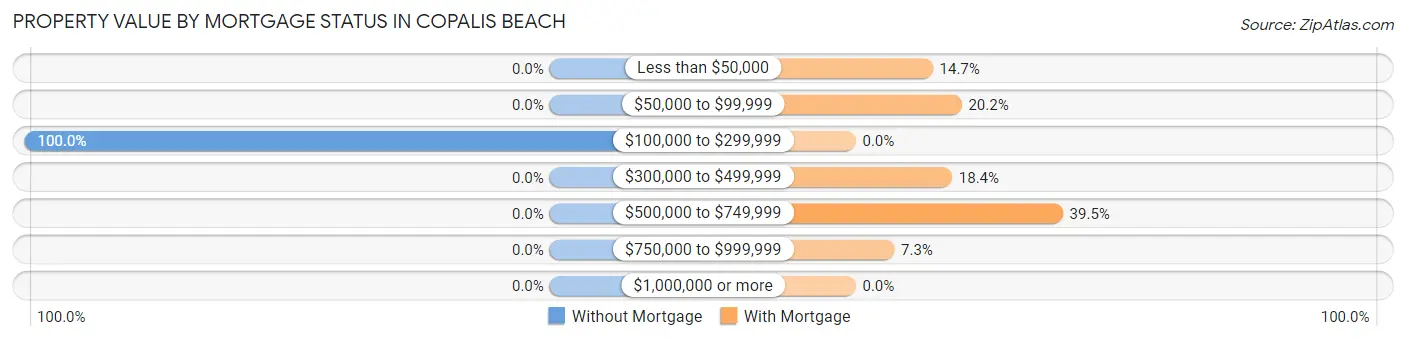
| Property Value | Without Mortgage | With Mortgage |
| Less than $50,000 | 0 (0.0%) | 16 (14.7%) |
| $50,000 to $99,999 | 0 (0.0%) | 22 (20.2%) |
| $100,000 to $299,999 | 52 (100.0%) | 0 (0.0%) |
| $300,000 to $499,999 | 0 (0.0%) | 20 (18.3%) |
| $500,000 to $749,999 | 0 (0.0%) | 43 (39.5%) |
| $750,000 to $999,999 | 0 (0.0%) | 8 (7.3%) |
| $1,000,000 or more | 0 (0.0%) | 0 (0.0%) |
| Total | 52 (100.0%) | 109 (100.0%) |
Household Income by Mortgage Status in Copalis Beach
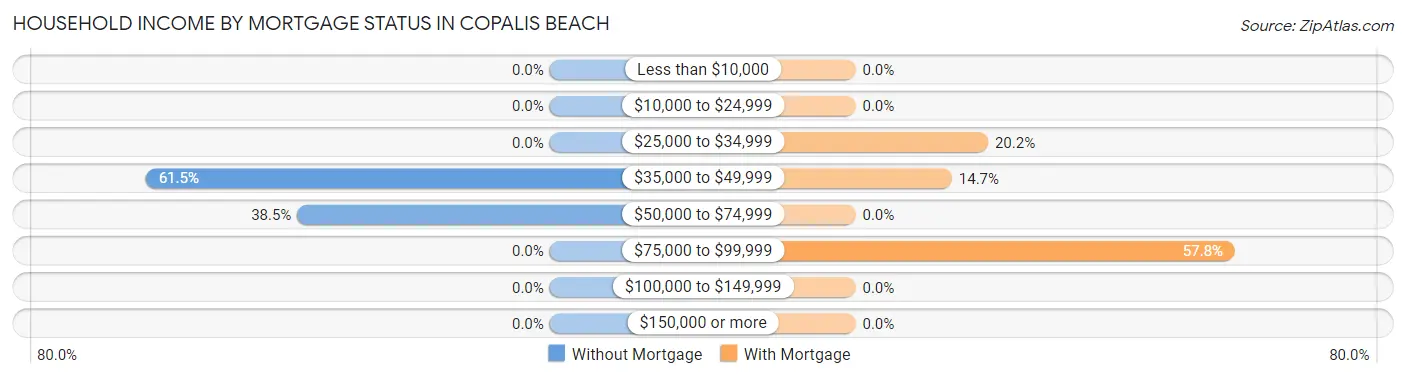
| Household Income | Without Mortgage | With Mortgage |
| Less than $10,000 | 0 (0.0%) | 0 (0.0%) |
| $10,000 to $24,999 | 0 (0.0%) | 0 (0.0%) |
| $25,000 to $34,999 | 0 (0.0%) | 22 (20.2%) |
| $35,000 to $49,999 | 32 (61.5%) | 16 (14.7%) |
| $50,000 to $74,999 | 20 (38.5%) | 0 (0.0%) |
| $75,000 to $99,999 | 0 (0.0%) | 63 (57.8%) |
| $100,000 to $149,999 | 0 (0.0%) | 0 (0.0%) |
| $150,000 or more | 0 (0.0%) | 0 (0.0%) |
| Total | 52 (100.0%) | 109 (100.0%) |
Property Value to Household Income Ratio in Copalis Beach
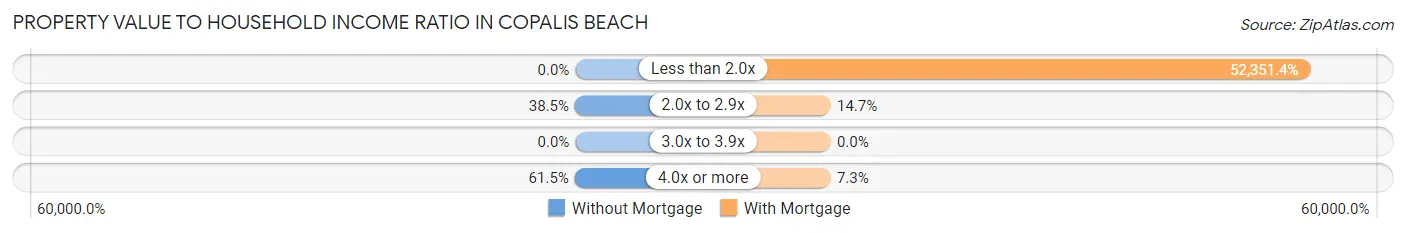
| Value-to-Income Ratio | Without Mortgage | With Mortgage |
| Less than 2.0x | 0 (0.0%) | 57,063 (52,351.4%) |
| 2.0x to 2.9x | 20 (38.5%) | 16 (14.7%) |
| 3.0x to 3.9x | 0 (0.0%) | 0 (0.0%) |
| 4.0x or more | 32 (61.5%) | 8 (7.3%) |
| Total | 52 (100.0%) | 109 (100.0%) |
Real Estate Taxes by Mortgage Status in Copalis Beach
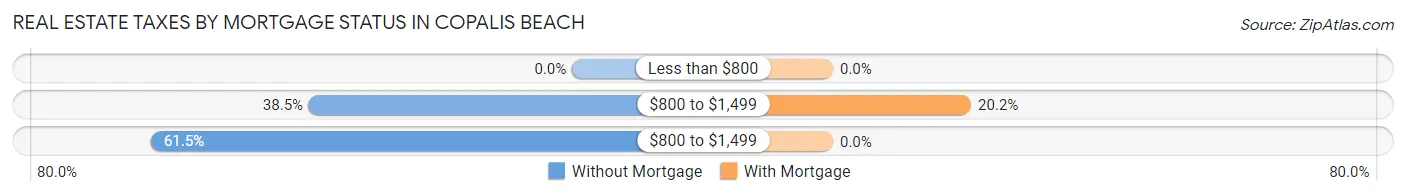
| Property Taxes | Without Mortgage | With Mortgage |
| Less than $800 | 0 (0.0%) | 0 (0.0%) |
| $800 to $1,499 | 20 (38.5%) | 22 (20.2%) |
| $800 to $1,499 | 32 (61.5%) | 0 (0.0%) |
| Total | 52 (100.0%) | 109 (100.0%) |
Health & Disability in Copalis Beach
Health Insurance Coverage by Age in Copalis Beach
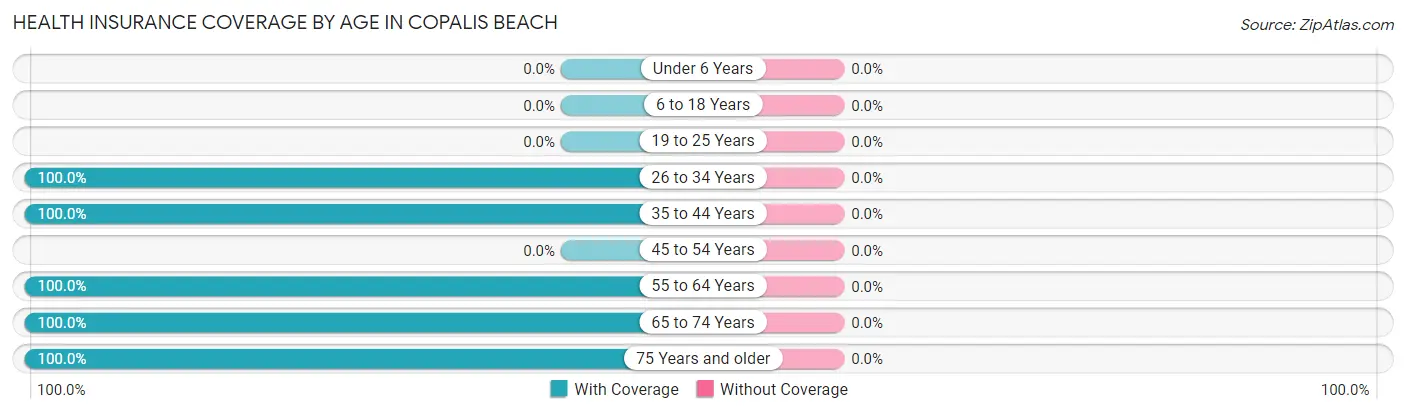
| Age Bracket | With Coverage | Without Coverage |
| Under 6 Years | 0 (0.0%) | 0 (0.0%) |
| 6 to 18 Years | 0 (0.0%) | 0 (0.0%) |
| 19 to 25 Years | 0 (0.0%) | 0 (0.0%) |
| 26 to 34 Years | 43 (100.0%) | 0 (0.0%) |
| 35 to 44 Years | 11 (100.0%) | 0 (0.0%) |
| 45 to 54 Years | 0 (0.0%) | 0 (0.0%) |
| 55 to 64 Years | 51 (100.0%) | 0 (0.0%) |
| 65 to 74 Years | 136 (100.0%) | 0 (0.0%) |
| 75 Years and older | 52 (100.0%) | 0 (0.0%) |
| Total | 293 (100.0%) | 0 (0.0%) |
Health Insurance Coverage by Citizenship Status in Copalis Beach
| Citizenship Status | With Coverage | Without Coverage |
| Native Born | 0 (0.0%) | 0 (0.0%) |
| Foreign Born, Citizen | 0 (0.0%) | 0 (0.0%) |
| Foreign Born, not a Citizen | 0 (0.0%) | 0 (0.0%) |
Health Insurance Coverage by Household Income in Copalis Beach
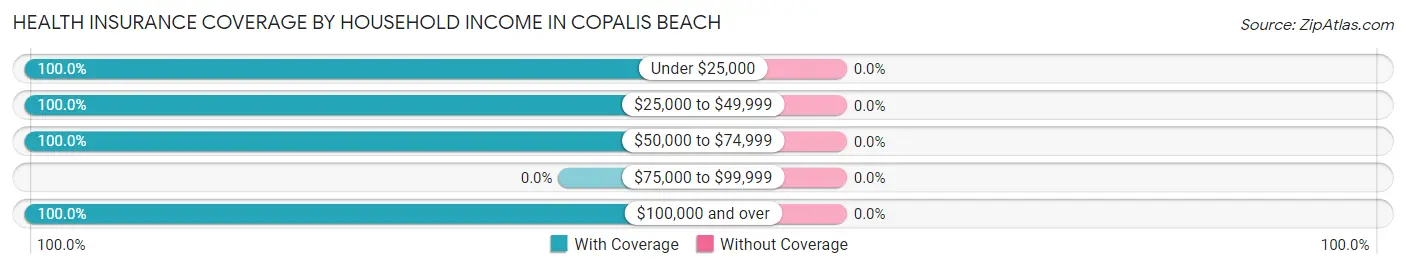
| Household Income | With Coverage | Without Coverage |
| Under $25,000 | 30 (100.0%) | 0 (0.0%) |
| $25,000 to $49,999 | 48 (100.0%) | 0 (0.0%) |
| $50,000 to $74,999 | 189 (100.0%) | 0 (0.0%) |
| $75,000 to $99,999 | 0 (0.0%) | 0 (0.0%) |
| $100,000 and over | 26 (100.0%) | 0 (0.0%) |
Public vs Private Health Insurance Coverage by Age in Copalis Beach
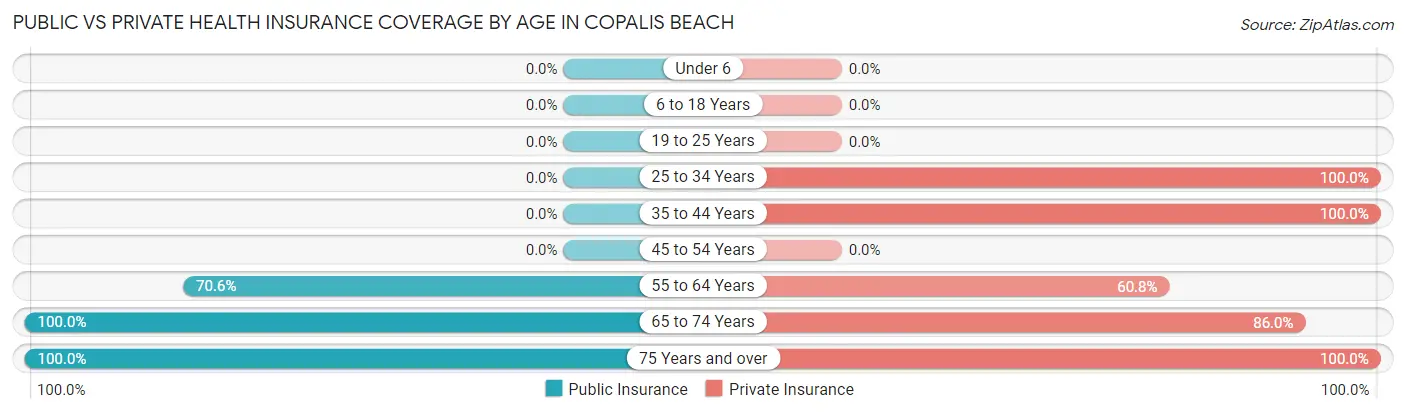
| Age Bracket | Public Insurance | Private Insurance |
| Under 6 | 0 (0.0%) | 0 (0.0%) |
| 6 to 18 Years | 0 (0.0%) | 0 (0.0%) |
| 19 to 25 Years | 0 (0.0%) | 0 (0.0%) |
| 25 to 34 Years | 0 (0.0%) | 43 (100.0%) |
| 35 to 44 Years | 0 (0.0%) | 11 (100.0%) |
| 45 to 54 Years | 0 (0.0%) | 0 (0.0%) |
| 55 to 64 Years | 36 (70.6%) | 31 (60.8%) |
| 65 to 74 Years | 136 (100.0%) | 117 (86.0%) |
| 75 Years and over | 52 (100.0%) | 52 (100.0%) |
| Total | 224 (76.4%) | 254 (86.7%) |
Disability Status by Sex by Age in Copalis Beach
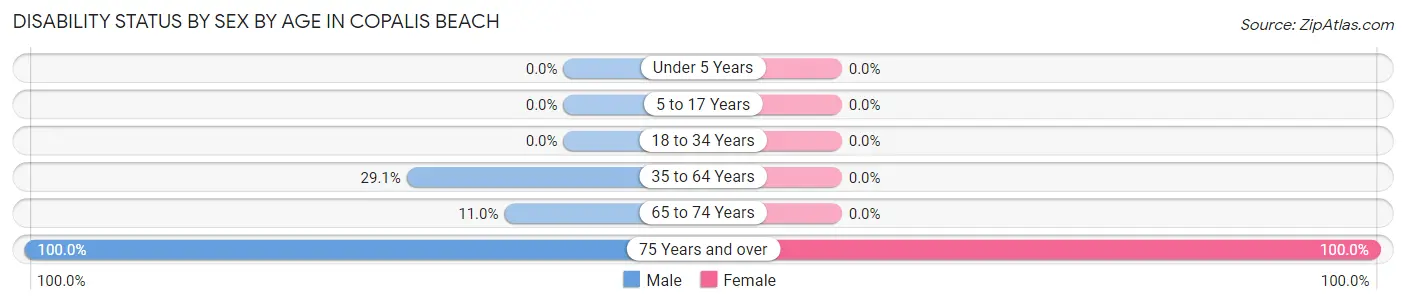
| Age Bracket | Male | Female |
| Under 5 Years | 0 (0.0%) | 0 (0.0%) |
| 5 to 17 Years | 0 (0.0%) | 0 (0.0%) |
| 18 to 34 Years | 0 (0.0%) | 0 (0.0%) |
| 35 to 64 Years | 16 (29.1%) | 0 (0.0%) |
| 65 to 74 Years | 8 (11.0%) | 0 (0.0%) |
| 75 Years and over | 20 (100.0%) | 32 (100.0%) |
Disability Class by Sex by Age in Copalis Beach
Disability Class: Hearing Difficulty
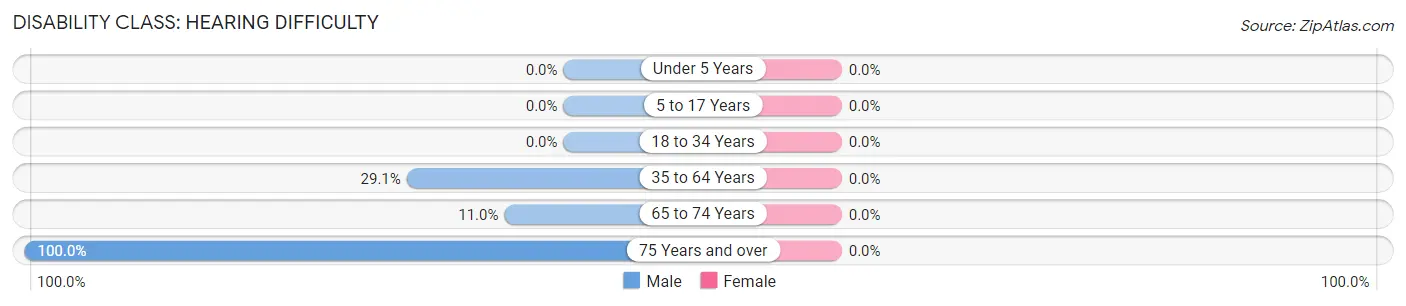
| Age Bracket | Male | Female |
| Under 5 Years | 0 (0.0%) | 0 (0.0%) |
| 5 to 17 Years | 0 (0.0%) | 0 (0.0%) |
| 18 to 34 Years | 0 (0.0%) | 0 (0.0%) |
| 35 to 64 Years | 16 (29.1%) | 0 (0.0%) |
| 65 to 74 Years | 8 (11.0%) | 0 (0.0%) |
| 75 Years and over | 20 (100.0%) | 0 (0.0%) |
Disability Class: Vision Difficulty
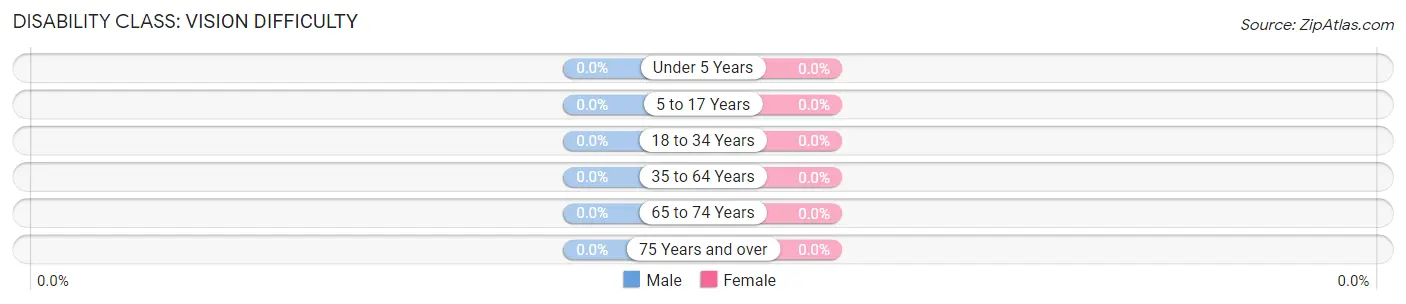
| Age Bracket | Male | Female |
| Under 5 Years | 0 (0.0%) | 0 (0.0%) |
| 5 to 17 Years | 0 (0.0%) | 0 (0.0%) |
| 18 to 34 Years | 0 (0.0%) | 0 (0.0%) |
| 35 to 64 Years | 0 (0.0%) | 0 (0.0%) |
| 65 to 74 Years | 0 (0.0%) | 0 (0.0%) |
| 75 Years and over | 0 (0.0%) | 0 (0.0%) |
Disability Class: Cognitive Difficulty
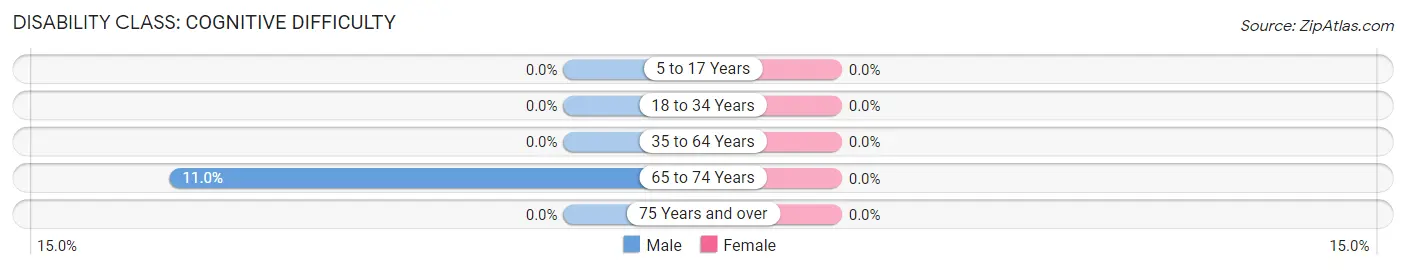
| Age Bracket | Male | Female |
| 5 to 17 Years | 0 (0.0%) | 0 (0.0%) |
| 18 to 34 Years | 0 (0.0%) | 0 (0.0%) |
| 35 to 64 Years | 0 (0.0%) | 0 (0.0%) |
| 65 to 74 Years | 8 (11.0%) | 0 (0.0%) |
| 75 Years and over | 0 (0.0%) | 0 (0.0%) |
Disability Class: Ambulatory Difficulty
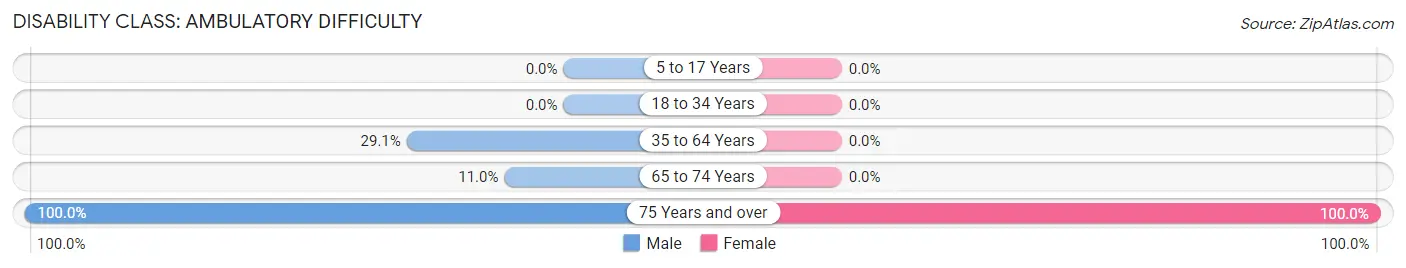
| Age Bracket | Male | Female |
| 5 to 17 Years | 0 (0.0%) | 0 (0.0%) |
| 18 to 34 Years | 0 (0.0%) | 0 (0.0%) |
| 35 to 64 Years | 16 (29.1%) | 0 (0.0%) |
| 65 to 74 Years | 8 (11.0%) | 0 (0.0%) |
| 75 Years and over | 20 (100.0%) | 32 (100.0%) |
Disability Class: Self-Care Difficulty
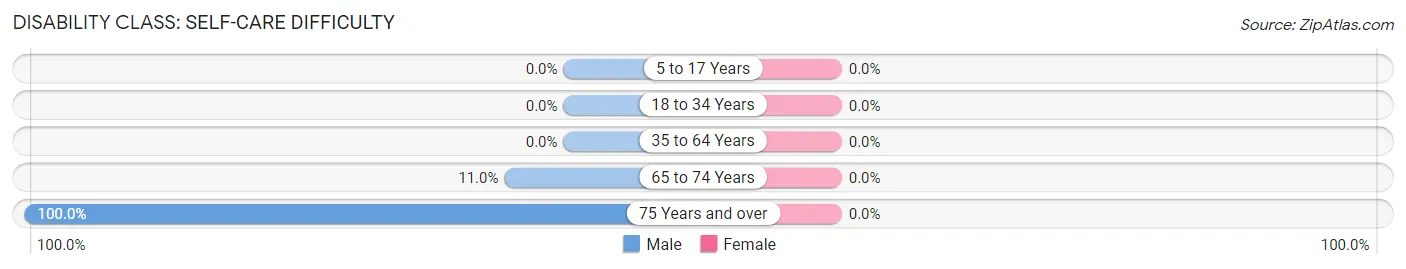
| Age Bracket | Male | Female |
| 5 to 17 Years | 0 (0.0%) | 0 (0.0%) |
| 18 to 34 Years | 0 (0.0%) | 0 (0.0%) |
| 35 to 64 Years | 0 (0.0%) | 0 (0.0%) |
| 65 to 74 Years | 8 (11.0%) | 0 (0.0%) |
| 75 Years and over | 20 (100.0%) | 0 (0.0%) |
Technology Access in Copalis Beach
Computing Device Access in Copalis Beach
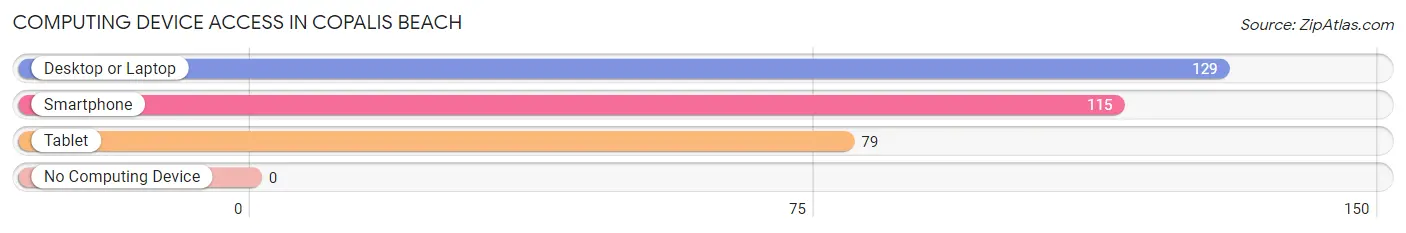
| Device Type | # Households | % Households |
| Desktop or Laptop | 129 | 76.3% |
| Smartphone | 115 | 68.0% |
| Tablet | 79 | 46.8% |
| No Computing Device | 0 | 0.0% |
| Total | 169 | 100.0% |
Internet Access in Copalis Beach
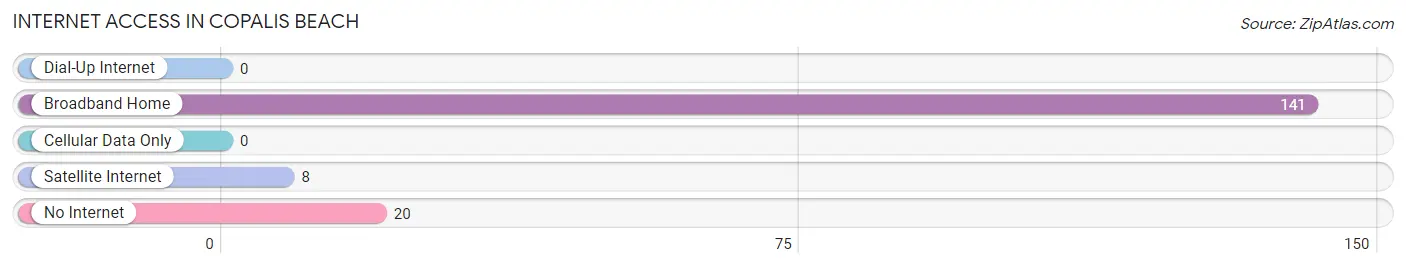
| Internet Type | # Households | % Households |
| Dial-Up Internet | 0 | 0.0% |
| Broadband Home | 141 | 83.4% |
| Cellular Data Only | 0 | 0.0% |
| Satellite Internet | 8 | 4.7% |
| No Internet | 20 | 11.8% |
| Total | 169 | 100.0% |
Copalis Beach Summary
Copalis Beach is a small unincorporated community located in Grays Harbor County, Washington, United States. It is situated on the Pacific Ocean, approximately 8 miles north of Ocean Shores and 8 miles south of Moclips. The population of Copalis Beach was estimated to be around 200 people in 2020.
History
The area now known as Copalis Beach was first inhabited by the Quinault Indian Nation. The Quinault people lived in the area for thousands of years before the arrival of European settlers. The first European settlers arrived in the area in the late 1800s and established a small fishing village. The village was named Copalis Beach after the Copalis River, which flows into the Pacific Ocean near the village.
In the early 1900s, the area began to attract tourists and vacationers. The first hotel was built in the area in 1906 and the first post office was established in 1908. The area continued to grow and by the 1950s, Copalis Beach had become a popular summer destination for families.
Geography
Copalis Beach is located in Grays Harbor County, Washington, United States. It is situated on the Pacific Ocean, approximately 8 miles north of Ocean Shores and 8 miles south of Moclips. The area is surrounded by the Olympic National Forest and is home to several state parks, including Copalis State Park and Copalis Beach State Park.
The climate in Copalis Beach is mild and temperate. The average temperature in the summer is around 70 degrees Fahrenheit and the average temperature in the winter is around 40 degrees Fahrenheit. The area receives an average of 40 inches of rain per year.
Economy
The economy of Copalis Beach is largely based on tourism. The area is a popular destination for beachgoers, hikers, and campers. There are several hotels, restaurants, and shops in the area that cater to tourists. The area is also home to several seafood processing plants, which provide jobs for local residents.
Demographics
The population of Copalis Beach was estimated to be around 200 people in 2020. The racial makeup of the area is predominantly white (90.5%), with small percentages of Native American (2.5%), Asian (2.5%), and African American (2.5%) populations. The median household income in Copalis Beach is $45,000, which is slightly lower than the median household income in Grays Harbor County ($48,000). The median age in Copalis Beach is 44.5 years, which is slightly higher than the median age in Grays Harbor County (41.5 years).
Common Questions
What is Per Capita Income in Copalis Beach?
Per Capita income in Copalis Beach is $34,238.
What is the Median Family Income in Copalis Beach?
Median Family Income in Copalis Beach is $60,320.
What is the Median Household income in Copalis Beach?
Median Household Income in Copalis Beach is $55,406.
What is Inequality or Gini Index in Copalis Beach?
Inequality or Gini Index in Copalis Beach is 0.35.
What is the Total Population of Copalis Beach?
Total Population of Copalis Beach is 293.
What is the Total Male Population of Copalis Beach?
Total Male Population of Copalis Beach is 148.
What is the Total Female Population of Copalis Beach?
Total Female Population of Copalis Beach is 145.
What is the Ratio of Males per 100 Females in Copalis Beach?
There are 102.07 Males per 100 Females in Copalis Beach.
What is the Ratio of Females per 100 Males in Copalis Beach?
There are 97.97 Females per 100 Males in Copalis Beach.
What is the Median Population Age in Copalis Beach?
Median Population Age in Copalis Beach is 70.0 Years.
What is the Average Family Size in Copalis Beach
Average Family Size in Copalis Beach is 2.4 People.
What is the Average Household Size in Copalis Beach
Average Household Size in Copalis Beach is 1.7 People.
How Large is the Labor Force in Copalis Beach?
There are 88 People in the Labor Forcein in Copalis Beach.
What is the Percentage of People in the Labor Force in Copalis Beach?
30.0% of People are in the Labor Force in Copalis Beach.