Zip Codes with the Highest Percentage of Population Employed in Accommodation & Food Services in Kirkland, WA
RELATED REPORTS & OPTIONS
Accommodation & Food Services
Kirkland
Compare Zip Codes
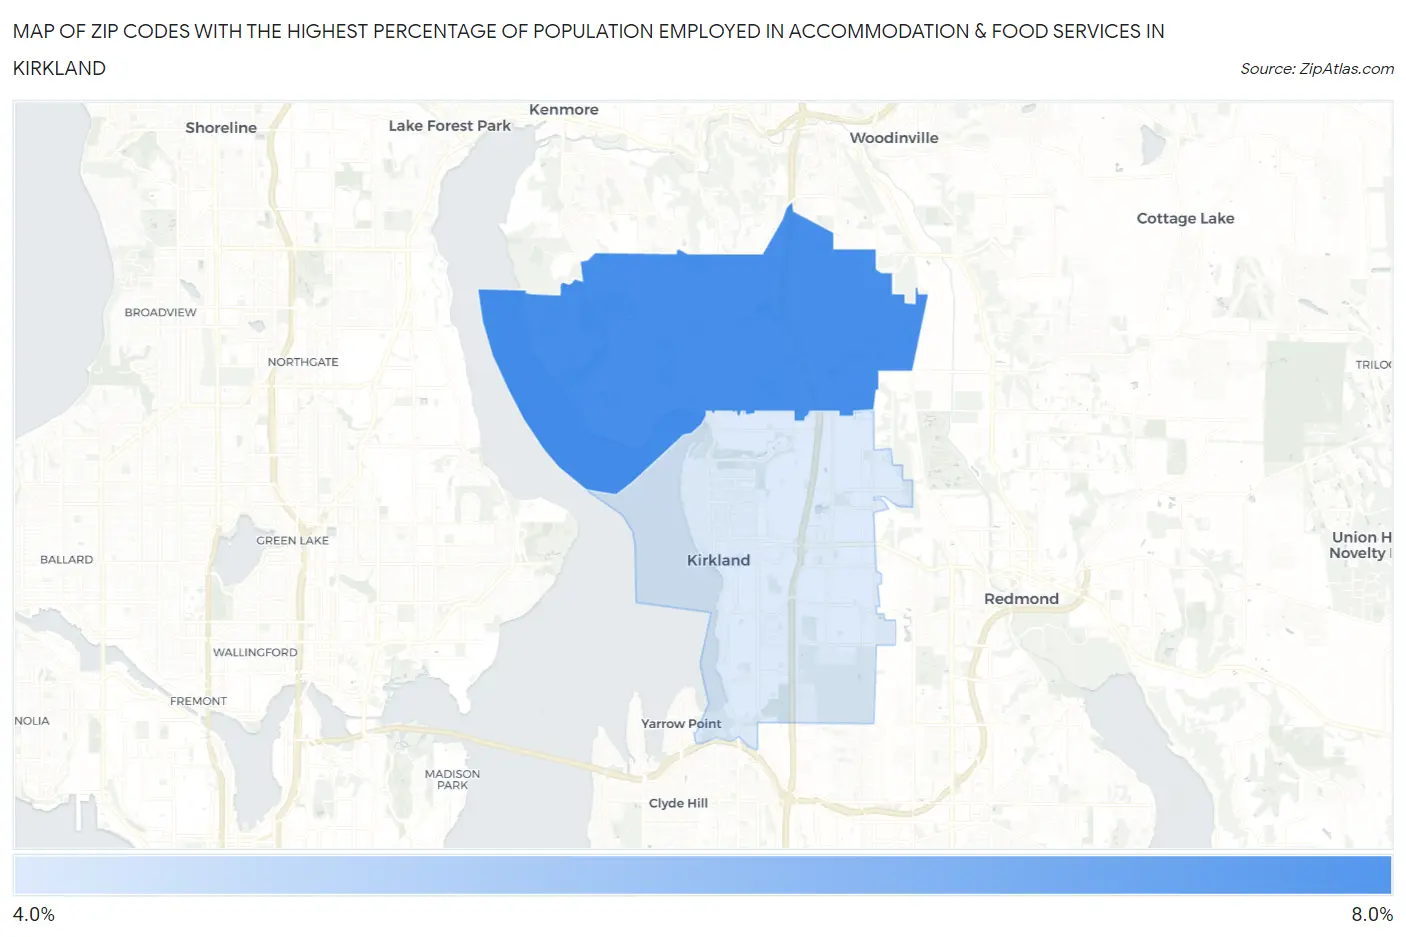
Map of Zip Codes with the Highest Percentage of Population Employed in Accommodation & Food Services in Kirkland
4.2%
6.9%
Zip Codes with the Highest Percentage of Population Employed in Accommodation & Food Services in Kirkland, WA
| Zip Code | % Employed | vs State | vs National | |
| 1. | 98034 | 6.9% | 6.5%(+0.419)#205 | 6.9%(+0.000)#10,636 |
| 2. | 98033 | 4.2% | 6.5%(-2.25)#385 | 6.9%(-2.67)#19,449 |
1
Common Questions
What are the Top Zip Codes with the Highest Percentage of Population Employed in Accommodation & Food Services in Kirkland, WA?
Top Zip Codes with the Highest Percentage of Population Employed in Accommodation & Food Services in Kirkland, WA are:
What zip code has the Highest Percentage of Population Employed in Accommodation & Food Services in Kirkland, WA?
98034 has the Highest Percentage of Population Employed in Accommodation & Food Services in Kirkland, WA with 6.9%.
What is the Percentage of Population Employed in Accommodation & Food Services in Kirkland, WA?
Percentage of Population Employed in Accommodation & Food Services in Kirkland is 5.7%.
What is the Percentage of Population Employed in Accommodation & Food Services in Washington?
Percentage of Population Employed in Accommodation & Food Services in Washington is 6.5%.
What is the Percentage of Population Employed in Accommodation & Food Services in the United States?
Percentage of Population Employed in Accommodation & Food Services in the United States is 6.9%.