Amanda Park, WA Map & Demographics
Amanda Park Map
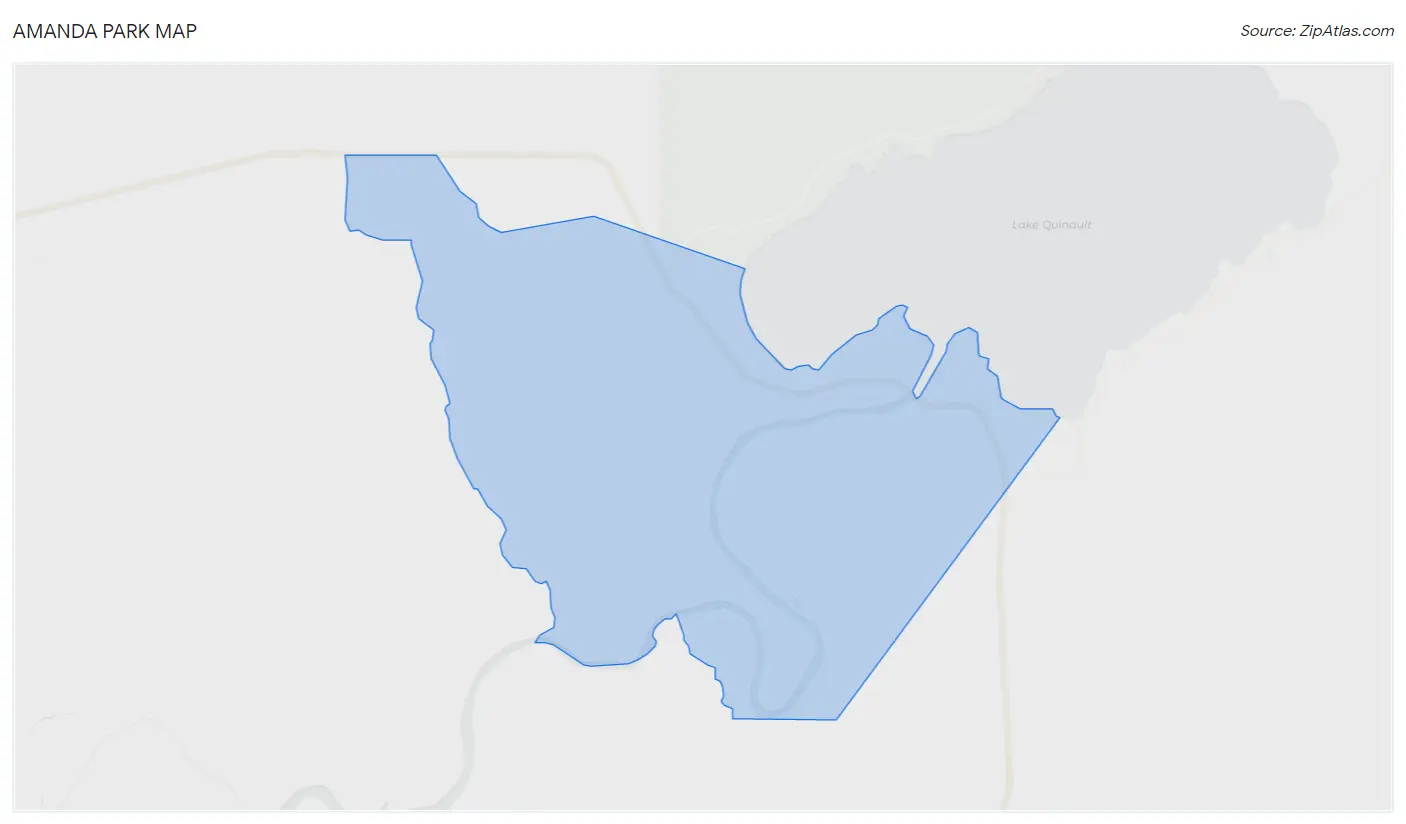
Amanda Park Overview
$20,099
PER CAPITA INCOME
$53,125
AVG FAMILY INCOME
$41,000
AVG HOUSEHOLD INCOME
0.29
INEQUALITY / GINI INDEX
71
TOTAL POPULATION
37
MALE POPULATION
34
FEMALE POPULATION
108.82
MALES / 100 FEMALES
91.89
FEMALES / 100 MALES
31.4
MEDIAN AGE
3.9
AVG FAMILY SIZE
2.5
AVG HOUSEHOLD SIZE
44
LABOR FORCE [ PEOPLE ]
72.1%
PERCENT IN LABOR FORCE
45.5%
UNEMPLOYMENT RATE
Amanda Park Zip Codes
Amanda Park Area Codes
Income in Amanda Park
Income Overview in Amanda Park
Per Capita Income in Amanda Park is $20,099, while median incomes of families and households are $53,125 and $41,000 respectively.
| Characteristic | Number | Measure |
| Per Capita Income | 71 | $20,099 |
| Median Family Income | 12 | $53,125 |
| Mean Family Income | 12 | $55,267 |
| Median Household Income | 28 | $41,000 |
| Mean Household Income | 28 | $49,450 |
| Income Deficit | 12 | $0 |
| Wage / Income Gap (%) | 71 | 0.00% |
| Wage / Income Gap ($) | 71 | 100.00¢ per $1 |
| Gini / Inequality Index | 71 | 0.29 |
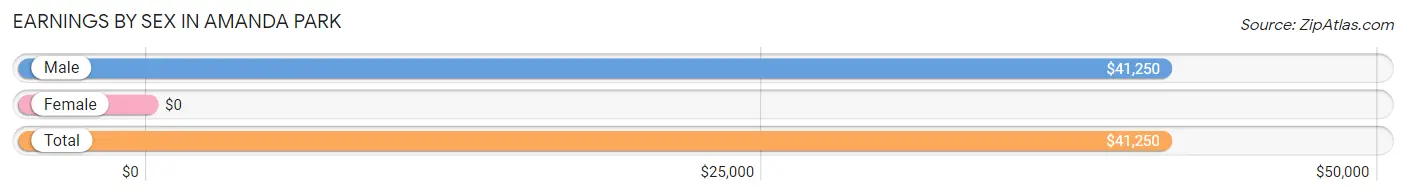
Earnings by Sex in Amanda Park
| Sex | Number | Average Earnings |
| Male | 24 (100.0%) | $41,250 |
| Female | 0 (0.0%) | $0 |
| Total | 24 (100.0%) | $41,250 |
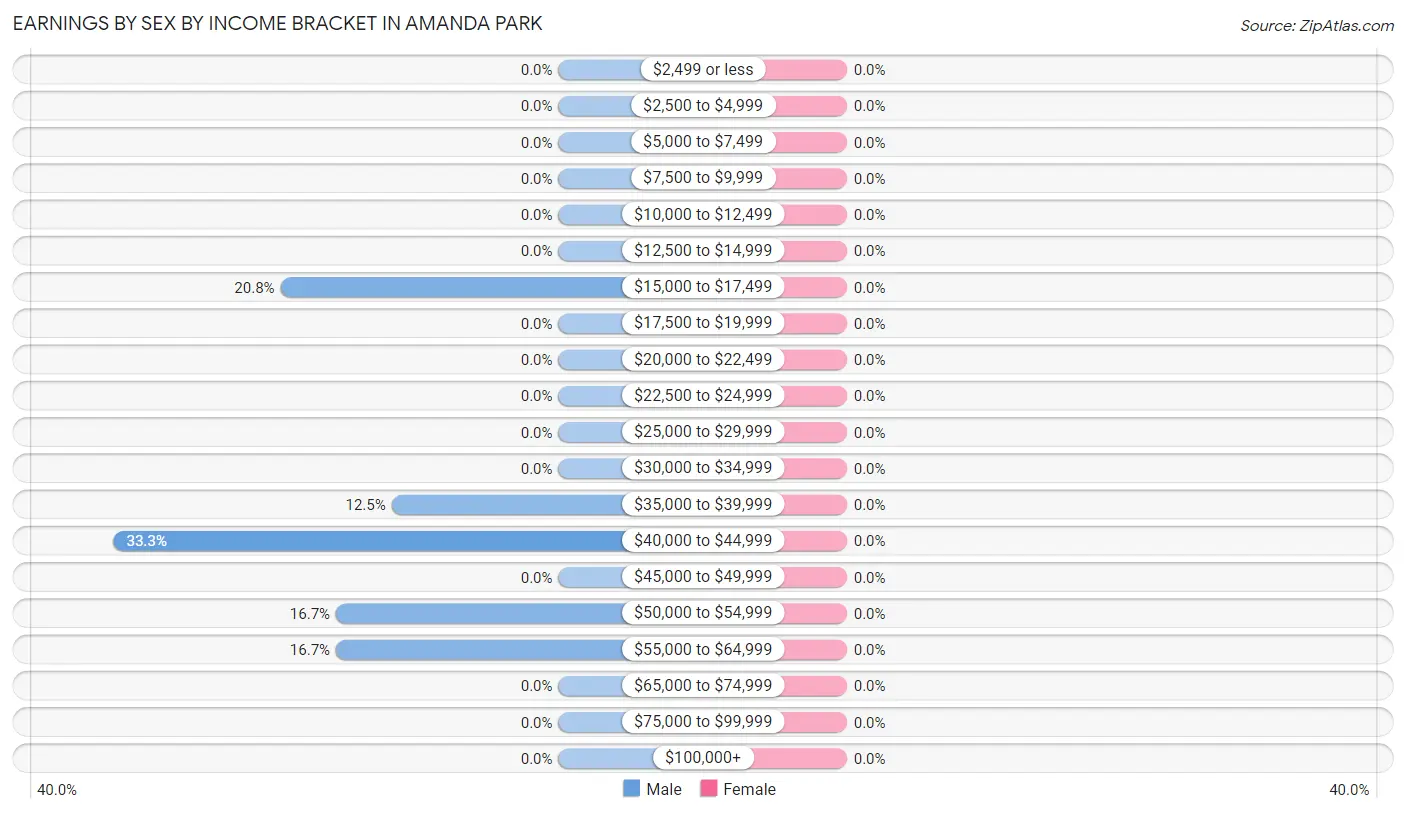
Earnings by Sex by Income Bracket in Amanda Park
| Income | Male | Female |
| $2,499 or less | 0 (0.0%) | 0 (0.0%) |
| $2,500 to $4,999 | 0 (0.0%) | 0 (0.0%) |
| $5,000 to $7,499 | 0 (0.0%) | 0 (0.0%) |
| $7,500 to $9,999 | 0 (0.0%) | 0 (0.0%) |
| $10,000 to $12,499 | 0 (0.0%) | 0 (0.0%) |
| $12,500 to $14,999 | 0 (0.0%) | 0 (0.0%) |
| $15,000 to $17,499 | 5 (20.8%) | 0 (0.0%) |
| $17,500 to $19,999 | 0 (0.0%) | 0 (0.0%) |
| $20,000 to $22,499 | 0 (0.0%) | 0 (0.0%) |
| $22,500 to $24,999 | 0 (0.0%) | 0 (0.0%) |
| $25,000 to $29,999 | 0 (0.0%) | 0 (0.0%) |
| $30,000 to $34,999 | 0 (0.0%) | 0 (0.0%) |
| $35,000 to $39,999 | 3 (12.5%) | 0 (0.0%) |
| $40,000 to $44,999 | 8 (33.3%) | 0 (0.0%) |
| $45,000 to $49,999 | 0 (0.0%) | 0 (0.0%) |
| $50,000 to $54,999 | 4 (16.7%) | 0 (0.0%) |
| $55,000 to $64,999 | 4 (16.7%) | 0 (0.0%) |
| $65,000 to $74,999 | 0 (0.0%) | 0 (0.0%) |
| $75,000 to $99,999 | 0 (0.0%) | 0 (0.0%) |
| $100,000+ | 0 (0.0%) | 0 (0.0%) |
| Total | 24 (100.0%) | 0 (0.0%) |
Earnings by Sex by Educational Attainment in Amanda Park
| Educational Attainment | Male Income | Female Income |
| Less than High School | - | - |
| High School Diploma | - | - |
| College or Associate's Degree | - | - |
| Bachelor's Degree | - | - |
| Graduate Degree | - | - |
| Total | $41,250 | $0 |
Family Income in Amanda Park
Family Income Brackets in Amanda Park
According to the Amanda Park family income data, there are 5 families falling into the $35,000 to $49,999 income range, which is the most common income bracket and makes up 41.7% of all families.
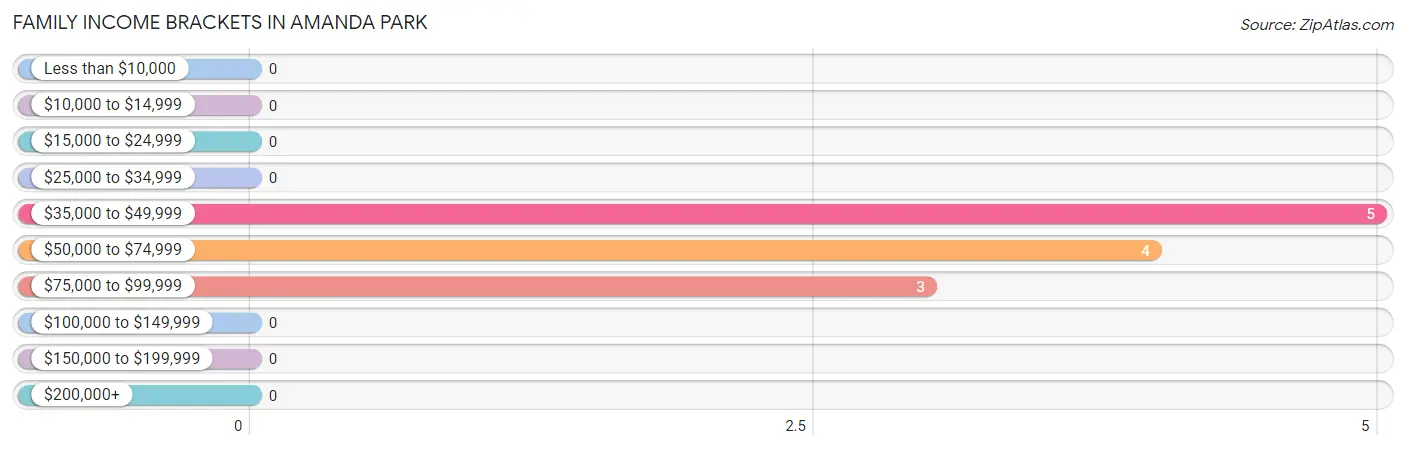
| Income Bracket | # Families | % Families |
| Less than $10,000 | 0 | 0.0% |
| $10,000 to $14,999 | 0 | 0.0% |
| $15,000 to $24,999 | 0 | 0.0% |
| $25,000 to $34,999 | 0 | 0.0% |
| $35,000 to $49,999 | 5 | 41.7% |
| $50,000 to $74,999 | 4 | 33.3% |
| $75,000 to $99,999 | 3 | 25.0% |
| $100,000 to $149,999 | 0 | 0.0% |
| $150,000 to $199,999 | 0 | 0.0% |
| $200,000+ | 0 | 0.0% |
Family Income by Famaliy Size in Amanda Park
| Income Bracket | # Families | Median Income |
| 2-Person Families | 3 (25.0%) | $0 |
| 3-Person Families | 4 (33.3%) | $0 |
| 4-Person Families | 5 (41.7%) | $0 |
| 5-Person Families | 0 (0.0%) | $0 |
| 6-Person Families | 0 (0.0%) | $0 |
| 7+ Person Families | 0 (0.0%) | $0 |
| Total | 12 (100.0%) | $53,125 |
Family Income by Number of Earners in Amanda Park
| Number of Earners | # Families | Median Income |
| No Earners | 0 (0.0%) | $0 |
| 1 Earner | 9 (75.0%) | $0 |
| 2 Earners | 3 (25.0%) | $0 |
| 3+ Earners | 0 (0.0%) | $0 |
| Total | 12 (100.0%) | $53,125 |
Household Income in Amanda Park
Household Income Brackets in Amanda Park
With 8 households falling in the category, the $35,000 to $49,999 income range is the most frequent in Amanda Park, accounting for 28.6% of all households.
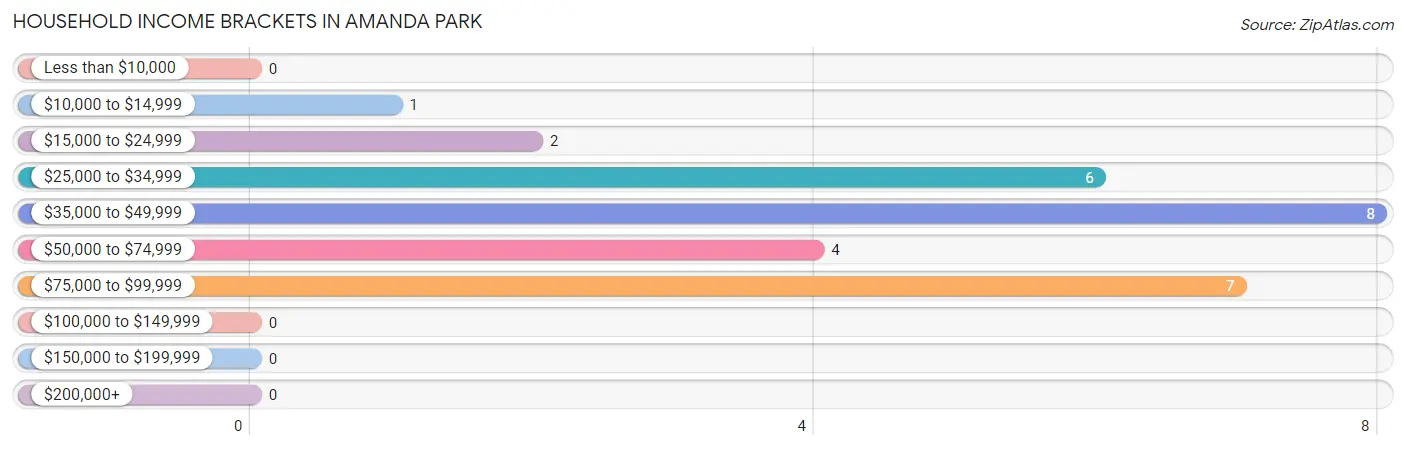
| Income Bracket | # Households | % Households |
| Less than $10,000 | 0 | 0.0% |
| $10,000 to $14,999 | 1 | 3.6% |
| $15,000 to $24,999 | 2 | 7.1% |
| $25,000 to $34,999 | 6 | 21.4% |
| $35,000 to $49,999 | 8 | 28.6% |
| $50,000 to $74,999 | 4 | 14.3% |
| $75,000 to $99,999 | 7 | 25.0% |
| $100,000 to $149,999 | 0 | 0.0% |
| $150,000 to $199,999 | 0 | 0.0% |
| $200,000+ | 0 | 0.0% |
Household Income by Householder Age in Amanda Park
The median household income in Amanda Park is $41,000, with the highest median household income of $37,083 found in the 45 to 64 years age bracket for the primary householder. A total of 15 households (53.6%) fall into this category.
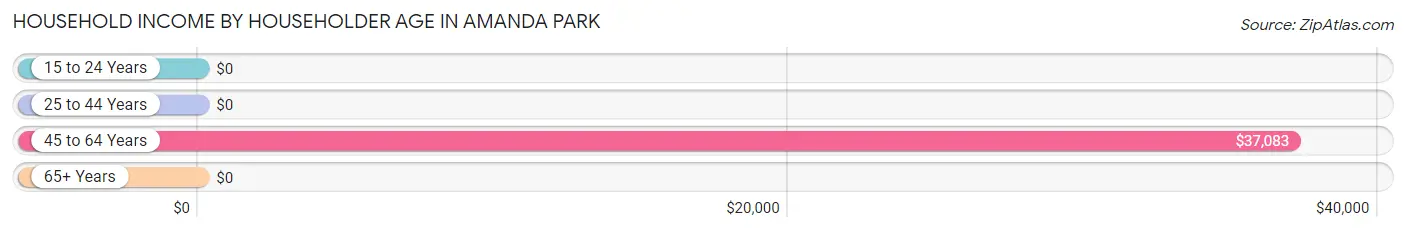
| Income Bracket | # Households | Median Income |
| 15 to 24 Years | 0 (0.0%) | $0 |
| 25 to 44 Years | 9 (32.1%) | $0 |
| 45 to 64 Years | 15 (53.6%) | $37,083 |
| 65+ Years | 4 (14.3%) | $0 |
| Total | 28 (100.0%) | $41,000 |
Poverty in Amanda Park
Income Below Poverty by Sex and Age in Amanda Park
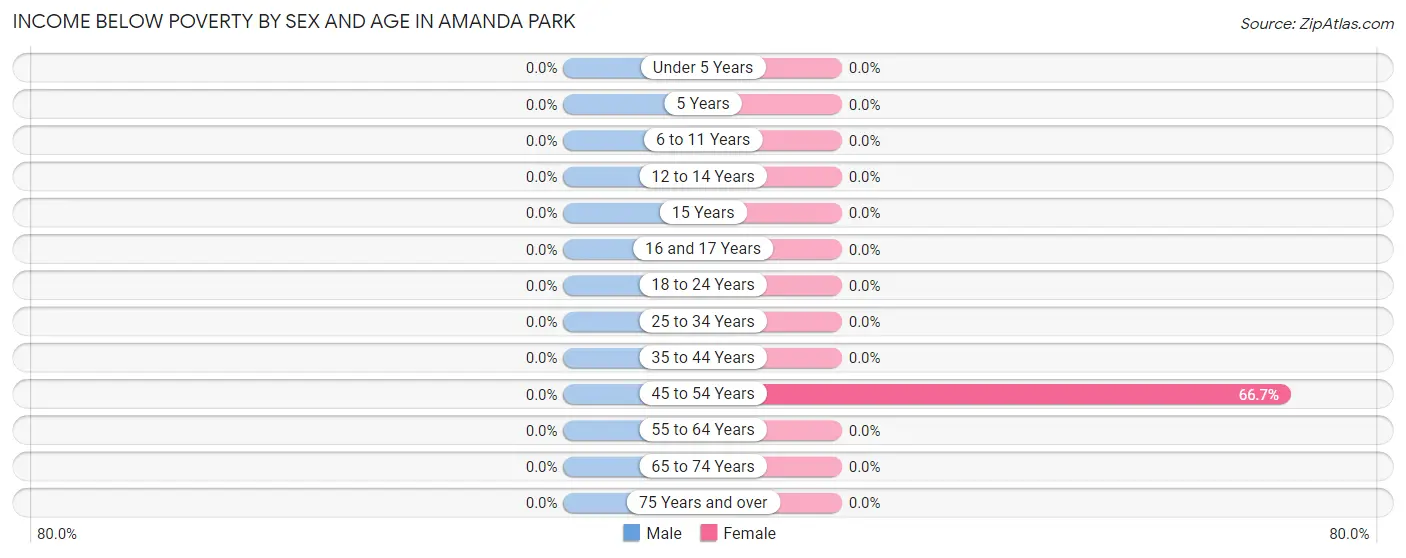
| Age Bracket | Male | Female |
| Under 5 Years | 0 (0.0%) | 0 (0.0%) |
| 5 Years | 0 (0.0%) | 0 (0.0%) |
| 6 to 11 Years | 0 (0.0%) | 0 (0.0%) |
| 12 to 14 Years | 0 (0.0%) | 0 (0.0%) |
| 15 Years | 0 (0.0%) | 0 (0.0%) |
| 16 and 17 Years | 0 (0.0%) | 0 (0.0%) |
| 18 to 24 Years | 0 (0.0%) | 0 (0.0%) |
| 25 to 34 Years | 0 (0.0%) | 0 (0.0%) |
| 35 to 44 Years | 0 (0.0%) | 0 (0.0%) |
| 45 to 54 Years | 0 (0.0%) | 4 (66.7%) |
| 55 to 64 Years | 0 (0.0%) | 0 (0.0%) |
| 65 to 74 Years | 0 (0.0%) | 0 (0.0%) |
| 75 Years and over | 0 (0.0%) | 0 (0.0%) |
| Total | 0 (0.0%) | 4 (11.8%) |
Income Above Poverty by Sex and Age in Amanda Park
According to the poverty statistics in Amanda Park, males aged 18 to 24 years and females aged 6 to 11 years are the age groups that are most secure financially, with 100.0% of males and 100.0% of females in these age groups living above the poverty line.
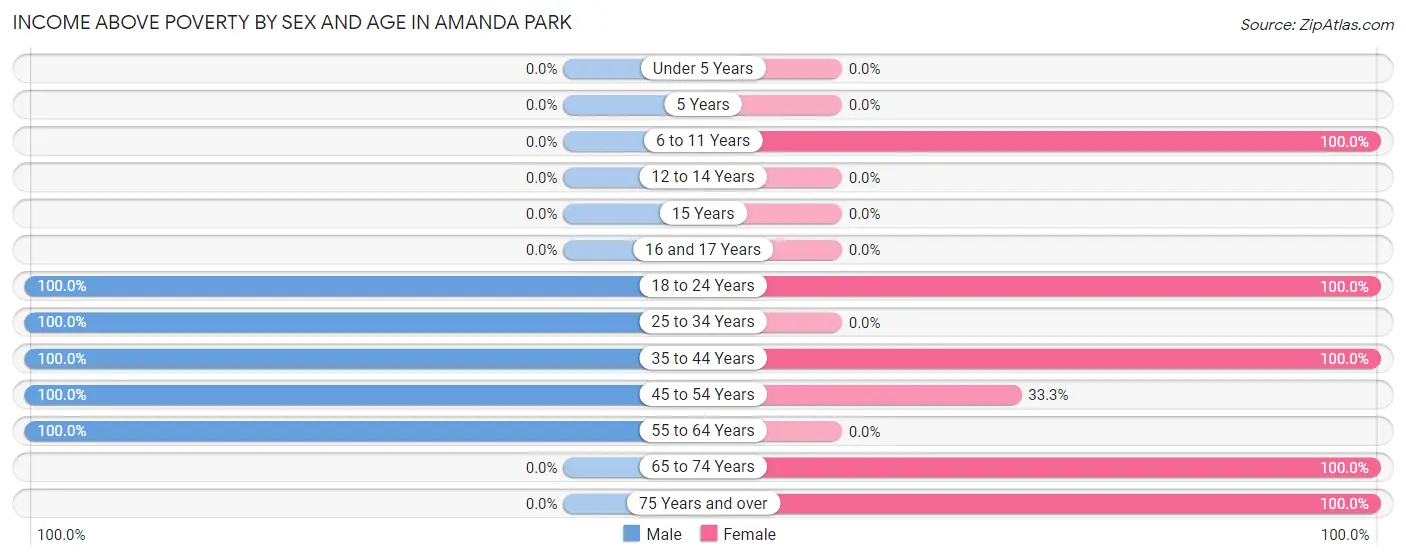
| Age Bracket | Male | Female |
| Under 5 Years | 0 (0.0%) | 0 (0.0%) |
| 5 Years | 0 (0.0%) | 0 (0.0%) |
| 6 to 11 Years | 0 (0.0%) | 10 (100.0%) |
| 12 to 14 Years | 0 (0.0%) | 0 (0.0%) |
| 15 Years | 0 (0.0%) | 0 (0.0%) |
| 16 and 17 Years | 0 (0.0%) | 0 (0.0%) |
| 18 to 24 Years | 11 (100.0%) | 9 (100.0%) |
| 25 to 34 Years | 8 (100.0%) | 0 (0.0%) |
| 35 to 44 Years | 5 (100.0%) | 5 (100.0%) |
| 45 to 54 Years | 3 (100.0%) | 2 (33.3%) |
| 55 to 64 Years | 10 (100.0%) | 0 (0.0%) |
| 65 to 74 Years | 0 (0.0%) | 1 (100.0%) |
| 75 Years and over | 0 (0.0%) | 3 (100.0%) |
| Total | 37 (100.0%) | 30 (88.2%) |
Income Below Poverty Among Married-Couple Families in Amanda Park
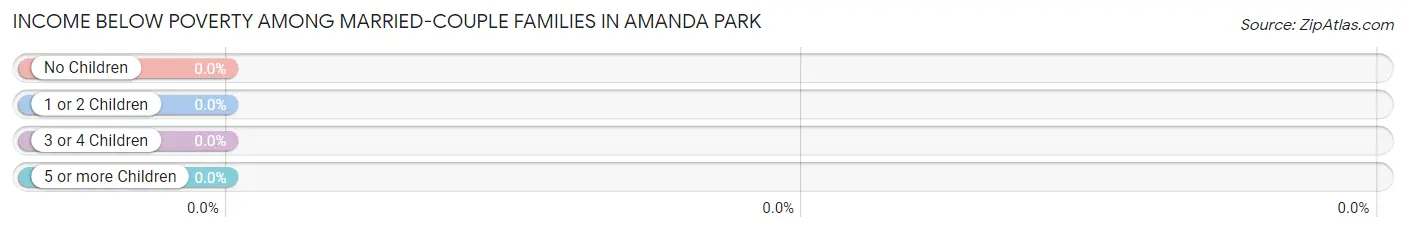
| Children | Above Poverty | Below Poverty |
| No Children | 0 (0.0%) | 0 (0.0%) |
| 1 or 2 Children | 5 (100.0%) | 0 (0.0%) |
| 3 or 4 Children | 0 (0.0%) | 0 (0.0%) |
| 5 or more Children | 0 (0.0%) | 0 (0.0%) |
| Total | 5 (100.0%) | 0 (0.0%) |
Income Below Poverty Among Single-Parent Households in Amanda Park
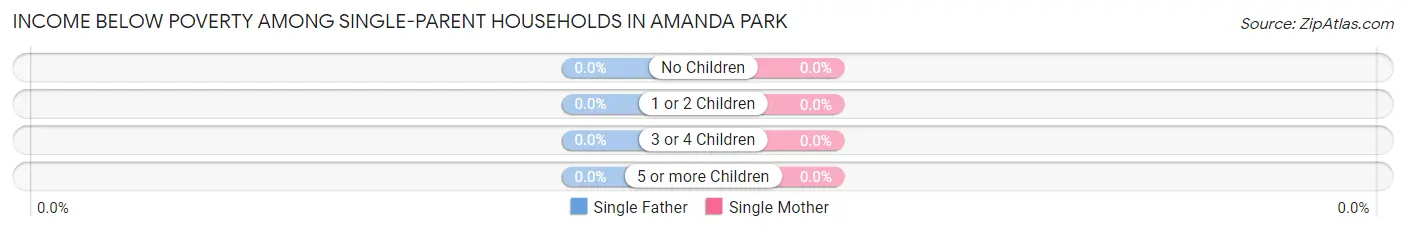
| Children | Single Father | Single Mother |
| No Children | 0 (0.0%) | 0 (0.0%) |
| 1 or 2 Children | 0 (0.0%) | 0 (0.0%) |
| 3 or 4 Children | 0 (0.0%) | 0 (0.0%) |
| 5 or more Children | 0 (0.0%) | 0 (0.0%) |
| Total | 0 (0.0%) | 0 (0.0%) |
Income Below Poverty Among Married-Couple vs Single-Parent Households in Amanda Park
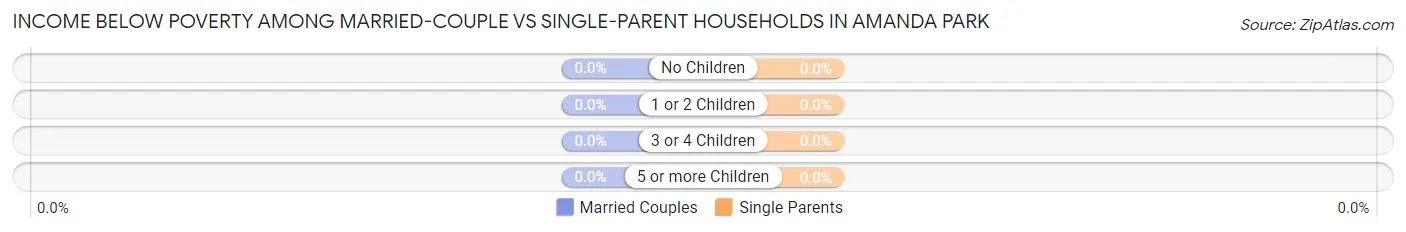
| Children | Married-Couple Families | Single-Parent Households |
| No Children | 0 (0.0%) | 0 (0.0%) |
| 1 or 2 Children | 0 (0.0%) | 0 (0.0%) |
| 3 or 4 Children | 0 (0.0%) | 0 (0.0%) |
| 5 or more Children | 0 (0.0%) | 0 (0.0%) |
| Total | 0 (0.0%) | 0 (0.0%) |
Race in Amanda Park
The most populous races in Amanda Park are White / Caucasian (43 | 60.6%), Native / Alaskan (21 | 29.6%), and Hispanic or Latino (7 | 9.9%).
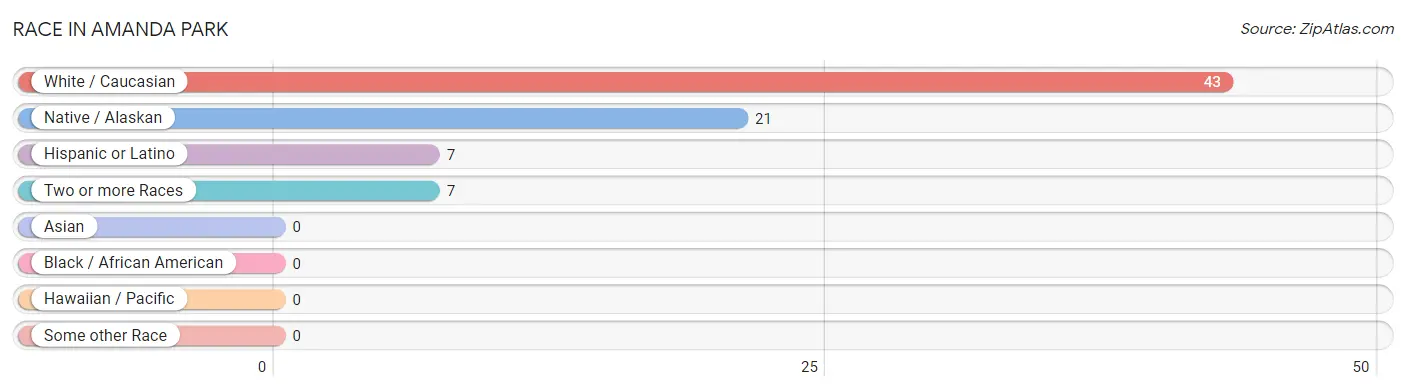
| Race | # Population | % Population |
| Asian | 0 | 0.0% |
| Black / African American | 0 | 0.0% |
| Hawaiian / Pacific | 0 | 0.0% |
| Hispanic or Latino | 7 | 9.9% |
| Native / Alaskan | 21 | 29.6% |
| White / Caucasian | 43 | 60.6% |
| Two or more Races | 7 | 9.9% |
| Some other Race | 0 | 0.0% |
| Total | 71 | 100.0% |
Ancestry in Amanda Park
The most populous ancestries reported in Amanda Park are Mexican (7 | 9.9%), English (6 | 8.5%), Norwegian (5 | 7.0%), Welsh (5 | 7.0%), and Dutch (4 | 5.6%), together accounting for 38.0% of all Amanda Park residents.
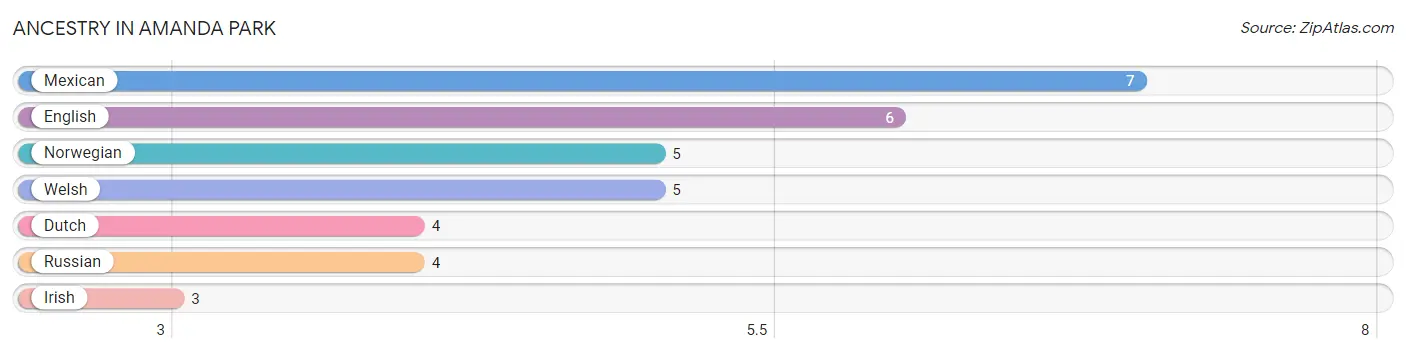
| Ancestry | # Population | % Population |
| Dutch | 4 | 5.6% |
| English | 6 | 8.5% |
| Irish | 3 | 4.2% |
| Mexican | 7 | 9.9% |
| Norwegian | 5 | 7.0% |
| Russian | 4 | 5.6% |
| Welsh | 5 | 7.0% | View All 7 Rows |
Immigrants in Amanda Park
The most numerous immigrant groups reported in Amanda Park came from Central America (3 | 4.2%), Latin America (3 | 4.2%), and Mexico (3 | 4.2%), together accounting for 12.7% of all Amanda Park residents.
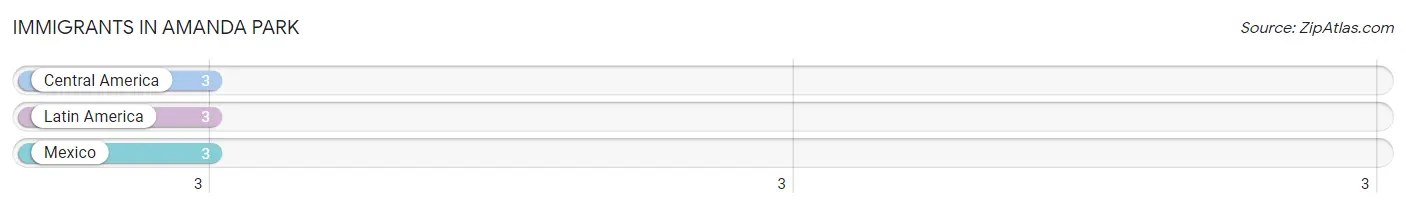
| Immigration Origin | # Population | % Population |
| Central America | 3 | 4.2% |
| Latin America | 3 | 4.2% |
| Mexico | 3 | 4.2% | View All 3 Rows |
Sex and Age in Amanda Park
Sex and Age in Amanda Park
The most populous age groups in Amanda Park are 20 to 24 Years (11 | 29.7%) for men and 20 to 24 Years (9 | 26.5%) for women.
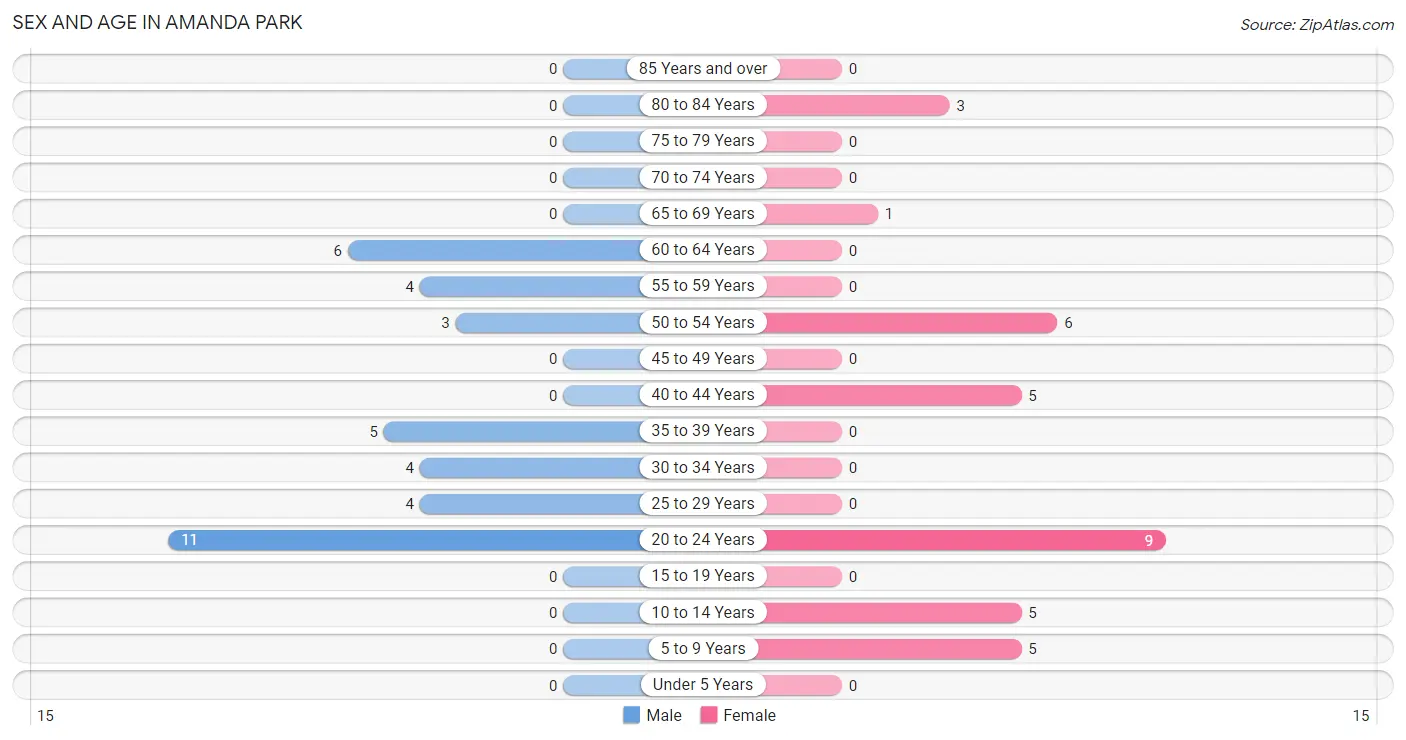
| Age Bracket | Male | Female |
| Under 5 Years | 0 (0.0%) | 0 (0.0%) |
| 5 to 9 Years | 0 (0.0%) | 5 (14.7%) |
| 10 to 14 Years | 0 (0.0%) | 5 (14.7%) |
| 15 to 19 Years | 0 (0.0%) | 0 (0.0%) |
| 20 to 24 Years | 11 (29.7%) | 9 (26.5%) |
| 25 to 29 Years | 4 (10.8%) | 0 (0.0%) |
| 30 to 34 Years | 4 (10.8%) | 0 (0.0%) |
| 35 to 39 Years | 5 (13.5%) | 0 (0.0%) |
| 40 to 44 Years | 0 (0.0%) | 5 (14.7%) |
| 45 to 49 Years | 0 (0.0%) | 0 (0.0%) |
| 50 to 54 Years | 3 (8.1%) | 6 (17.6%) |
| 55 to 59 Years | 4 (10.8%) | 0 (0.0%) |
| 60 to 64 Years | 6 (16.2%) | 0 (0.0%) |
| 65 to 69 Years | 0 (0.0%) | 1 (2.9%) |
| 70 to 74 Years | 0 (0.0%) | 0 (0.0%) |
| 75 to 79 Years | 0 (0.0%) | 0 (0.0%) |
| 80 to 84 Years | 0 (0.0%) | 3 (8.8%) |
| 85 Years and over | 0 (0.0%) | 0 (0.0%) |
| Total | 37 (100.0%) | 34 (100.0%) |
Families and Households in Amanda Park
Median Family Size in Amanda Park
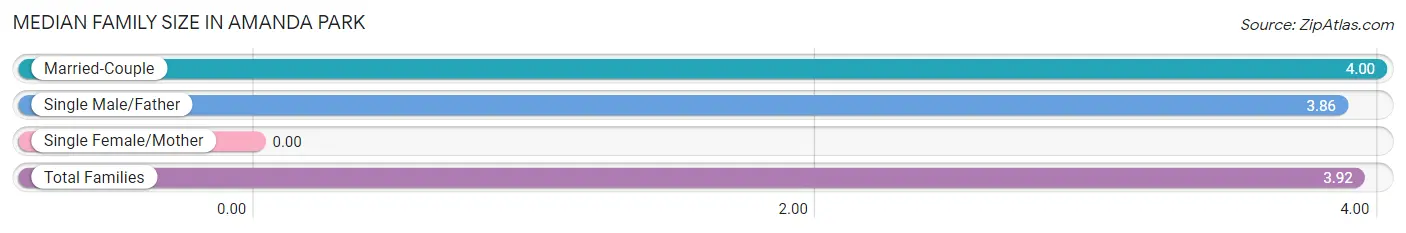
| Family Type | # Families | Family Size |
| Married-Couple | 5 (41.7%) | 4.00 |
| Single Male/Father | 7 (58.3%) | 3.86 |
| Single Female/Mother | 0 (0.0%) | - |
| Total Families | 12 (100.0%) | 3.92 |
Median Household Size in Amanda Park
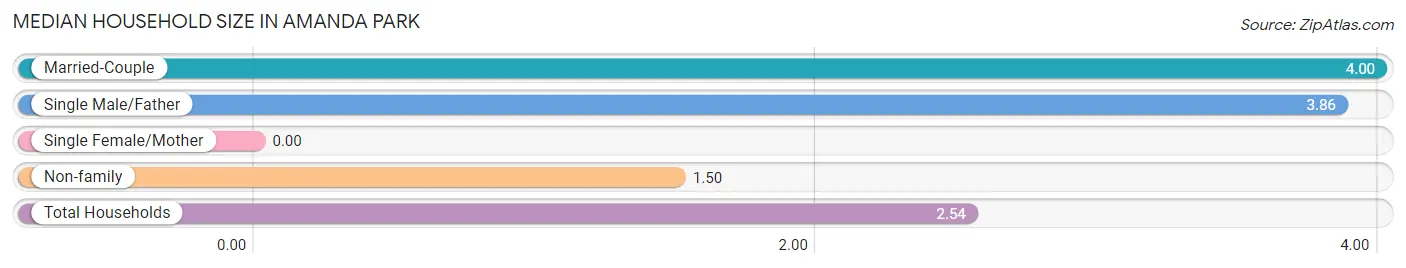
| Household Type | # Households | Household Size |
| Married-Couple | 5 (17.9%) | 4.00 |
| Single Male/Father | 7 (25.0%) | 3.86 |
| Single Female/Mother | 0 (0.0%) | - |
| Non-family | 16 (57.1%) | 1.50 |
| Total Households | 28 (100.0%) | 2.54 |
Household Size by Marriage Status in Amanda Park
Out of a total of 28 households in Amanda Park, 12 (42.9%) are family households, while 16 (57.1%) are nonfamily households. The most numerous type of family households are 4-person households, comprising 5, and the most common type of nonfamily households are 1-person households, comprising 9.
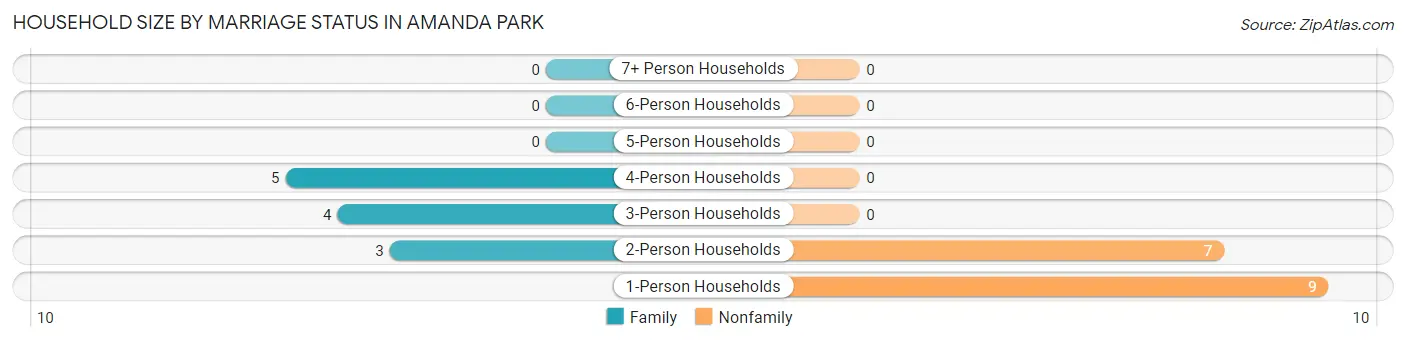
| Household Size | Family Households | Nonfamily Households |
| 1-Person Households | - | 9 (32.1%) |
| 2-Person Households | 3 (10.7%) | 7 (25.0%) |
| 3-Person Households | 4 (14.3%) | 0 (0.0%) |
| 4-Person Households | 5 (17.9%) | 0 (0.0%) |
| 5-Person Households | 0 (0.0%) | 0 (0.0%) |
| 6-Person Households | 0 (0.0%) | 0 (0.0%) |
| 7+ Person Households | 0 (0.0%) | 0 (0.0%) |
| Total | 12 (42.9%) | 16 (57.1%) |
Female Fertility in Amanda Park
Fertility by Age in Amanda Park
| Age Bracket | Women with Births | Births / 1,000 Women |
| 15 to 19 years | 0 (0.0%) | 0.0 |
| 20 to 34 years | 0 (0.0%) | 0.0 |
| 35 to 50 years | 0 (0.0%) | 0.0 |
| Total | 0 (0.0%) | 0.0 |
Fertility by Age by Marriage Status in Amanda Park
| Age Bracket | Married | Unmarried |
| 15 to 19 years | 0 (0.0%) | 0 (0.0%) |
| 20 to 34 years | 0 (0.0%) | 0 (0.0%) |
| 35 to 50 years | 0 (0.0%) | 0 (0.0%) |
| Total | 0 (0.0%) | 0 (0.0%) |
Fertility by Education in Amanda Park
| Educational Attainment | Women with Births | Births / 1,000 Women |
| Less than High School | 0 (0.0%) | 0.0 |
| High School Diploma | 0 (0.0%) | 0.0 |
| College or Associate's Degree | 0 (0.0%) | 0.0 |
| Bachelor's Degree | 0 (0.0%) | 0.0 |
| Graduate Degree | 0 (0.0%) | 0.0 |
| Total | 0 (0.0%) | 0.0 |
Fertility by Education by Marriage Status in Amanda Park
| Educational Attainment | Married | Unmarried |
| Less than High School | 0 (0.0%) | 0 (0.0%) |
| High School Diploma | 0 (0.0%) | 0 (0.0%) |
| College or Associate's Degree | 0 (0.0%) | 0 (0.0%) |
| Bachelor's Degree | 0 (0.0%) | 0 (0.0%) |
| Graduate Degree | 0 (0.0%) | 0 (0.0%) |
| Total | 0 (0.0%) | 0 (0.0%) |
Employment Characteristics in Amanda Park
Employment by Class of Employer in Amanda Park
Among the 24 employed individuals in Amanda Park, private company employees (12 | 50.0%), self-employed (not incorporated) (5 | 20.8%), and state government employees (4 | 16.7%) make up the most common classes of employment.
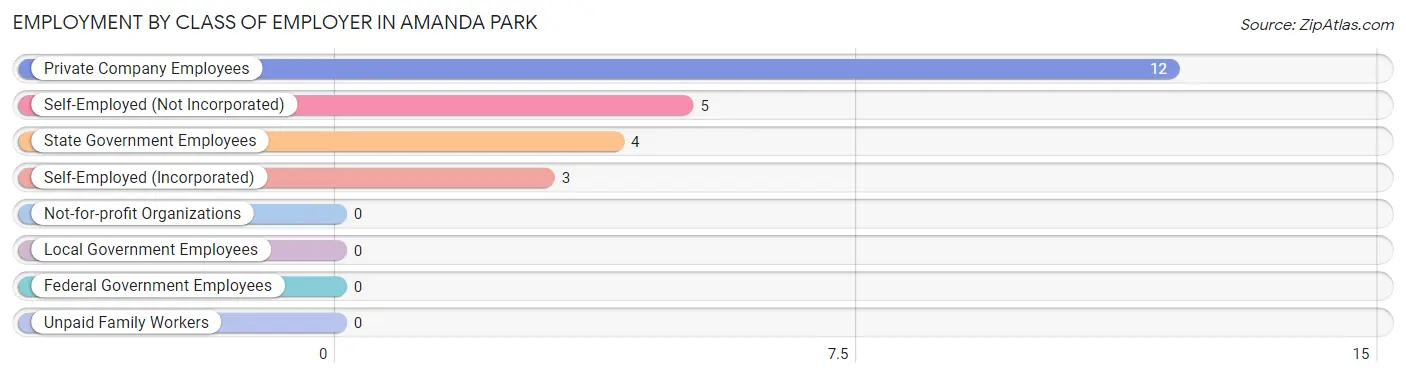
| Employer Class | # Employees | % Employees |
| Private Company Employees | 12 | 50.0% |
| Self-Employed (Incorporated) | 3 | 12.5% |
| Self-Employed (Not Incorporated) | 5 | 20.8% |
| Not-for-profit Organizations | 0 | 0.0% |
| Local Government Employees | 0 | 0.0% |
| State Government Employees | 4 | 16.7% |
| Federal Government Employees | 0 | 0.0% |
| Unpaid Family Workers | 0 | 0.0% |
| Total | 24 | 100.0% |
Employment Status by Age in Amanda Park
According to the labor force statistics for Amanda Park, out of the total population over 16 years of age (61), 72.1% or 44 individuals are in the labor force, with 45.5% or 20 of them unemployed. The age group with the highest labor force participation rate is 20 to 24 years, with 100.0% or 20 individuals in the labor force. Within the labor force, the 20 to 24 years age range has the highest percentage of unemployed individuals, with 80.0% or 16 of them being unemployed.
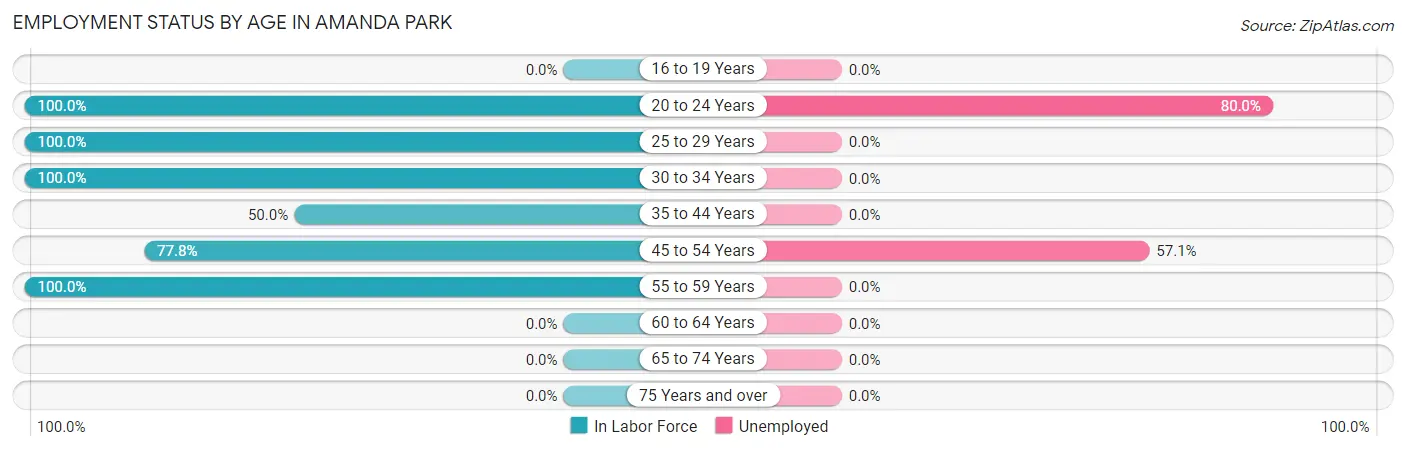
| Age Bracket | In Labor Force | Unemployed |
| 16 to 19 Years | 0 (0.0%) | 0 (0.0%) |
| 20 to 24 Years | 20 (100.0%) | 16 (80.0%) |
| 25 to 29 Years | 4 (100.0%) | 0 (0.0%) |
| 30 to 34 Years | 4 (100.0%) | 0 (0.0%) |
| 35 to 44 Years | 5 (50.0%) | 0 (0.0%) |
| 45 to 54 Years | 7 (77.8%) | 4 (57.1%) |
| 55 to 59 Years | 4 (100.0%) | 0 (0.0%) |
| 60 to 64 Years | 0 (0.0%) | 0 (0.0%) |
| 65 to 74 Years | 0 (0.0%) | 0 (0.0%) |
| 75 Years and over | 0 (0.0%) | 0 (0.0%) |
| Total | 44 (72.1%) | 20 (45.5%) |
Employment Status by Educational Attainment in Amanda Park
According to labor force statistics for Amanda Park, 64.9% of individuals (24) out of the total population between 25 and 64 years of age (37) are in the labor force, with 16.7% or 4 of them being unemployed. The group with the highest labor force participation rate are those with the educational attainment of high school diploma, with 72.7% or 8 individuals in the labor force. Within the labor force, individuals with college / associate degree education have the highest percentage of unemployment, with 30.8% or 4 of them being unemployed.
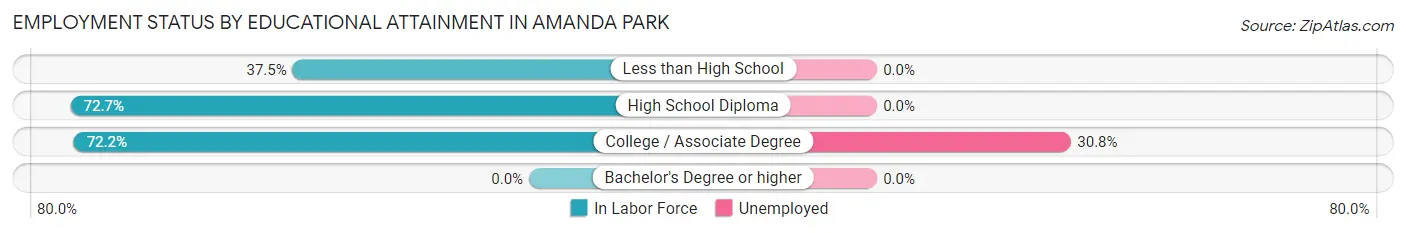
| Educational Attainment | In Labor Force | Unemployed |
| Less than High School | 3 (37.5%) | 0 (0.0%) |
| High School Diploma | 8 (72.7%) | 0 (0.0%) |
| College / Associate Degree | 13 (72.2%) | 6 (30.8%) |
| Bachelor's Degree or higher | 0 (0.0%) | 0 (0.0%) |
| Total | 24 (64.9%) | 6 (16.7%) |
Employment Occupations by Sex in Amanda Park
Management, Business, Science and Arts Occupations
The most common Management, Business, Science and Arts occupations in Amanda Park are Community & Social Service (4 | 16.7%), Education Instruction & Library (4 | 16.7%), and Management (3 | 12.5%).
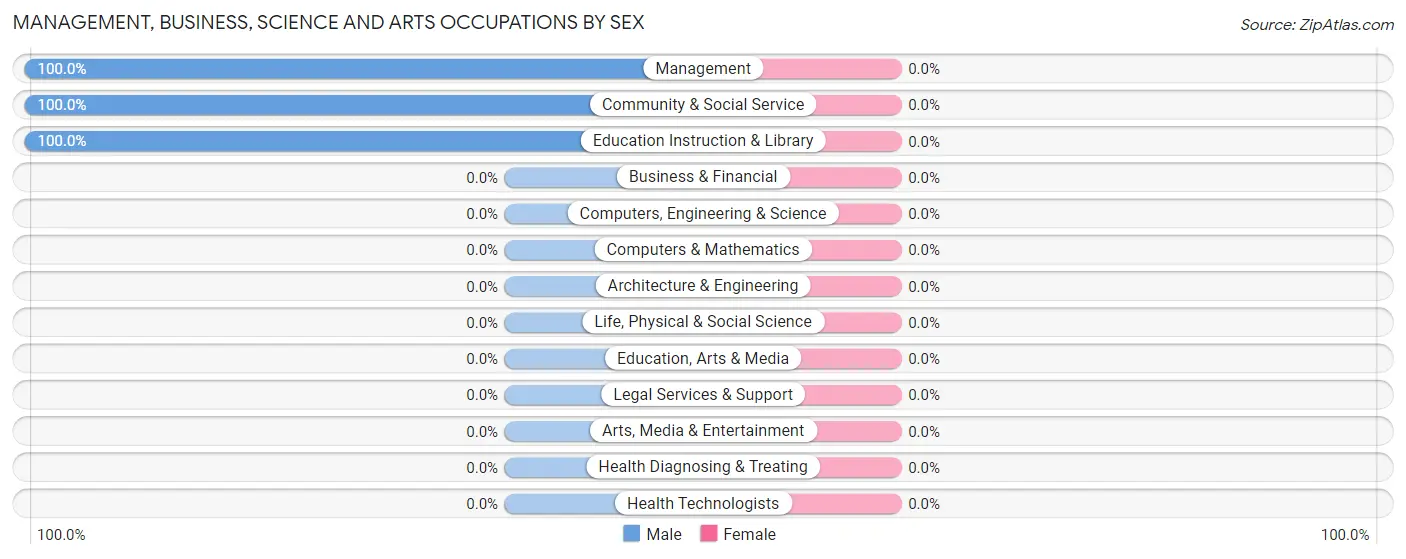
Management, Business, Science and Arts Occupations by Sex
| Occupation | Male | Female |
| Management | 3 (100.0%) | 0 (0.0%) |
| Business & Financial | 0 (0.0%) | 0 (0.0%) |
| Computers, Engineering & Science | 0 (0.0%) | 0 (0.0%) |
| Computers & Mathematics | 0 (0.0%) | 0 (0.0%) |
| Architecture & Engineering | 0 (0.0%) | 0 (0.0%) |
| Life, Physical & Social Science | 0 (0.0%) | 0 (0.0%) |
| Community & Social Service | 4 (100.0%) | 0 (0.0%) |
| Education, Arts & Media | 0 (0.0%) | 0 (0.0%) |
| Legal Services & Support | 0 (0.0%) | 0 (0.0%) |
| Education Instruction & Library | 4 (100.0%) | 0 (0.0%) |
| Arts, Media & Entertainment | 0 (0.0%) | 0 (0.0%) |
| Health Diagnosing & Treating | 0 (0.0%) | 0 (0.0%) |
| Health Technologists | 0 (0.0%) | 0 (0.0%) |
| Total (Category) | 7 (100.0%) | 0 (0.0%) |
| Total (Overall) | 24 (100.0%) | 0 (0.0%) |
Services Occupations
The most common Services occupations in Amanda Park are Cleaning & Maintenance (9 | 37.5%), and Food Preparation & Serving (4 | 16.7%).
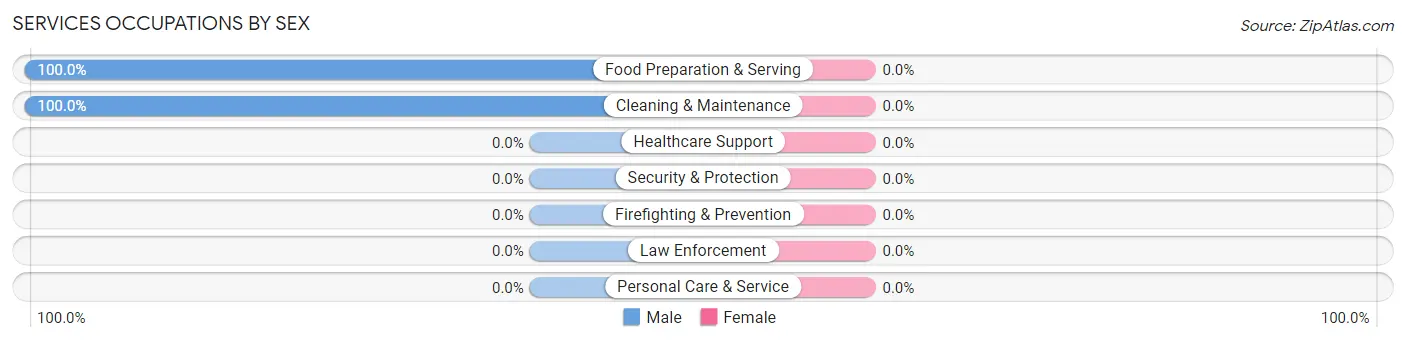
Services Occupations by Sex
| Occupation | Male | Female |
| Healthcare Support | 0 (0.0%) | 0 (0.0%) |
| Security & Protection | 0 (0.0%) | 0 (0.0%) |
| Firefighting & Prevention | 0 (0.0%) | 0 (0.0%) |
| Law Enforcement | 0 (0.0%) | 0 (0.0%) |
| Food Preparation & Serving | 4 (100.0%) | 0 (0.0%) |
| Cleaning & Maintenance | 9 (100.0%) | 0 (0.0%) |
| Personal Care & Service | 0 (0.0%) | 0 (0.0%) |
| Total (Category) | 13 (100.0%) | 0 (0.0%) |
| Total (Overall) | 24 (100.0%) | 0 (0.0%) |
Sales and Office Occupations
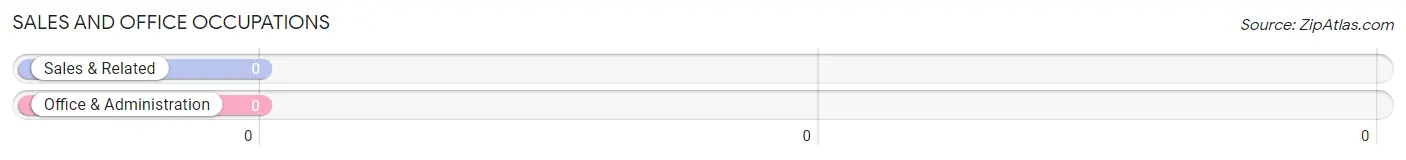
Sales and Office Occupations by Sex
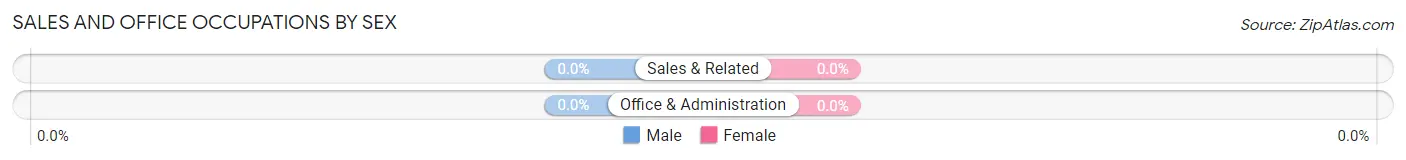
| Occupation | Male | Female |
| Sales & Related | 0 (0.0%) | 0 (0.0%) |
| Office & Administration | 0 (0.0%) | 0 (0.0%) |
| Total (Category) | 0 (0.0%) | 0 (0.0%) |
| Total (Overall) | 24 (100.0%) | 0 (0.0%) |
Natural Resources, Construction and Maintenance Occupations
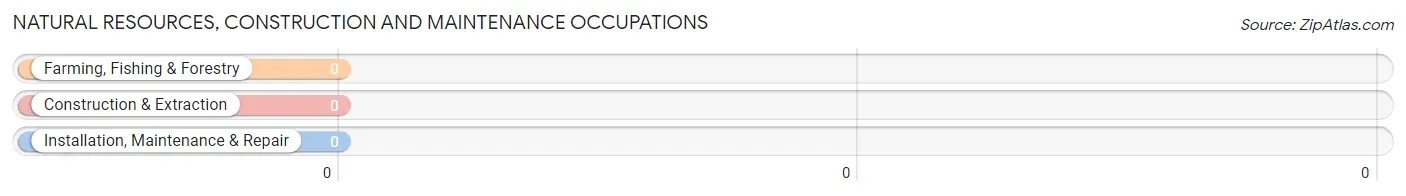
Natural Resources, Construction and Maintenance Occupations by Sex
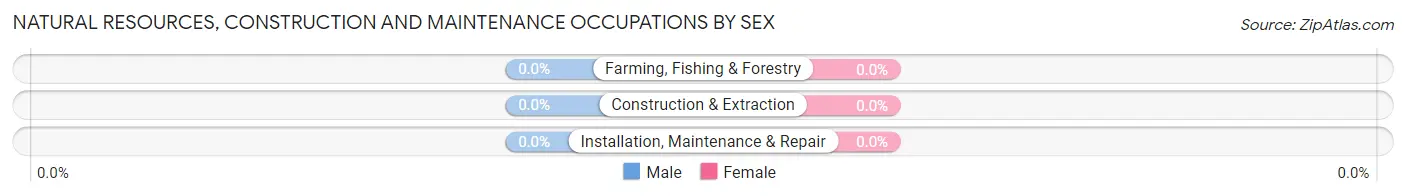
| Occupation | Male | Female |
| Farming, Fishing & Forestry | 0 (0.0%) | 0 (0.0%) |
| Construction & Extraction | 0 (0.0%) | 0 (0.0%) |
| Installation, Maintenance & Repair | 0 (0.0%) | 0 (0.0%) |
| Total (Category) | 0 (0.0%) | 0 (0.0%) |
| Total (Overall) | 24 (100.0%) | 0 (0.0%) |
Production, Transportation and Moving Occupations
The most common Production, Transportation and Moving occupations in Amanda Park are , and Production (4 | 16.7%).
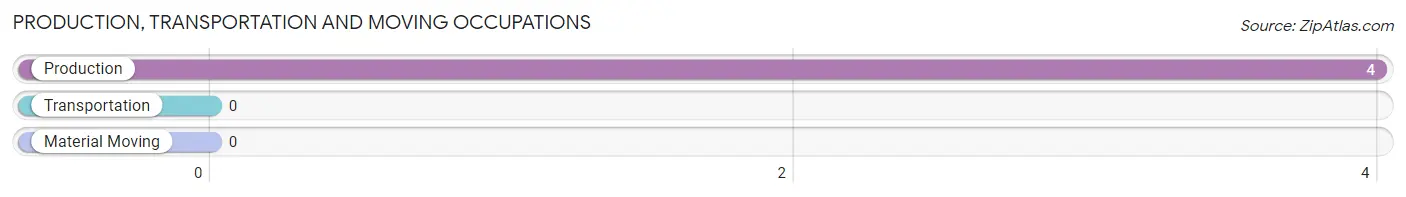
Production, Transportation and Moving Occupations by Sex
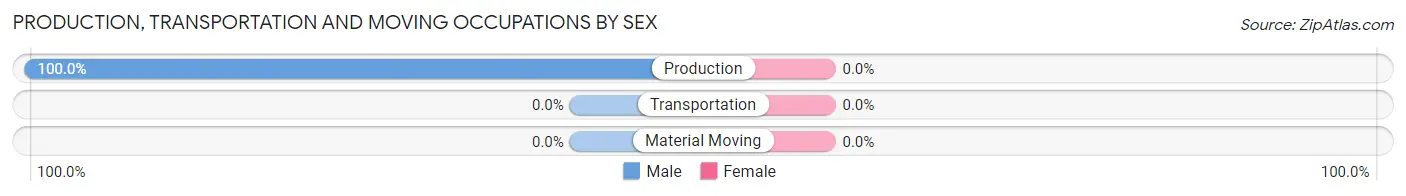
| Occupation | Male | Female |
| Production | 4 (100.0%) | 0 (0.0%) |
| Transportation | 0 (0.0%) | 0 (0.0%) |
| Material Moving | 0 (0.0%) | 0 (0.0%) |
| Total (Category) | 4 (100.0%) | 0 (0.0%) |
| Total (Overall) | 24 (100.0%) | 0 (0.0%) |
Employment Industries by Sex in Amanda Park
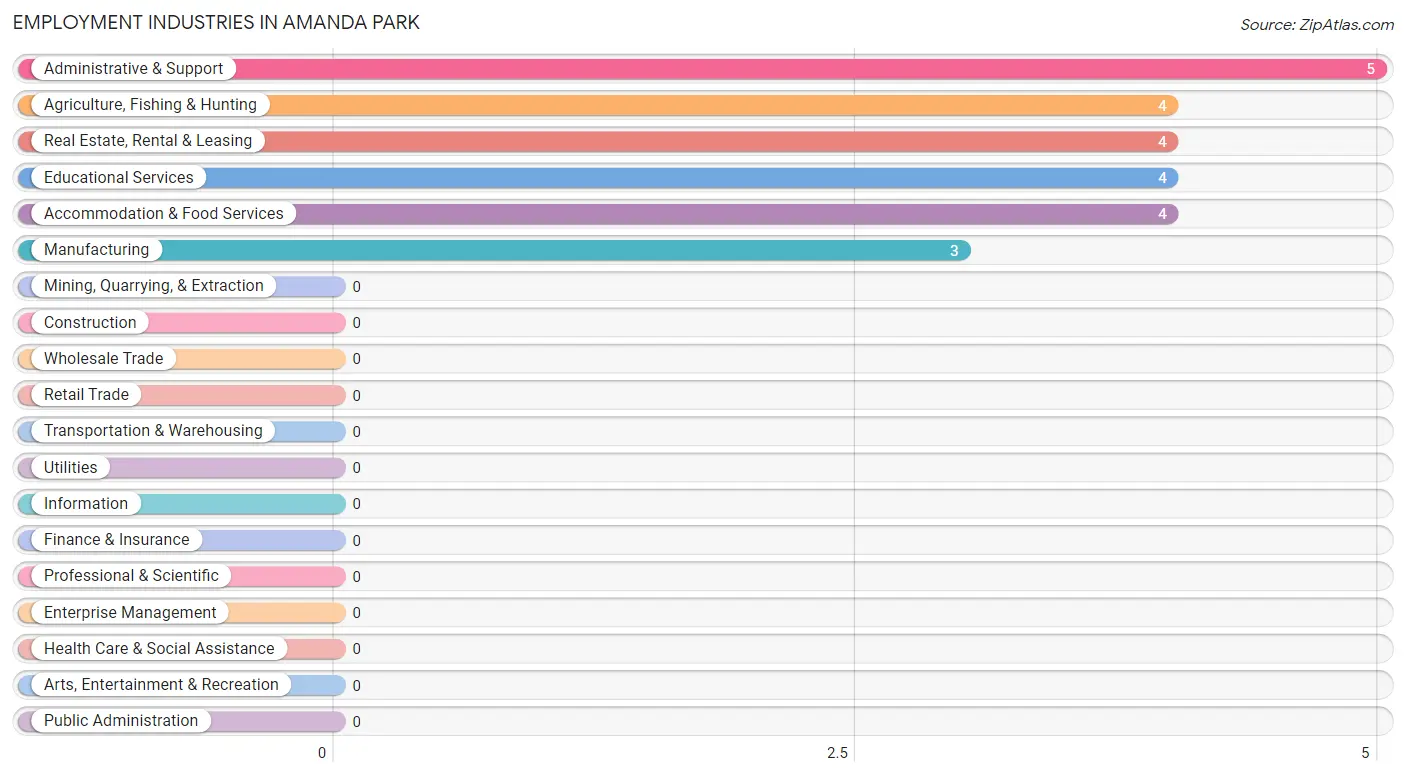
Employment Industries in Amanda Park
The major employment industries in Amanda Park include Administrative & Support (5 | 20.8%), Agriculture, Fishing & Hunting (4 | 16.7%), Real Estate, Rental & Leasing (4 | 16.7%), Educational Services (4 | 16.7%), and Accommodation & Food Services (4 | 16.7%).
Employment Industries by Sex in Amanda Park
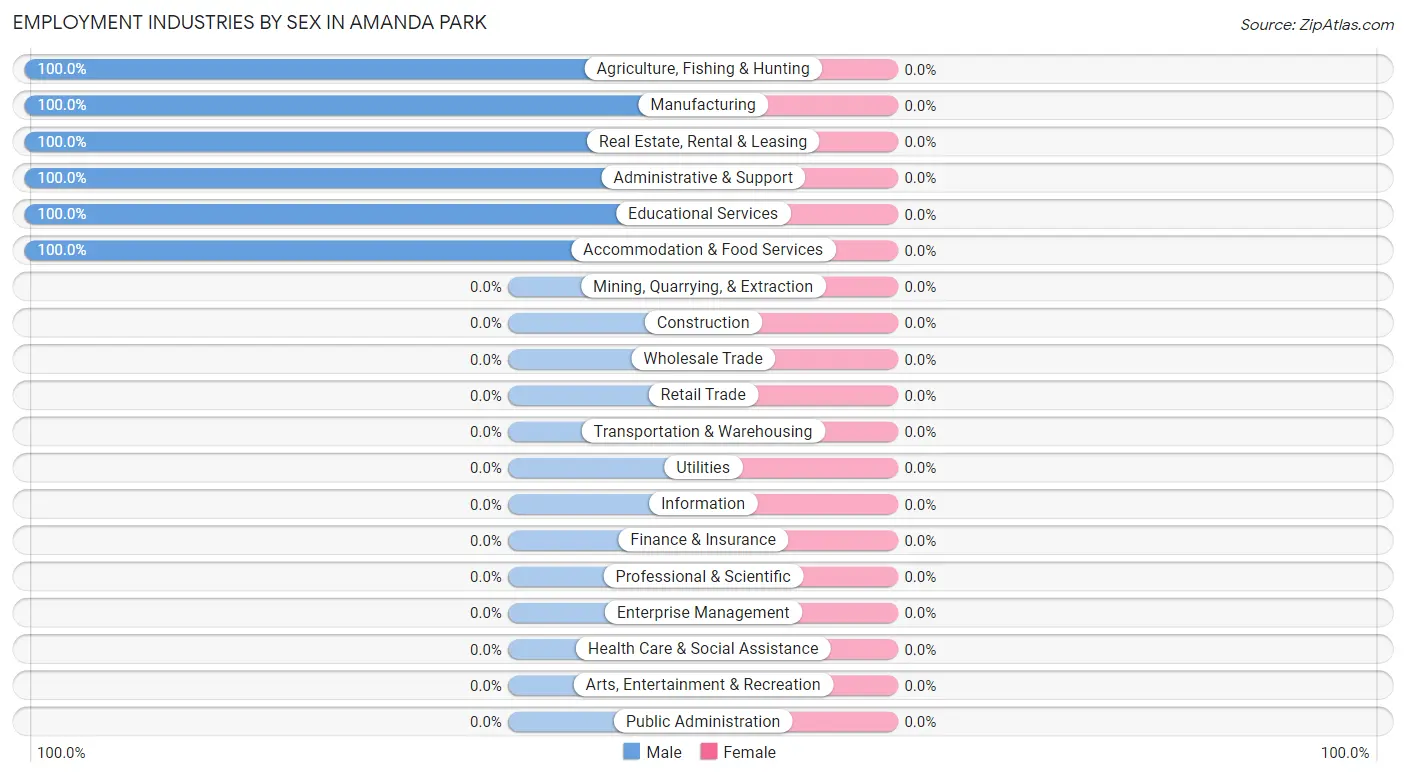
| Industry | Male | Female |
| Agriculture, Fishing & Hunting | 4 (100.0%) | 0 (0.0%) |
| Mining, Quarrying, & Extraction | 0 (0.0%) | 0 (0.0%) |
| Construction | 0 (0.0%) | 0 (0.0%) |
| Manufacturing | 3 (100.0%) | 0 (0.0%) |
| Wholesale Trade | 0 (0.0%) | 0 (0.0%) |
| Retail Trade | 0 (0.0%) | 0 (0.0%) |
| Transportation & Warehousing | 0 (0.0%) | 0 (0.0%) |
| Utilities | 0 (0.0%) | 0 (0.0%) |
| Information | 0 (0.0%) | 0 (0.0%) |
| Finance & Insurance | 0 (0.0%) | 0 (0.0%) |
| Real Estate, Rental & Leasing | 4 (100.0%) | 0 (0.0%) |
| Professional & Scientific | 0 (0.0%) | 0 (0.0%) |
| Enterprise Management | 0 (0.0%) | 0 (0.0%) |
| Administrative & Support | 5 (100.0%) | 0 (0.0%) |
| Educational Services | 4 (100.0%) | 0 (0.0%) |
| Health Care & Social Assistance | 0 (0.0%) | 0 (0.0%) |
| Arts, Entertainment & Recreation | 0 (0.0%) | 0 (0.0%) |
| Accommodation & Food Services | 4 (100.0%) | 0 (0.0%) |
| Public Administration | 0 (0.0%) | 0 (0.0%) |
| Total | 24 (100.0%) | 0 (0.0%) |
Education in Amanda Park
School Enrollment in Amanda Park
The most common levels of schooling among the 10 students in Amanda Park are elementary school (5 | 50.0%), and middle school (5 | 50.0%).
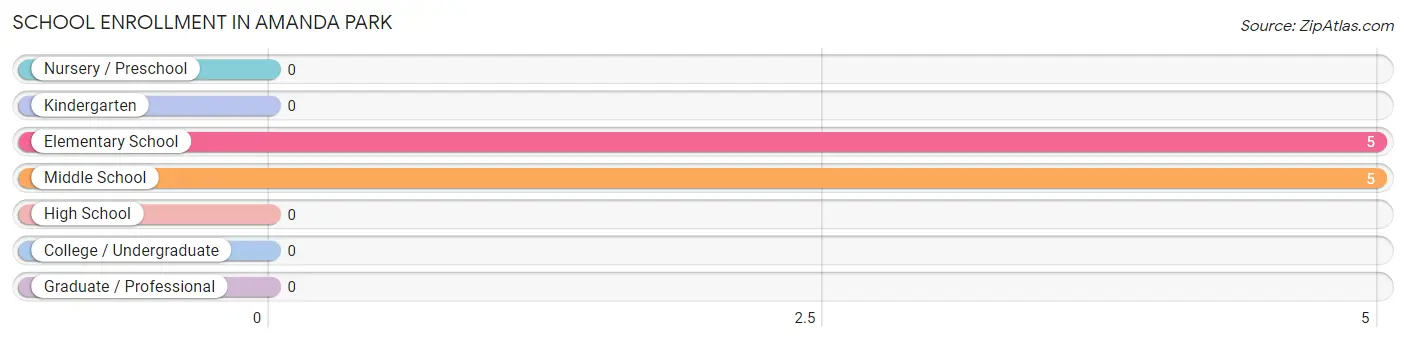
| School Level | # Students | % Students |
| Nursery / Preschool | 0 | 0.0% |
| Kindergarten | 0 | 0.0% |
| Elementary School | 5 | 50.0% |
| Middle School | 5 | 50.0% |
| High School | 0 | 0.0% |
| College / Undergraduate | 0 | 0.0% |
| Graduate / Professional | 0 | 0.0% |
| Total | 10 | 100.0% |
School Enrollment by Age by Funding Source in Amanda Park
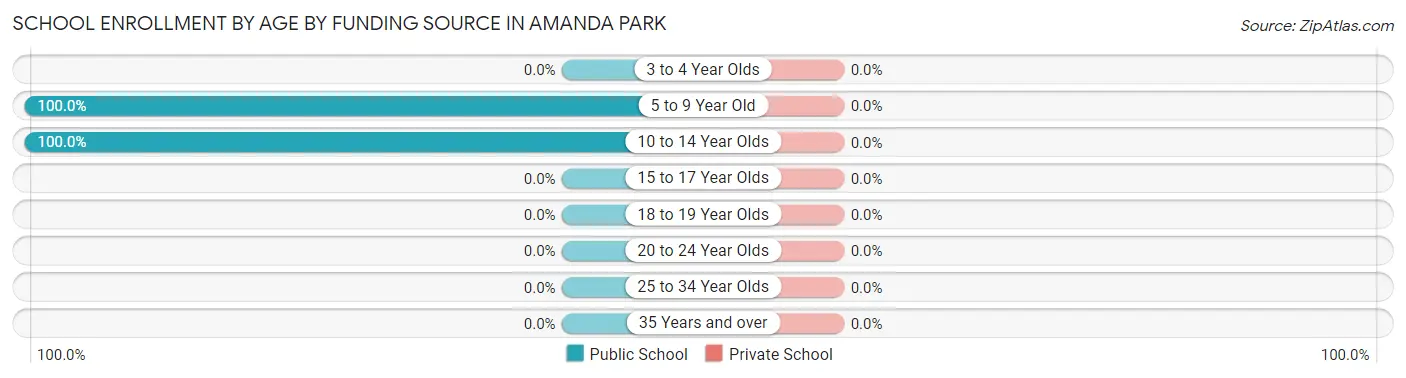
| Age Bracket | Public School | Private School |
| 3 to 4 Year Olds | 0 (0.0%) | 0 (0.0%) |
| 5 to 9 Year Old | 5 (100.0%) | 0 (0.0%) |
| 10 to 14 Year Olds | 5 (100.0%) | 0 (0.0%) |
| 15 to 17 Year Olds | 0 (0.0%) | 0 (0.0%) |
| 18 to 19 Year Olds | 0 (0.0%) | 0 (0.0%) |
| 20 to 24 Year Olds | 0 (0.0%) | 0 (0.0%) |
| 25 to 34 Year Olds | 0 (0.0%) | 0 (0.0%) |
| 35 Years and over | 0 (0.0%) | 0 (0.0%) |
| Total | 10 (100.0%) | 0 (0.0%) |
Educational Attainment by Field of Study in Amanda Park
| Field of Study | # Graduates | % Graduates |
| Computers & Mathematics | 0 | 0.0% |
| Bio, Nature & Agricultural | 0 | 0.0% |
| Physical & Health Sciences | 0 | 0.0% |
| Psychology | 0 | 0.0% |
| Social Sciences | 0 | 0.0% |
| Engineering | 0 | 0.0% |
| Multidisciplinary Studies | 0 | 0.0% |
| Science & Technology | 0 | 0.0% |
| Business | 0 | 0.0% |
| Education | 0 | 0.0% |
| Literature & Languages | 0 | 0.0% |
| Liberal Arts & History | 0 | 0.0% |
| Visual & Performing Arts | 0 | 0.0% |
| Communications | 0 | 0.0% |
| Arts & Humanities | 0 | 0.0% |
| Total | 0 | 0.0% |
Transportation & Commute in Amanda Park
Vehicle Availability by Sex in Amanda Park
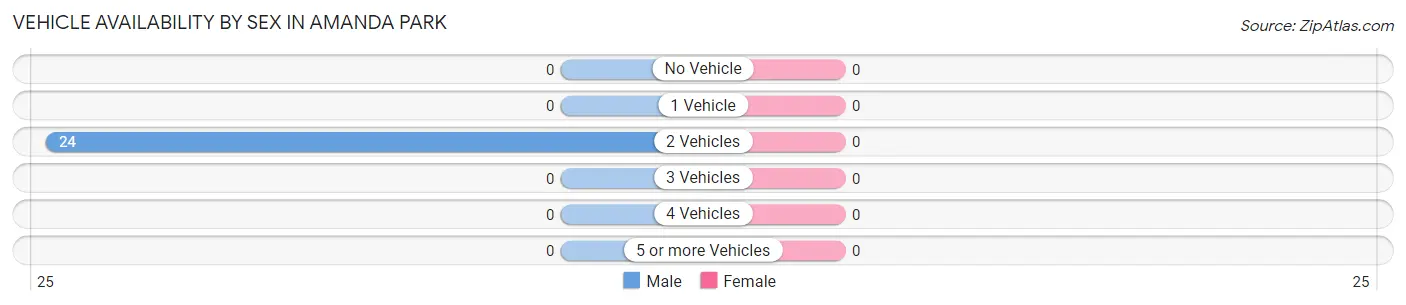
| Vehicles Available | Male | Female |
| No Vehicle | 0 (0.0%) | 0 (0.0%) |
| 1 Vehicle | 0 (0.0%) | 0 (0.0%) |
| 2 Vehicles | 24 (100.0%) | 0 (0.0%) |
| 3 Vehicles | 0 (0.0%) | 0 (0.0%) |
| 4 Vehicles | 0 (0.0%) | 0 (0.0%) |
| 5 or more Vehicles | 0 (0.0%) | 0 (0.0%) |
| Total | 24 (100.0%) | 0 (0.0%) |
Commute Time in Amanda Park
The most frequently occuring commute durations in Amanda Park are less than 5 minutes (9 commuters, 52.9%), 10 to 14 minutes (4 commuters, 23.5%), and 45 to 59 minutes (4 commuters, 23.5%).
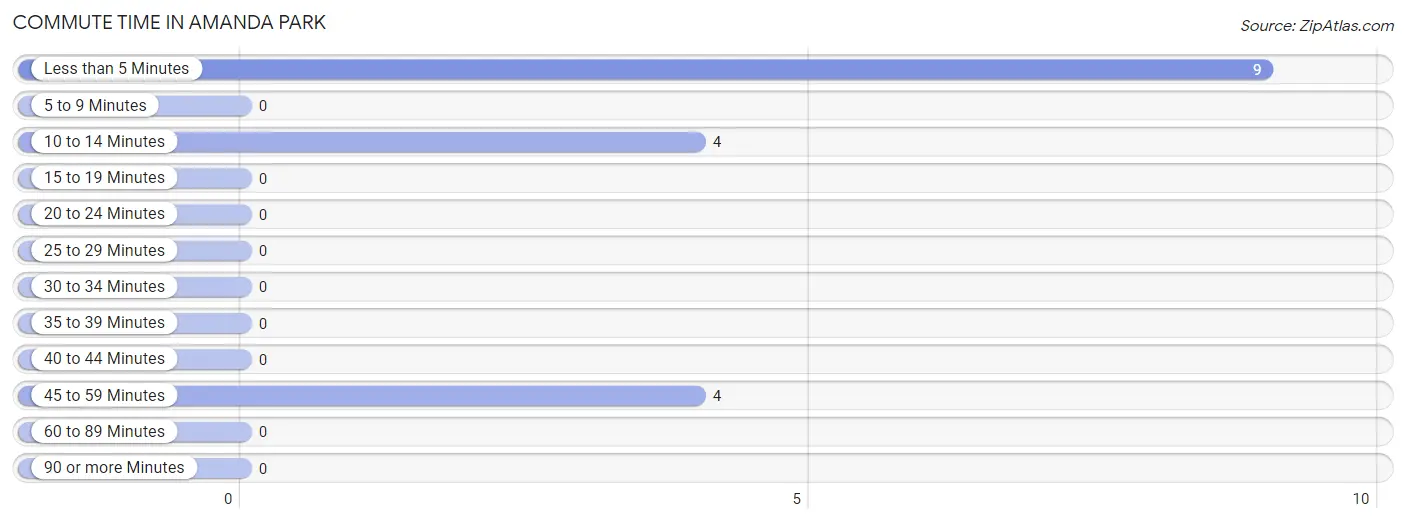
| Commute Time | # Commuters | % Commuters |
| Less than 5 Minutes | 9 | 52.9% |
| 5 to 9 Minutes | 0 | 0.0% |
| 10 to 14 Minutes | 4 | 23.5% |
| 15 to 19 Minutes | 0 | 0.0% |
| 20 to 24 Minutes | 0 | 0.0% |
| 25 to 29 Minutes | 0 | 0.0% |
| 30 to 34 Minutes | 0 | 0.0% |
| 35 to 39 Minutes | 0 | 0.0% |
| 40 to 44 Minutes | 0 | 0.0% |
| 45 to 59 Minutes | 4 | 23.5% |
| 60 to 89 Minutes | 0 | 0.0% |
| 90 or more Minutes | 0 | 0.0% |
Commute Time by Sex in Amanda Park
| Commute Time | Male | Female |
| Less than 5 Minutes | 9 (52.9%) | 0 (0.0%) |
| 5 to 9 Minutes | 0 (0.0%) | 0 (0.0%) |
| 10 to 14 Minutes | 4 (23.5%) | 0 (0.0%) |
| 15 to 19 Minutes | 0 (0.0%) | 0 (0.0%) |
| 20 to 24 Minutes | 0 (0.0%) | 0 (0.0%) |
| 25 to 29 Minutes | 0 (0.0%) | 0 (0.0%) |
| 30 to 34 Minutes | 0 (0.0%) | 0 (0.0%) |
| 35 to 39 Minutes | 0 (0.0%) | 0 (0.0%) |
| 40 to 44 Minutes | 0 (0.0%) | 0 (0.0%) |
| 45 to 59 Minutes | 4 (23.5%) | 0 (0.0%) |
| 60 to 89 Minutes | 0 (0.0%) | 0 (0.0%) |
| 90 or more Minutes | 0 (0.0%) | 0 (0.0%) |
Time of Departure to Work by Sex in Amanda Park
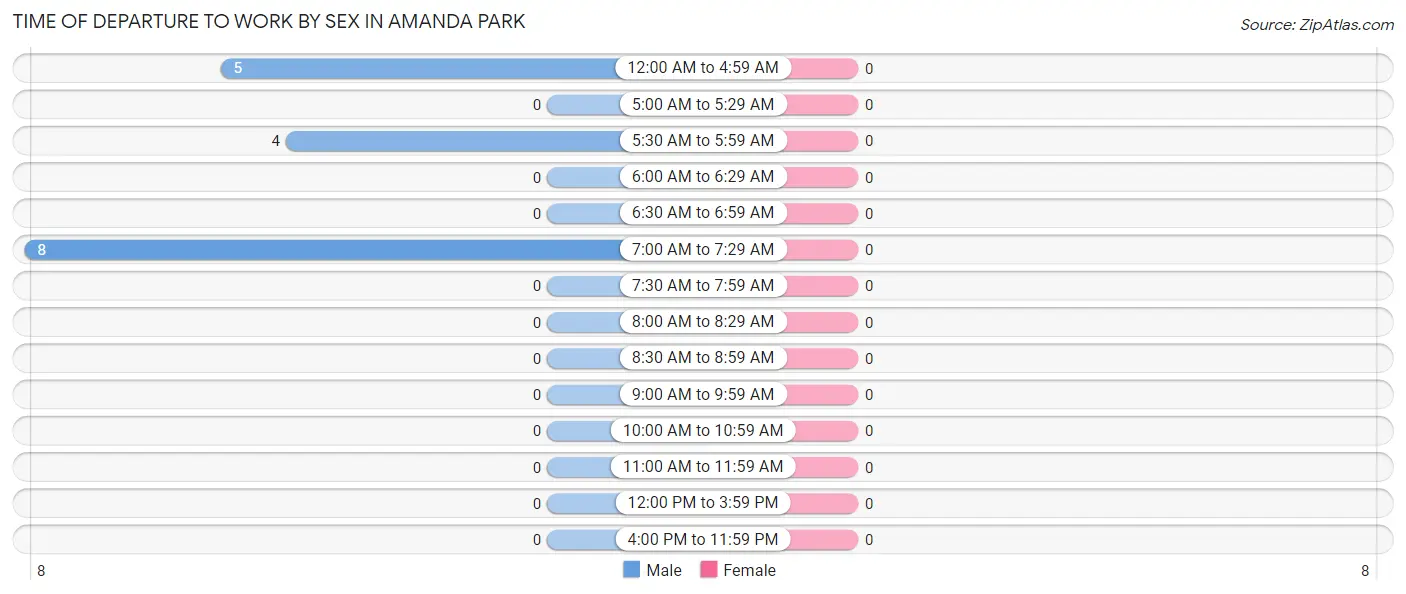
| Time of Departure | Male | Female |
| 12:00 AM to 4:59 AM | 5 (29.4%) | 0 (0.0%) |
| 5:00 AM to 5:29 AM | 0 (0.0%) | 0 (0.0%) |
| 5:30 AM to 5:59 AM | 4 (23.5%) | 0 (0.0%) |
| 6:00 AM to 6:29 AM | 0 (0.0%) | 0 (0.0%) |
| 6:30 AM to 6:59 AM | 0 (0.0%) | 0 (0.0%) |
| 7:00 AM to 7:29 AM | 8 (47.1%) | 0 (0.0%) |
| 7:30 AM to 7:59 AM | 0 (0.0%) | 0 (0.0%) |
| 8:00 AM to 8:29 AM | 0 (0.0%) | 0 (0.0%) |
| 8:30 AM to 8:59 AM | 0 (0.0%) | 0 (0.0%) |
| 9:00 AM to 9:59 AM | 0 (0.0%) | 0 (0.0%) |
| 10:00 AM to 10:59 AM | 0 (0.0%) | 0 (0.0%) |
| 11:00 AM to 11:59 AM | 0 (0.0%) | 0 (0.0%) |
| 12:00 PM to 3:59 PM | 0 (0.0%) | 0 (0.0%) |
| 4:00 PM to 11:59 PM | 0 (0.0%) | 0 (0.0%) |
| Total | 17 (100.0%) | 0 (0.0%) |
Housing Occupancy in Amanda Park
Occupancy by Ownership in Amanda Park
Of the total 28 dwellings in Amanda Park, owner-occupied units account for 21 (75.0%), while renter-occupied units make up 7 (25.0%).
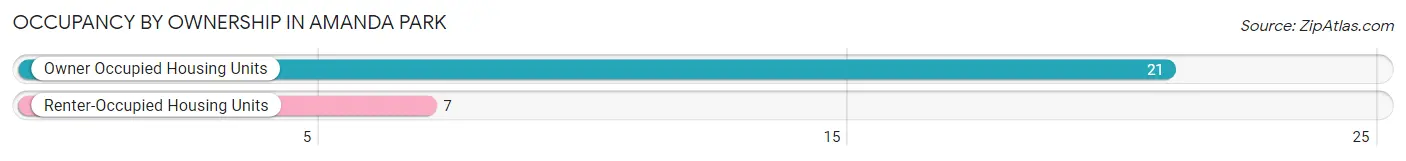
| Occupancy | # Housing Units | % Housing Units |
| Owner Occupied Housing Units | 21 | 75.0% |
| Renter-Occupied Housing Units | 7 | 25.0% |
| Total Occupied Housing Units | 28 | 100.0% |
Occupancy by Household Size in Amanda Park
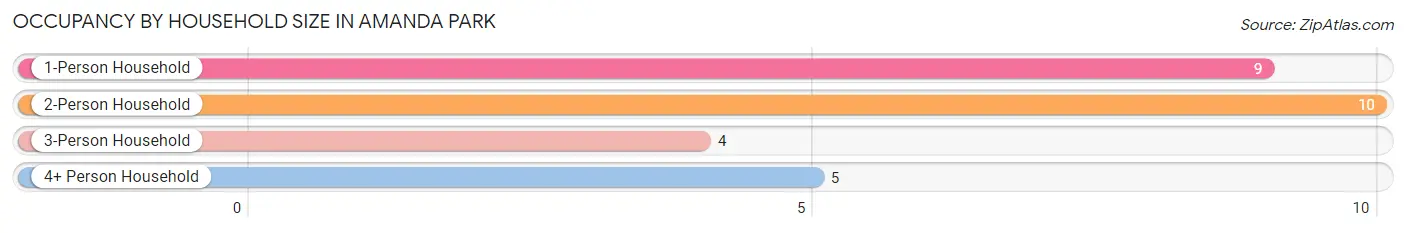
| Household Size | # Housing Units | % Housing Units |
| 1-Person Household | 9 | 32.1% |
| 2-Person Household | 10 | 35.7% |
| 3-Person Household | 4 | 14.3% |
| 4+ Person Household | 5 | 17.9% |
| Total Housing Units | 28 | 100.0% |
Occupancy by Ownership by Household Size in Amanda Park
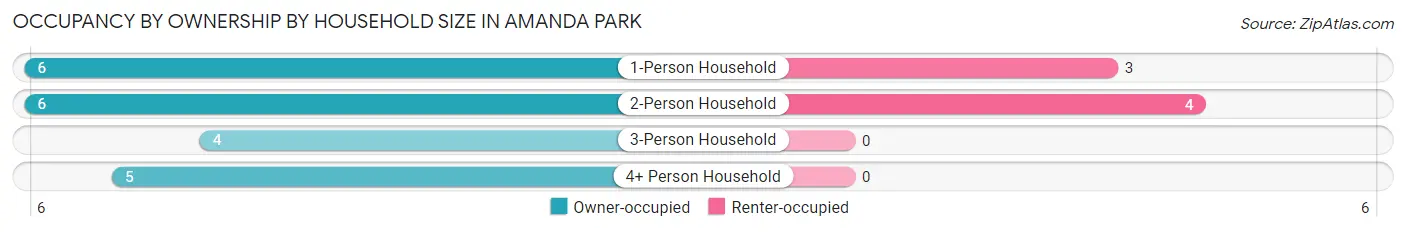
| Household Size | Owner-occupied | Renter-occupied |
| 1-Person Household | 6 (66.7%) | 3 (33.3%) |
| 2-Person Household | 6 (60.0%) | 4 (40.0%) |
| 3-Person Household | 4 (100.0%) | 0 (0.0%) |
| 4+ Person Household | 5 (100.0%) | 0 (0.0%) |
| Total Housing Units | 21 (75.0%) | 7 (25.0%) |
Occupancy by Educational Attainment in Amanda Park
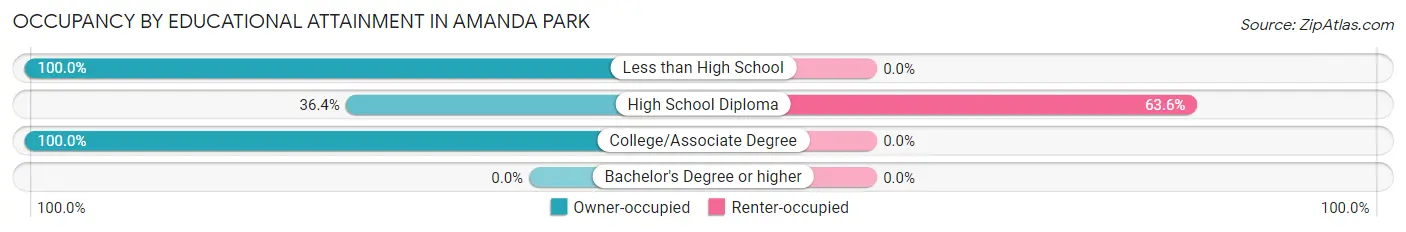
| Household Size | Owner-occupied | Renter-occupied |
| Less than High School | 7 (100.0%) | 0 (0.0%) |
| High School Diploma | 4 (36.4%) | 7 (63.6%) |
| College/Associate Degree | 10 (100.0%) | 0 (0.0%) |
| Bachelor's Degree or higher | 0 (0.0%) | 0 (0.0%) |
Occupancy by Age of Householder in Amanda Park
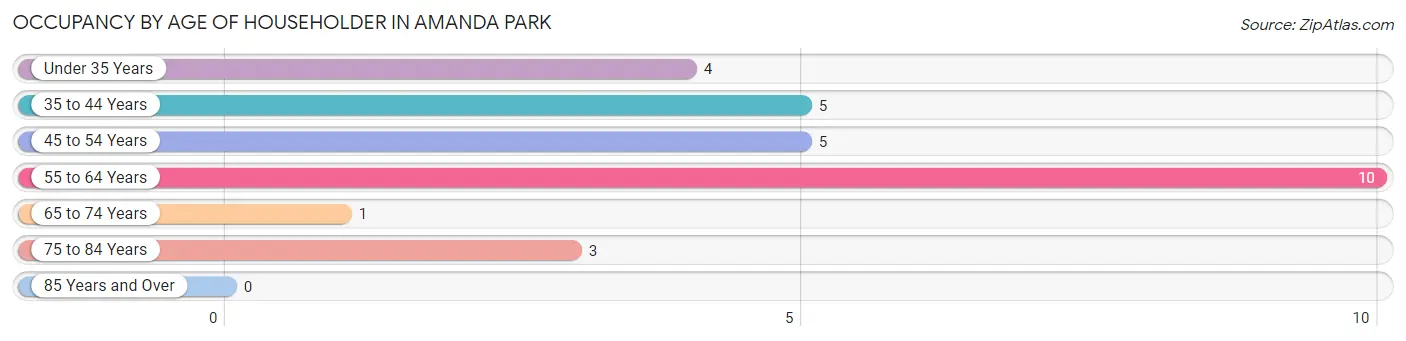
| Age Bracket | # Households | % Households |
| Under 35 Years | 4 | 14.3% |
| 35 to 44 Years | 5 | 17.9% |
| 45 to 54 Years | 5 | 17.9% |
| 55 to 64 Years | 10 | 35.7% |
| 65 to 74 Years | 1 | 3.6% |
| 75 to 84 Years | 3 | 10.7% |
| 85 Years and Over | 0 | 0.0% |
| Total | 28 | 100.0% |
Housing Finances in Amanda Park
Median Income by Occupancy in Amanda Park
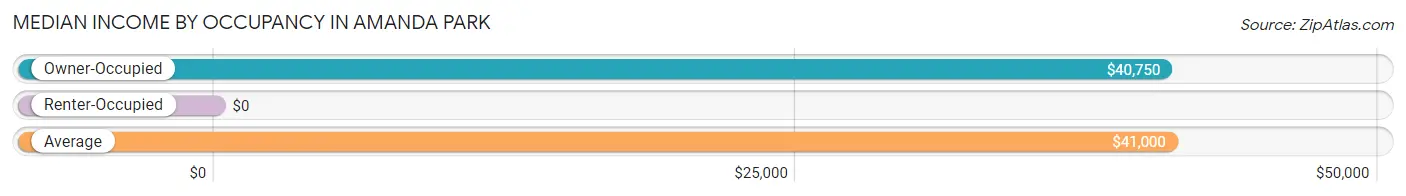
| Occupancy Type | # Households | Median Income |
| Owner-Occupied | 21 (75.0%) | $40,750 |
| Renter-Occupied | 7 (25.0%) | $0 |
| Average | 28 (100.0%) | $41,000 |
Occupancy by Householder Income Bracket in Amanda Park
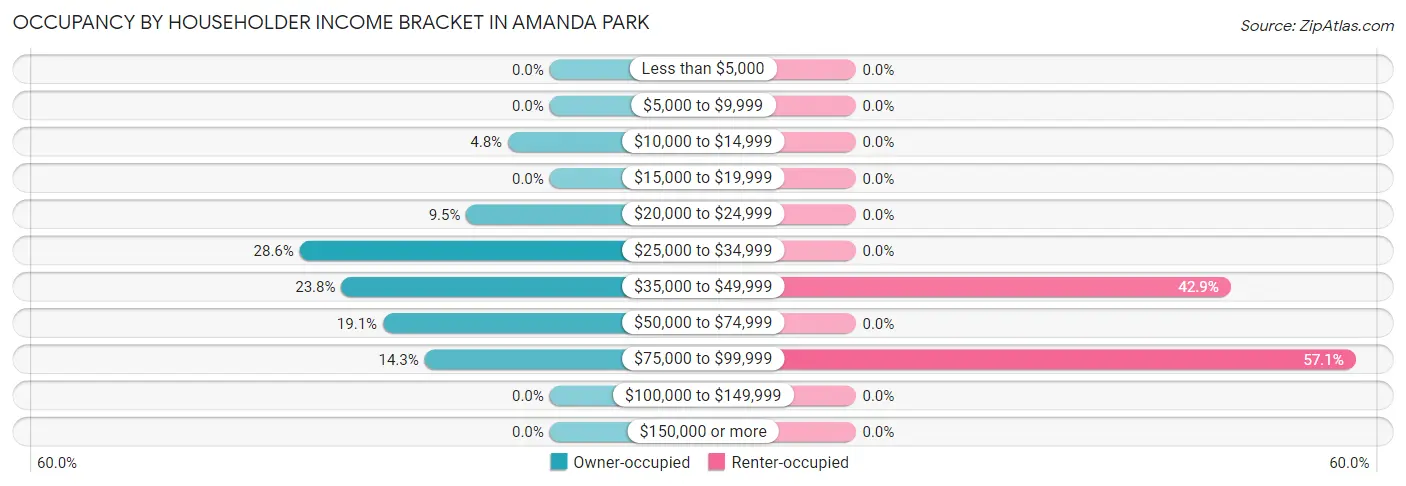
| Income Bracket | Owner-occupied | Renter-occupied |
| Less than $5,000 | 0 (0.0%) | 0 (0.0%) |
| $5,000 to $9,999 | 0 (0.0%) | 0 (0.0%) |
| $10,000 to $14,999 | 1 (4.8%) | 0 (0.0%) |
| $15,000 to $19,999 | 0 (0.0%) | 0 (0.0%) |
| $20,000 to $24,999 | 2 (9.5%) | 0 (0.0%) |
| $25,000 to $34,999 | 6 (28.6%) | 0 (0.0%) |
| $35,000 to $49,999 | 5 (23.8%) | 3 (42.9%) |
| $50,000 to $74,999 | 4 (19.1%) | 0 (0.0%) |
| $75,000 to $99,999 | 3 (14.3%) | 4 (57.1%) |
| $100,000 to $149,999 | 0 (0.0%) | 0 (0.0%) |
| $150,000 or more | 0 (0.0%) | 0 (0.0%) |
| Total | 21 (100.0%) | 7 (100.0%) |
Monthly Housing Cost Tiers in Amanda Park
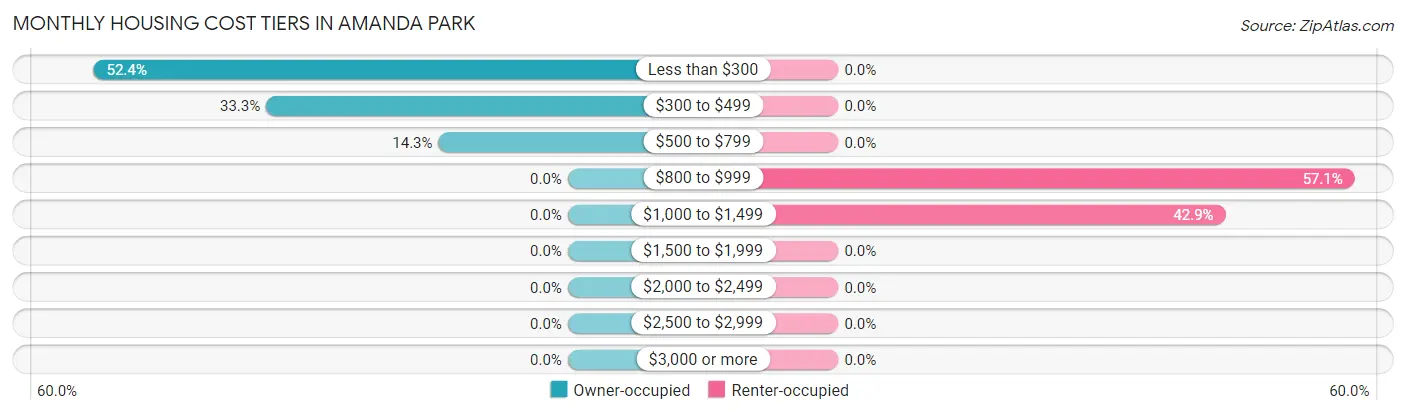
| Monthly Cost | Owner-occupied | Renter-occupied |
| Less than $300 | 11 (52.4%) | 0 (0.0%) |
| $300 to $499 | 7 (33.3%) | 0 (0.0%) |
| $500 to $799 | 3 (14.3%) | 0 (0.0%) |
| $800 to $999 | 0 (0.0%) | 4 (57.1%) |
| $1,000 to $1,499 | 0 (0.0%) | 3 (42.9%) |
| $1,500 to $1,999 | 0 (0.0%) | 0 (0.0%) |
| $2,000 to $2,499 | 0 (0.0%) | 0 (0.0%) |
| $2,500 to $2,999 | 0 (0.0%) | 0 (0.0%) |
| $3,000 or more | 0 (0.0%) | 0 (0.0%) |
| Total | 21 (100.0%) | 7 (100.0%) |
Physical Housing Characteristics in Amanda Park
Housing Structures in Amanda Park
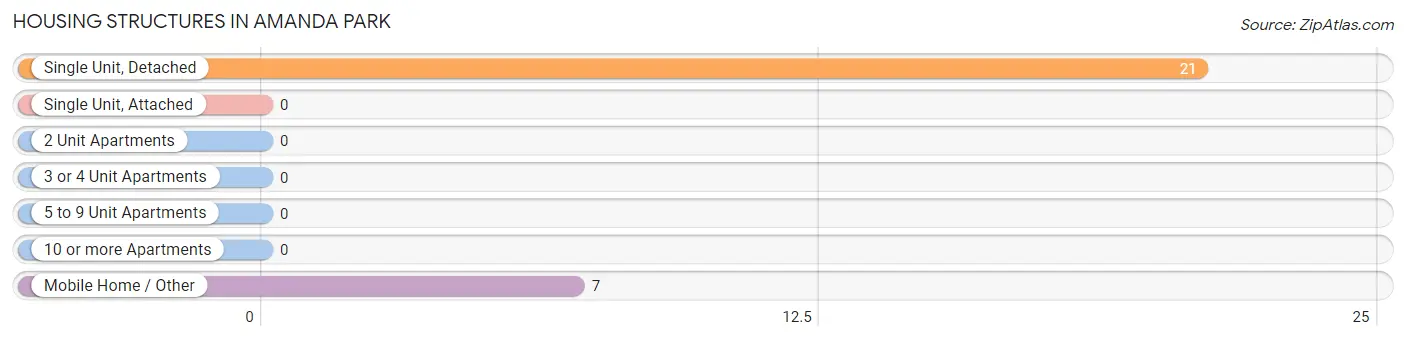
| Structure Type | # Housing Units | % Housing Units |
| Single Unit, Detached | 21 | 75.0% |
| Single Unit, Attached | 0 | 0.0% |
| 2 Unit Apartments | 0 | 0.0% |
| 3 or 4 Unit Apartments | 0 | 0.0% |
| 5 to 9 Unit Apartments | 0 | 0.0% |
| 10 or more Apartments | 0 | 0.0% |
| Mobile Home / Other | 7 | 25.0% |
| Total | 28 | 100.0% |
Housing Structures by Occupancy in Amanda Park
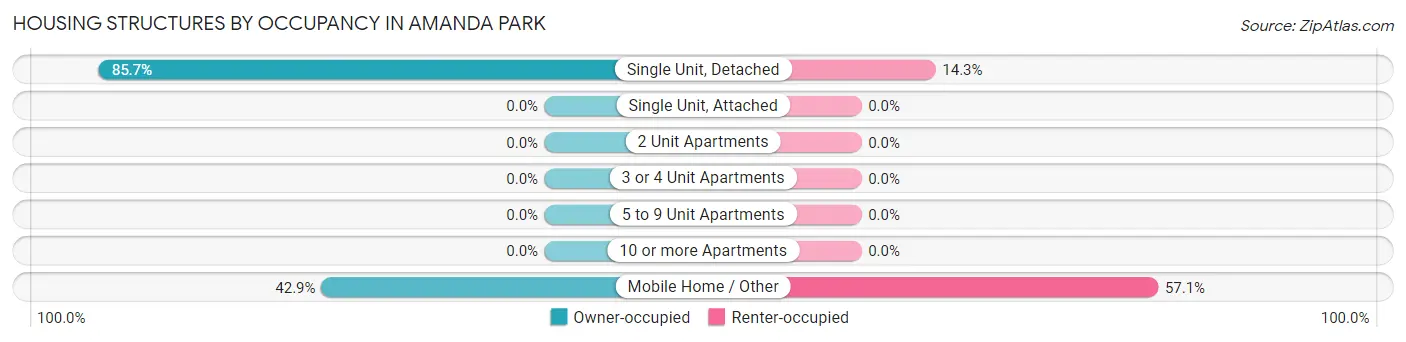
| Structure Type | Owner-occupied | Renter-occupied |
| Single Unit, Detached | 18 (85.7%) | 3 (14.3%) |
| Single Unit, Attached | 0 (0.0%) | 0 (0.0%) |
| 2 Unit Apartments | 0 (0.0%) | 0 (0.0%) |
| 3 or 4 Unit Apartments | 0 (0.0%) | 0 (0.0%) |
| 5 to 9 Unit Apartments | 0 (0.0%) | 0 (0.0%) |
| 10 or more Apartments | 0 (0.0%) | 0 (0.0%) |
| Mobile Home / Other | 3 (42.9%) | 4 (57.1%) |
| Total | 21 (75.0%) | 7 (25.0%) |
Housing Structures by Number of Rooms in Amanda Park
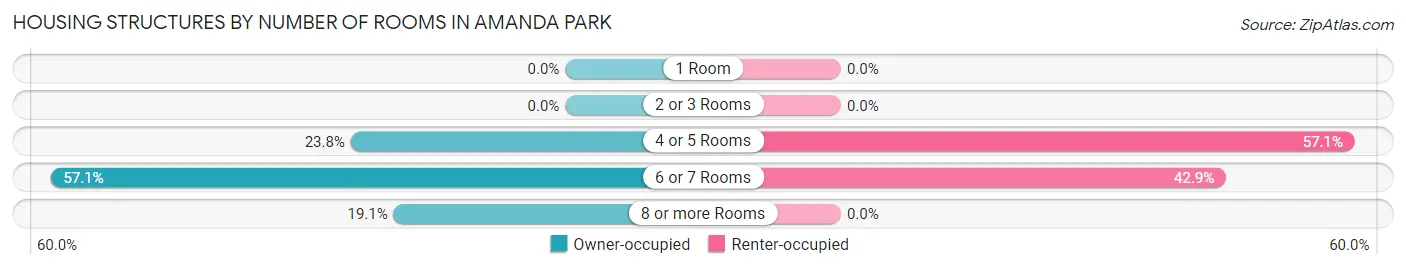
| Number of Rooms | Owner-occupied | Renter-occupied |
| 1 Room | 0 (0.0%) | 0 (0.0%) |
| 2 or 3 Rooms | 0 (0.0%) | 0 (0.0%) |
| 4 or 5 Rooms | 5 (23.8%) | 4 (57.1%) |
| 6 or 7 Rooms | 12 (57.1%) | 3 (42.9%) |
| 8 or more Rooms | 4 (19.1%) | 0 (0.0%) |
| Total | 21 (100.0%) | 7 (100.0%) |
Housing Structure by Heating Type in Amanda Park
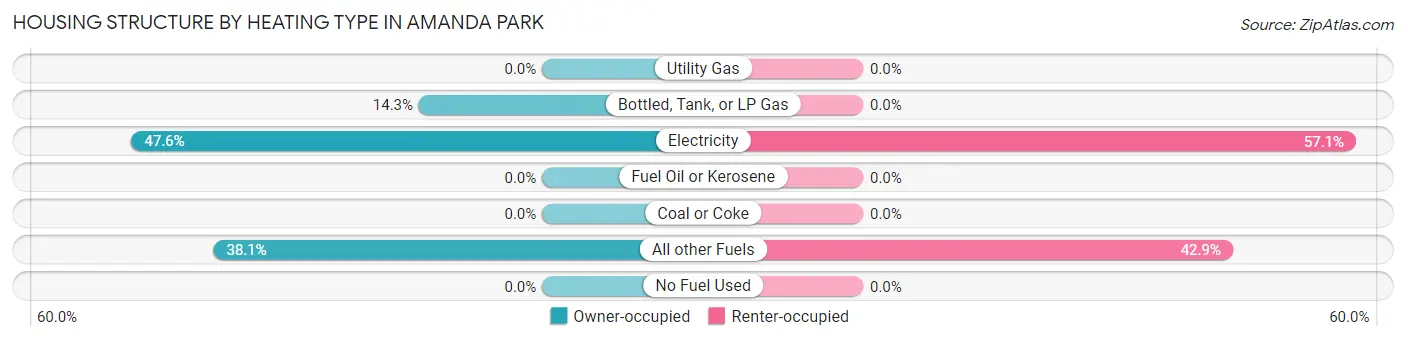
| Heating Type | Owner-occupied | Renter-occupied |
| Utility Gas | 0 (0.0%) | 0 (0.0%) |
| Bottled, Tank, or LP Gas | 3 (14.3%) | 0 (0.0%) |
| Electricity | 10 (47.6%) | 4 (57.1%) |
| Fuel Oil or Kerosene | 0 (0.0%) | 0 (0.0%) |
| Coal or Coke | 0 (0.0%) | 0 (0.0%) |
| All other Fuels | 8 (38.1%) | 3 (42.9%) |
| No Fuel Used | 0 (0.0%) | 0 (0.0%) |
| Total | 21 (100.0%) | 7 (100.0%) |
Household Vehicle Usage in Amanda Park
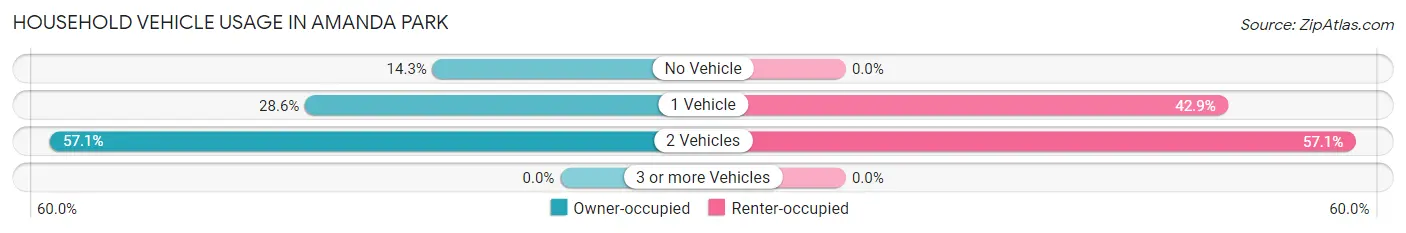
| Vehicles per Household | Owner-occupied | Renter-occupied |
| No Vehicle | 3 (14.3%) | 0 (0.0%) |
| 1 Vehicle | 6 (28.6%) | 3 (42.9%) |
| 2 Vehicles | 12 (57.1%) | 4 (57.1%) |
| 3 or more Vehicles | 0 (0.0%) | 0 (0.0%) |
| Total | 21 (100.0%) | 7 (100.0%) |
Real Estate & Mortgages in Amanda Park
Real Estate and Mortgage Overview in Amanda Park
| Characteristic | Without Mortgage | With Mortgage |
| Housing Units | 21 | 0 |
| Median Property Value | - | - |
| Median Household Income | $40,750 | $0 |
| Monthly Housing Costs | $245 | $0 |
| Real Estate Taxes | $199 | $0 |
Property Value by Mortgage Status in Amanda Park
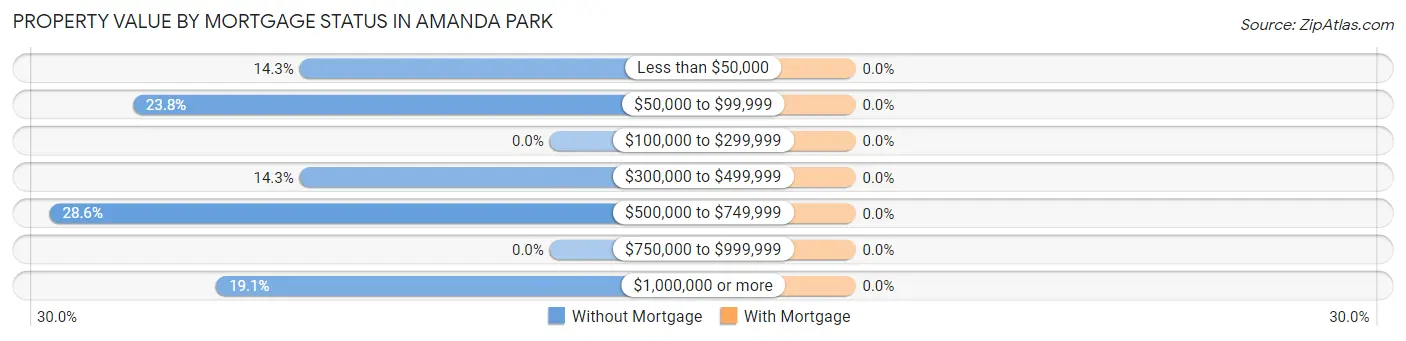
| Property Value | Without Mortgage | With Mortgage |
| Less than $50,000 | 3 (14.3%) | 0 (0.0%) |
| $50,000 to $99,999 | 5 (23.8%) | 0 (0.0%) |
| $100,000 to $299,999 | 0 (0.0%) | 0 (0.0%) |
| $300,000 to $499,999 | 3 (14.3%) | 0 (0.0%) |
| $500,000 to $749,999 | 6 (28.6%) | 0 (0.0%) |
| $750,000 to $999,999 | 0 (0.0%) | 0 (0.0%) |
| $1,000,000 or more | 4 (19.1%) | 0 (0.0%) |
| Total | 21 (100.0%) | 0 (0.0%) |
Household Income by Mortgage Status in Amanda Park
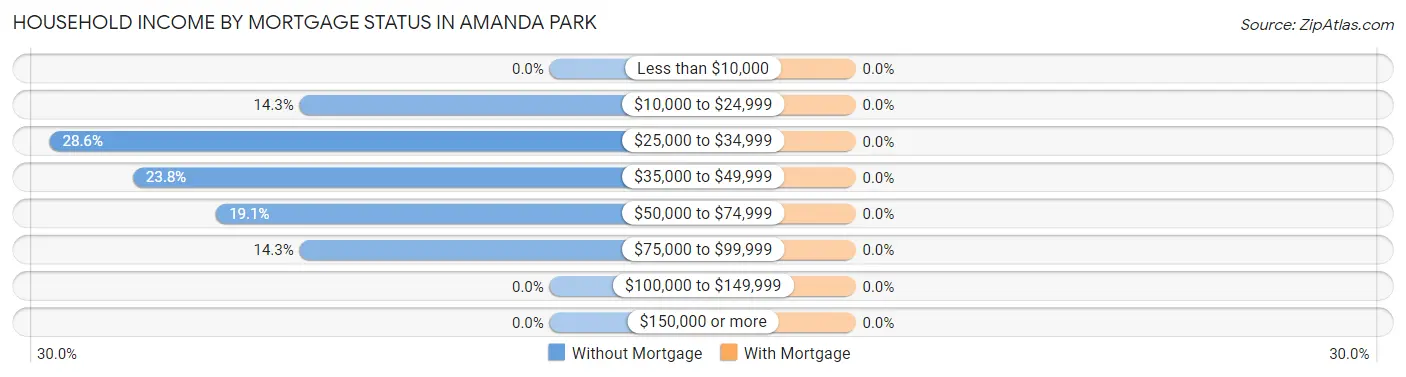
| Household Income | Without Mortgage | With Mortgage |
| Less than $10,000 | 0 (0.0%) | 0 (0.0%) |
| $10,000 to $24,999 | 3 (14.3%) | 0 (0.0%) |
| $25,000 to $34,999 | 6 (28.6%) | 0 (0.0%) |
| $35,000 to $49,999 | 5 (23.8%) | 0 (0.0%) |
| $50,000 to $74,999 | 4 (19.1%) | 0 (0.0%) |
| $75,000 to $99,999 | 3 (14.3%) | 0 (0.0%) |
| $100,000 to $149,999 | 0 (0.0%) | 0 (0.0%) |
| $150,000 or more | 0 (0.0%) | 0 (0.0%) |
| Total | 21 (100.0%) | 0 (0.0%) |
Property Value to Household Income Ratio in Amanda Park
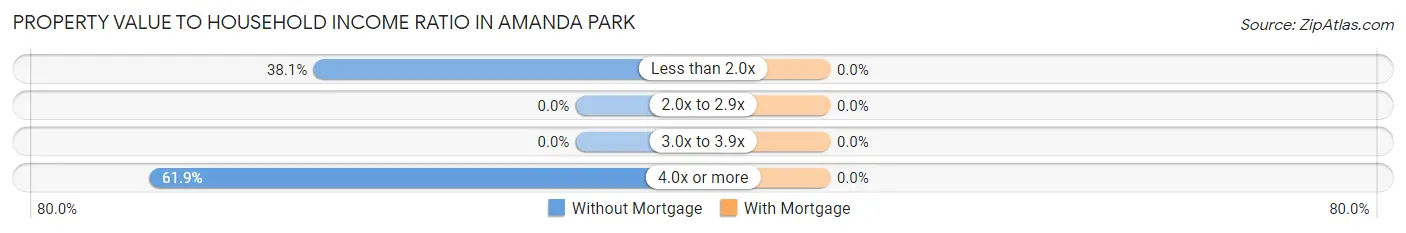
| Value-to-Income Ratio | Without Mortgage | With Mortgage |
| Less than 2.0x | 8 (38.1%) | 0 (0.0%) |
| 2.0x to 2.9x | 0 (0.0%) | 0 (0.0%) |
| 3.0x to 3.9x | 0 (0.0%) | 0 (0.0%) |
| 4.0x or more | 13 (61.9%) | 0 (0.0%) |
| Total | 21 (100.0%) | 0 (0.0%) |
Real Estate Taxes by Mortgage Status in Amanda Park
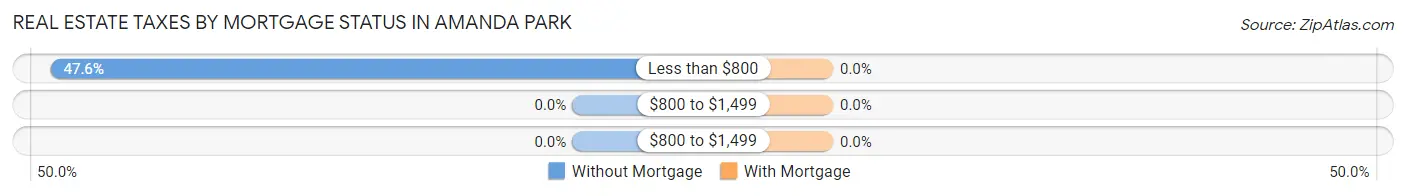
| Property Taxes | Without Mortgage | With Mortgage |
| Less than $800 | 10 (47.6%) | 0 (0.0%) |
| $800 to $1,499 | 0 (0.0%) | 0 (0.0%) |
| $800 to $1,499 | 0 (0.0%) | 0 (0.0%) |
| Total | 21 (100.0%) | 0 (0.0%) |
Health & Disability in Amanda Park
Health Insurance Coverage by Age in Amanda Park
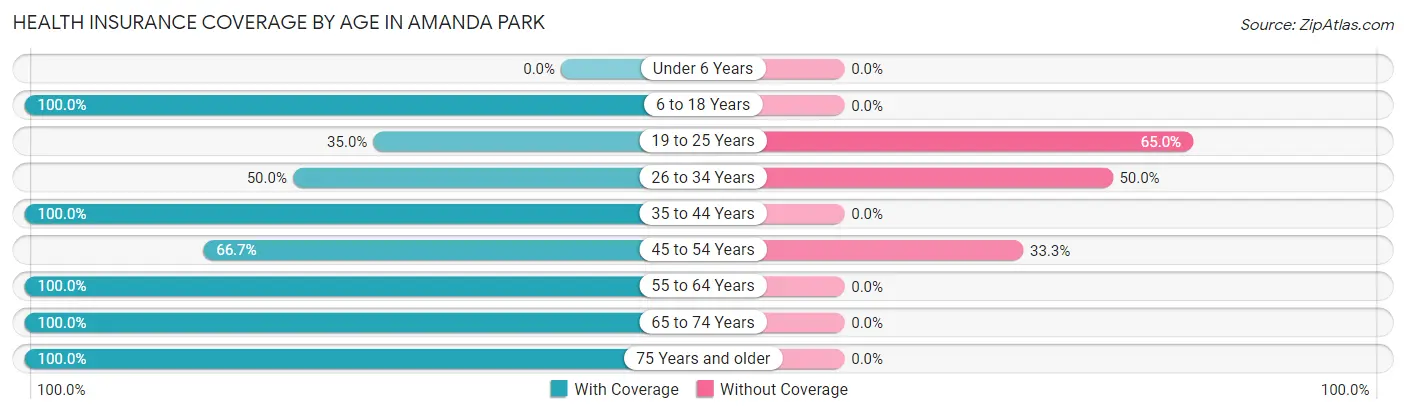
| Age Bracket | With Coverage | Without Coverage |
| Under 6 Years | 0 (0.0%) | 0 (0.0%) |
| 6 to 18 Years | 10 (100.0%) | 0 (0.0%) |
| 19 to 25 Years | 7 (35.0%) | 13 (65.0%) |
| 26 to 34 Years | 4 (50.0%) | 4 (50.0%) |
| 35 to 44 Years | 10 (100.0%) | 0 (0.0%) |
| 45 to 54 Years | 6 (66.7%) | 3 (33.3%) |
| 55 to 64 Years | 10 (100.0%) | 0 (0.0%) |
| 65 to 74 Years | 1 (100.0%) | 0 (0.0%) |
| 75 Years and older | 3 (100.0%) | 0 (0.0%) |
| Total | 51 (71.8%) | 20 (28.2%) |
Health Insurance Coverage by Citizenship Status in Amanda Park
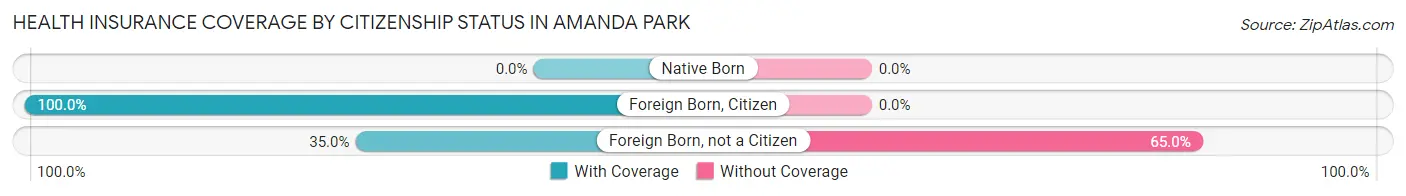
| Citizenship Status | With Coverage | Without Coverage |
| Native Born | 0 (0.0%) | 0 (0.0%) |
| Foreign Born, Citizen | 10 (100.0%) | 0 (0.0%) |
| Foreign Born, not a Citizen | 7 (35.0%) | 13 (65.0%) |
Health Insurance Coverage by Household Income in Amanda Park
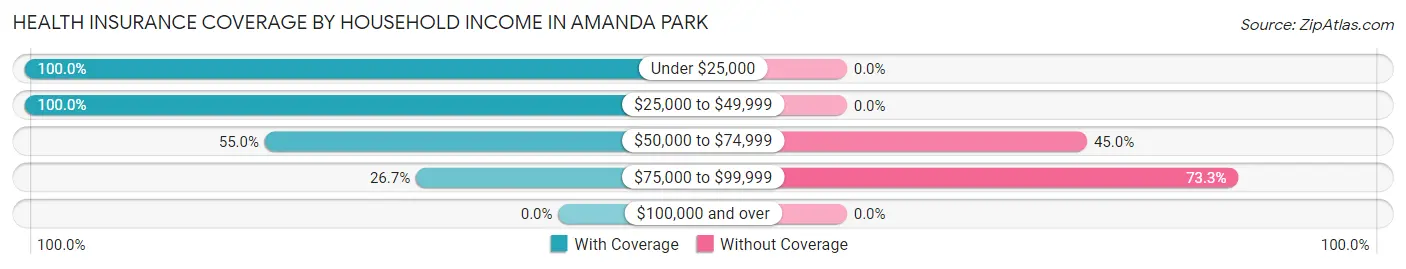
| Household Income | With Coverage | Without Coverage |
| Under $25,000 | 3 (100.0%) | 0 (0.0%) |
| $25,000 to $49,999 | 33 (100.0%) | 0 (0.0%) |
| $50,000 to $74,999 | 11 (55.0%) | 9 (45.0%) |
| $75,000 to $99,999 | 4 (26.7%) | 11 (73.3%) |
| $100,000 and over | 0 (0.0%) | 0 (0.0%) |
Public vs Private Health Insurance Coverage by Age in Amanda Park
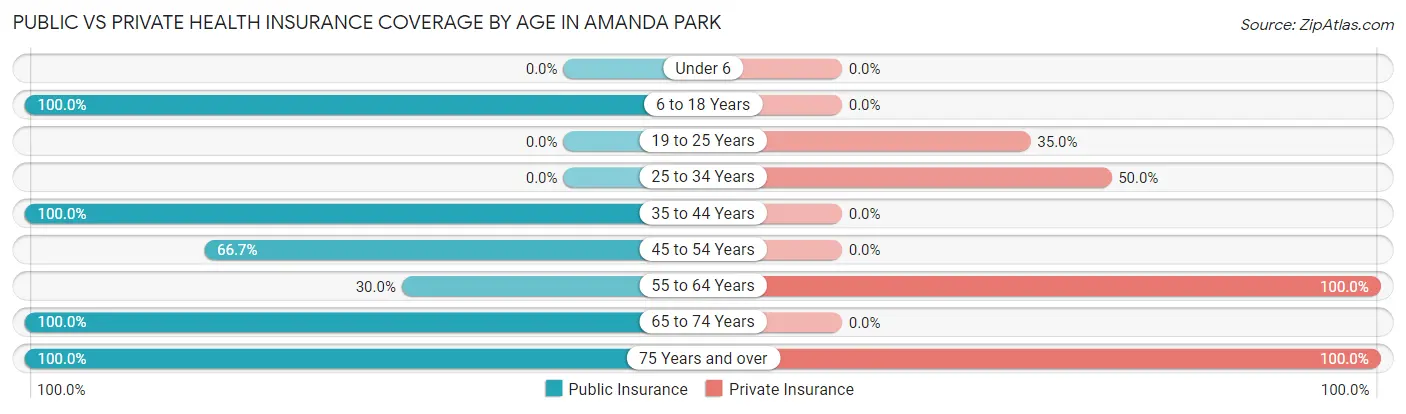
| Age Bracket | Public Insurance | Private Insurance |
| Under 6 | 0 (0.0%) | 0 (0.0%) |
| 6 to 18 Years | 10 (100.0%) | 0 (0.0%) |
| 19 to 25 Years | 0 (0.0%) | 7 (35.0%) |
| 25 to 34 Years | 0 (0.0%) | 4 (50.0%) |
| 35 to 44 Years | 10 (100.0%) | 0 (0.0%) |
| 45 to 54 Years | 6 (66.7%) | 0 (0.0%) |
| 55 to 64 Years | 3 (30.0%) | 10 (100.0%) |
| 65 to 74 Years | 1 (100.0%) | 0 (0.0%) |
| 75 Years and over | 3 (100.0%) | 3 (100.0%) |
| Total | 33 (46.5%) | 24 (33.8%) |
Disability Status by Sex by Age in Amanda Park
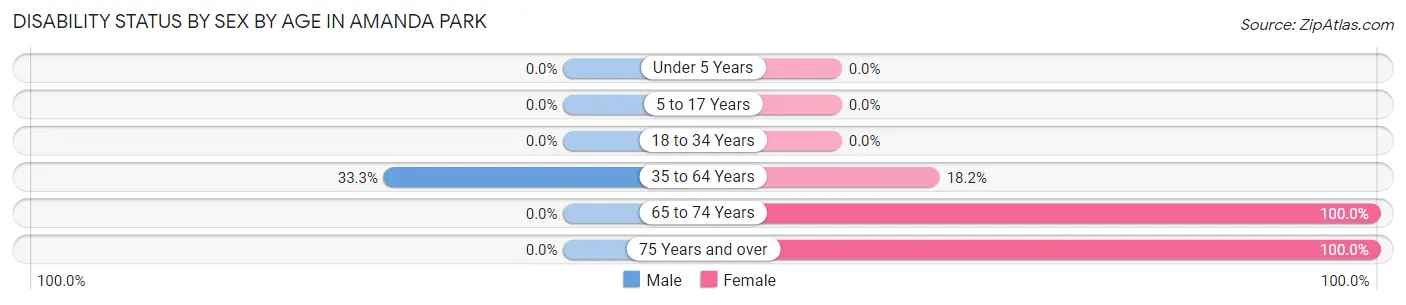
| Age Bracket | Male | Female |
| Under 5 Years | 0 (0.0%) | 0 (0.0%) |
| 5 to 17 Years | 0 (0.0%) | 0 (0.0%) |
| 18 to 34 Years | 0 (0.0%) | 0 (0.0%) |
| 35 to 64 Years | 6 (33.3%) | 2 (18.2%) |
| 65 to 74 Years | 0 (0.0%) | 1 (100.0%) |
| 75 Years and over | 0 (0.0%) | 3 (100.0%) |
Disability Class by Sex by Age in Amanda Park
Disability Class: Hearing Difficulty
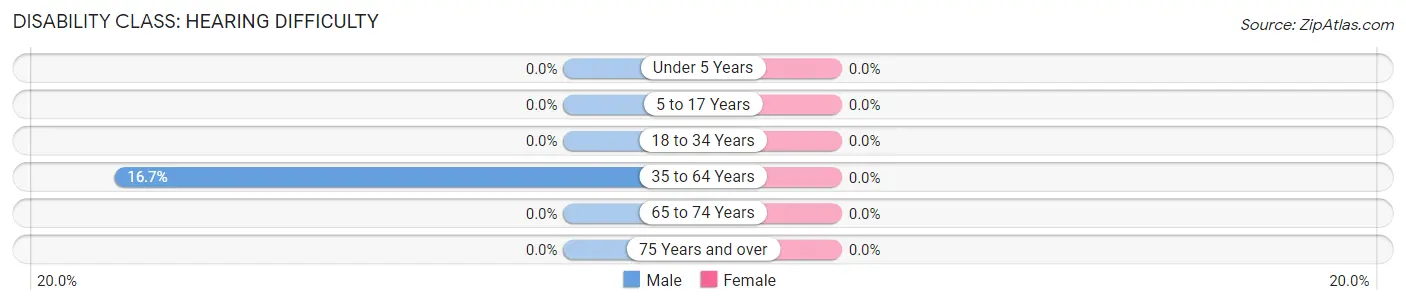
| Age Bracket | Male | Female |
| Under 5 Years | 0 (0.0%) | 0 (0.0%) |
| 5 to 17 Years | 0 (0.0%) | 0 (0.0%) |
| 18 to 34 Years | 0 (0.0%) | 0 (0.0%) |
| 35 to 64 Years | 3 (16.7%) | 0 (0.0%) |
| 65 to 74 Years | 0 (0.0%) | 0 (0.0%) |
| 75 Years and over | 0 (0.0%) | 0 (0.0%) |
Disability Class: Vision Difficulty
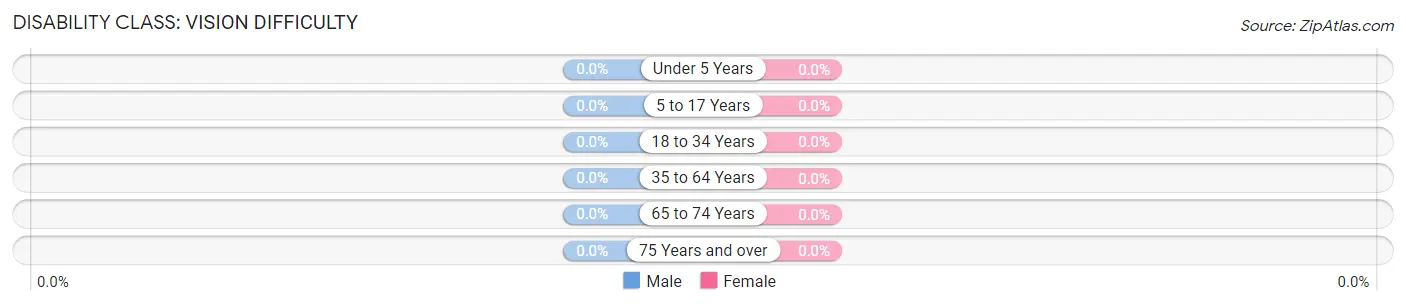
| Age Bracket | Male | Female |
| Under 5 Years | 0 (0.0%) | 0 (0.0%) |
| 5 to 17 Years | 0 (0.0%) | 0 (0.0%) |
| 18 to 34 Years | 0 (0.0%) | 0 (0.0%) |
| 35 to 64 Years | 0 (0.0%) | 0 (0.0%) |
| 65 to 74 Years | 0 (0.0%) | 0 (0.0%) |
| 75 Years and over | 0 (0.0%) | 0 (0.0%) |
Disability Class: Cognitive Difficulty
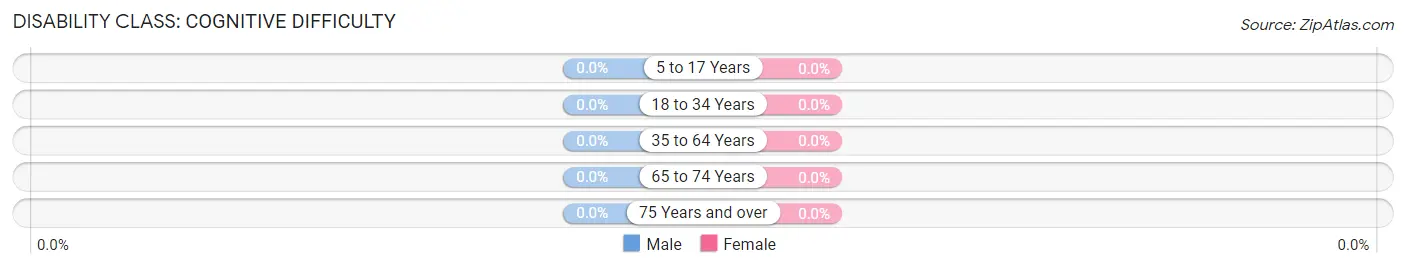
| Age Bracket | Male | Female |
| 5 to 17 Years | 0 (0.0%) | 0 (0.0%) |
| 18 to 34 Years | 0 (0.0%) | 0 (0.0%) |
| 35 to 64 Years | 0 (0.0%) | 0 (0.0%) |
| 65 to 74 Years | 0 (0.0%) | 0 (0.0%) |
| 75 Years and over | 0 (0.0%) | 0 (0.0%) |
Disability Class: Ambulatory Difficulty
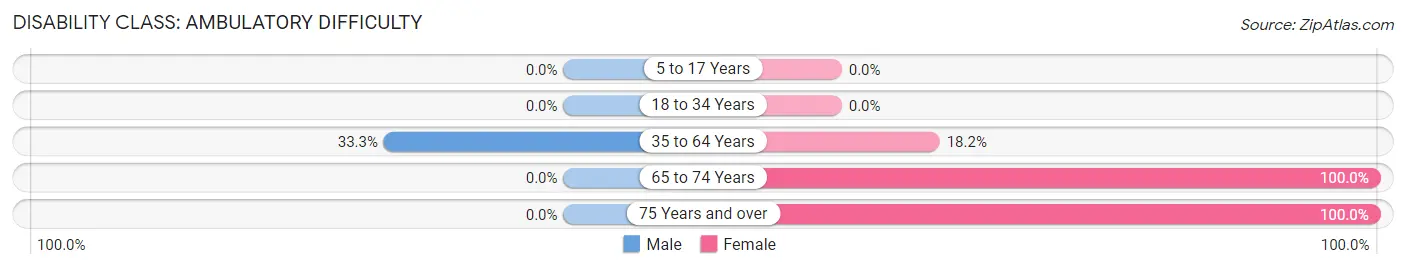
| Age Bracket | Male | Female |
| 5 to 17 Years | 0 (0.0%) | 0 (0.0%) |
| 18 to 34 Years | 0 (0.0%) | 0 (0.0%) |
| 35 to 64 Years | 6 (33.3%) | 2 (18.2%) |
| 65 to 74 Years | 0 (0.0%) | 1 (100.0%) |
| 75 Years and over | 0 (0.0%) | 3 (100.0%) |
Disability Class: Self-Care Difficulty
| Age Bracket | Male | Female |
| 5 to 17 Years | 0 (0.0%) | 0 (0.0%) |
| 18 to 34 Years | 0 (0.0%) | 0 (0.0%) |
| 35 to 64 Years | 0 (0.0%) | 0 (0.0%) |
| 65 to 74 Years | 0 (0.0%) | 0 (0.0%) |
| 75 Years and over | 0 (0.0%) | 0 (0.0%) |
Technology Access in Amanda Park
Computing Device Access in Amanda Park
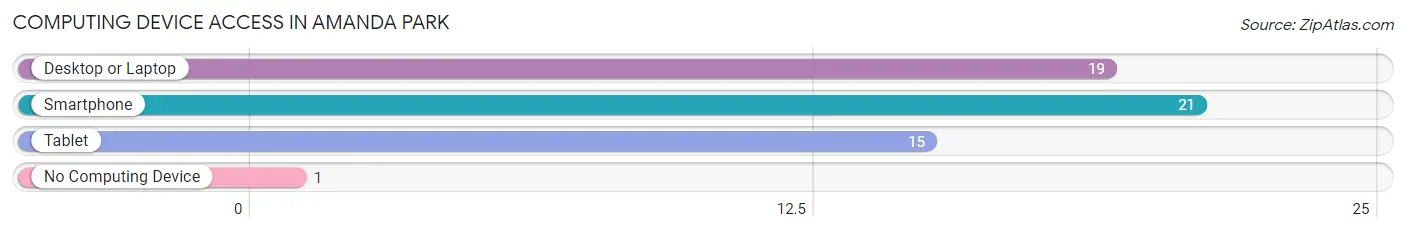
| Device Type | # Households | % Households |
| Desktop or Laptop | 19 | 67.9% |
| Smartphone | 21 | 75.0% |
| Tablet | 15 | 53.6% |
| No Computing Device | 1 | 3.6% |
| Total | 28 | 100.0% |
Internet Access in Amanda Park
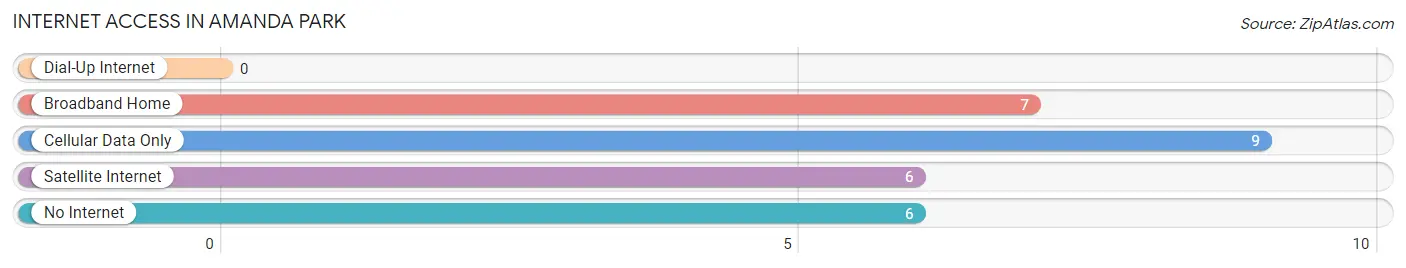
| Internet Type | # Households | % Households |
| Dial-Up Internet | 0 | 0.0% |
| Broadband Home | 7 | 25.0% |
| Cellular Data Only | 9 | 32.1% |
| Satellite Internet | 6 | 21.4% |
| No Internet | 6 | 21.4% |
| Total | 28 | 100.0% |
Amanda Park Summary
Amanda Park is a small unincorporated community located in Grays Harbor County, Washington. It is situated on the north shore of Lake Quinault, a large lake in the Olympic National Forest. The population of Amanda Park was estimated to be around 200 people in 2020.
History
The area that is now Amanda Park was first settled in the late 1800s by homesteaders. The first post office was established in 1891 and the town was named after Amanda Park, the daughter of one of the first settlers. The town grew slowly over the years, but it was not until the 1950s that it began to develop into a tourist destination.
In the 1950s, the area was developed as a resort community, with the construction of a lodge, cabins, and a golf course. The area was also popular for fishing and hunting. In the 1960s, the area was further developed with the construction of a marina and a campground.
Geography
Amanda Park is located in the Olympic National Forest, on the north shore of Lake Quinault. The lake is the largest natural lake in the Olympic National Forest and is surrounded by lush forests and mountains. The area is known for its abundant wildlife, including black bears, elk, deer, and bald eagles.
The climate in Amanda Park is mild and temperate, with warm summers and cool winters. The average annual temperature is around 50 degrees Fahrenheit. The area receives an average of 40 inches of rain per year.
Economy
The economy of Amanda Park is largely based on tourism. The area is popular for fishing, hunting, camping, and other outdoor activities. The area is also home to several resorts and lodges, which provide accommodations for visitors.
The area is also home to several small businesses, including restaurants, stores, and other services. The local economy is also supported by logging and timber harvesting.
Demographics
The population of Amanda Park was estimated to be around 200 people in 2020. The racial makeup of the town is predominantly white, with a small percentage of Native American and Hispanic residents. The median household income is around $35,000.
Conclusion
Amanda Park is a small unincorporated community located in Grays Harbor County, Washington. It is situated on the north shore of Lake Quinault, a large lake in the Olympic National Forest. The area is known for its abundant wildlife, mild climate, and outdoor activities. The economy of Amanda Park is largely based on tourism, with several resorts and lodges providing accommodations for visitors. The population of Amanda Park was estimated to be around 200 people in 2020.
Common Questions
What is Per Capita Income in Amanda Park?
Per Capita income in Amanda Park is $20,099.
What is the Median Family Income in Amanda Park?
Median Family Income in Amanda Park is $53,125.
What is the Median Household income in Amanda Park?
Median Household Income in Amanda Park is $41,000.
What is Inequality or Gini Index in Amanda Park?
Inequality or Gini Index in Amanda Park is 0.29.
What is the Total Population of Amanda Park?
Total Population of Amanda Park is 71.
What is the Total Male Population of Amanda Park?
Total Male Population of Amanda Park is 37.
What is the Total Female Population of Amanda Park?
Total Female Population of Amanda Park is 34.
What is the Ratio of Males per 100 Females in Amanda Park?
There are 108.82 Males per 100 Females in Amanda Park.
What is the Ratio of Females per 100 Males in Amanda Park?
There are 91.89 Females per 100 Males in Amanda Park.
What is the Median Population Age in Amanda Park?
Median Population Age in Amanda Park is 31.4 Years.
What is the Average Family Size in Amanda Park
Average Family Size in Amanda Park is 3.9 People.
What is the Average Household Size in Amanda Park
Average Household Size in Amanda Park is 2.5 People.
How Large is the Labor Force in Amanda Park?
There are 44 People in the Labor Forcein in Amanda Park.
What is the Percentage of People in the Labor Force in Amanda Park?
72.1% of People are in the Labor Force in Amanda Park.
What is the Unemployment Rate in Amanda Park?
Unemployment Rate in Amanda Park is 45.5%.