Zip Codes with the Highest Percentage of Population Employed in Accommodation & Food Services in Issaquah, WA
RELATED REPORTS & OPTIONS
Accommodation & Food Services
Issaquah
Compare Zip Codes
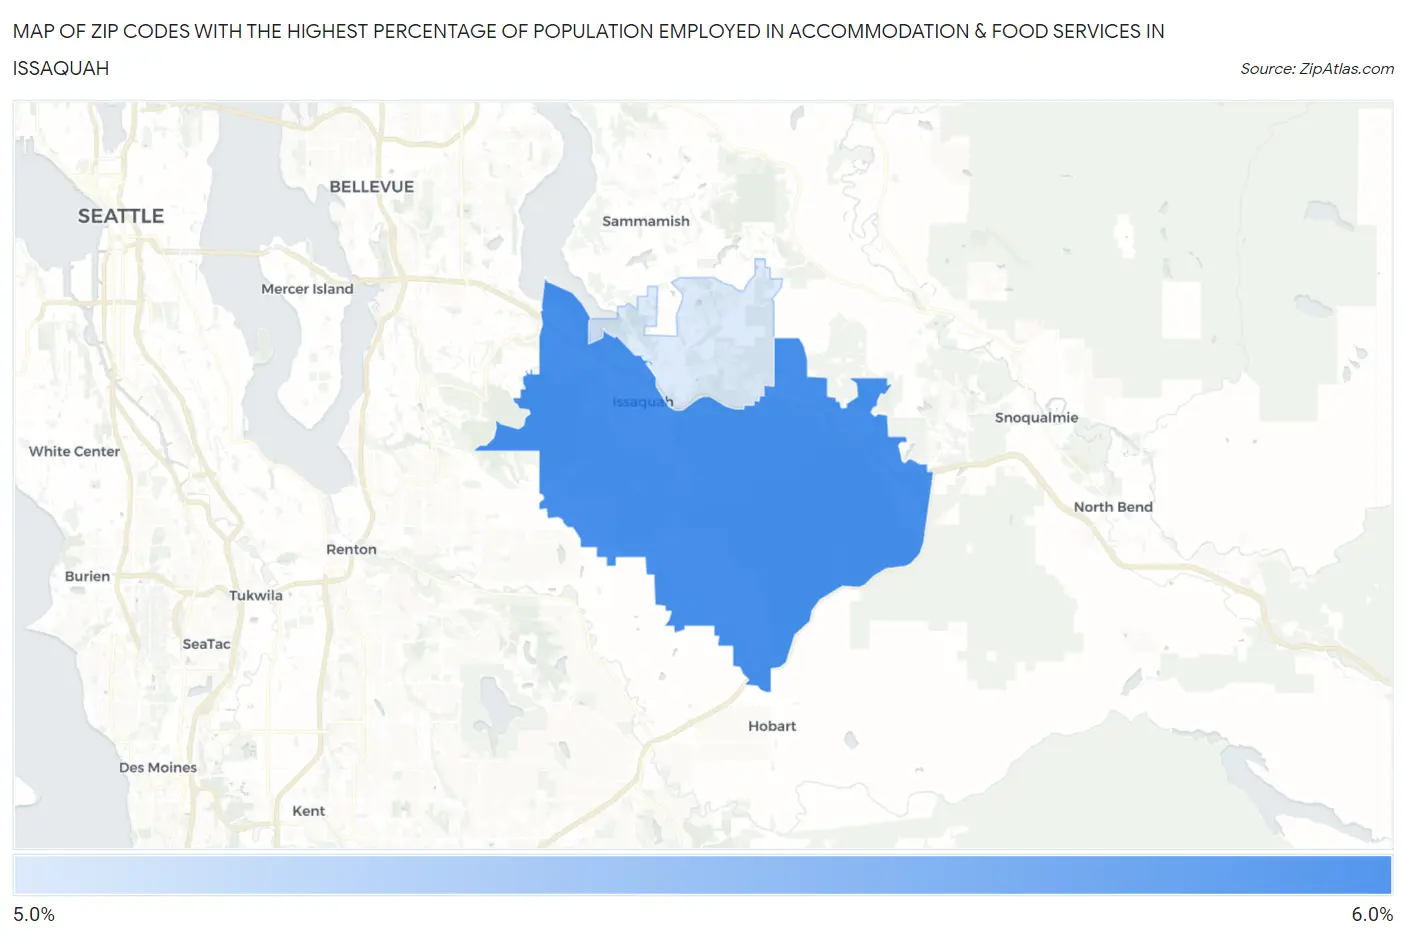
Map of Zip Codes with the Highest Percentage of Population Employed in Accommodation & Food Services in Issaquah
5.2%
5.2%
Zip Codes with the Highest Percentage of Population Employed in Accommodation & Food Services in Issaquah, WA
| Zip Code | % Employed | vs State | vs National | |
| 1. | 98027 | 5.2% | 6.5%(-1.29)#315 | 6.9%(-1.70)#16,176 |
| 2. | 98029 | 5.2% | 6.5%(-1.30)#318 | 6.9%(-1.72)#16,254 |
1
Common Questions
What are the Top Zip Codes with the Highest Percentage of Population Employed in Accommodation & Food Services in Issaquah, WA?
Top Zip Codes with the Highest Percentage of Population Employed in Accommodation & Food Services in Issaquah, WA are:
What zip code has the Highest Percentage of Population Employed in Accommodation & Food Services in Issaquah, WA?
98027 has the Highest Percentage of Population Employed in Accommodation & Food Services in Issaquah, WA with 5.2%.
What is the Percentage of Population Employed in Accommodation & Food Services in Issaquah, WA?
Percentage of Population Employed in Accommodation & Food Services in Issaquah is 5.5%.
What is the Percentage of Population Employed in Accommodation & Food Services in Washington?
Percentage of Population Employed in Accommodation & Food Services in Washington is 6.5%.
What is the Percentage of Population Employed in Accommodation & Food Services in the United States?
Percentage of Population Employed in Accommodation & Food Services in the United States is 6.9%.